 EMODnet Product Catalogue
IHE, Management Unit of North Sea and Scheldt Estuary Mathematical Models (Ostend)
Type of resources
Available actions
Topics
Keywords
Contact for the resource
Provided by
Years
Formats
Representation types
Resolution
-

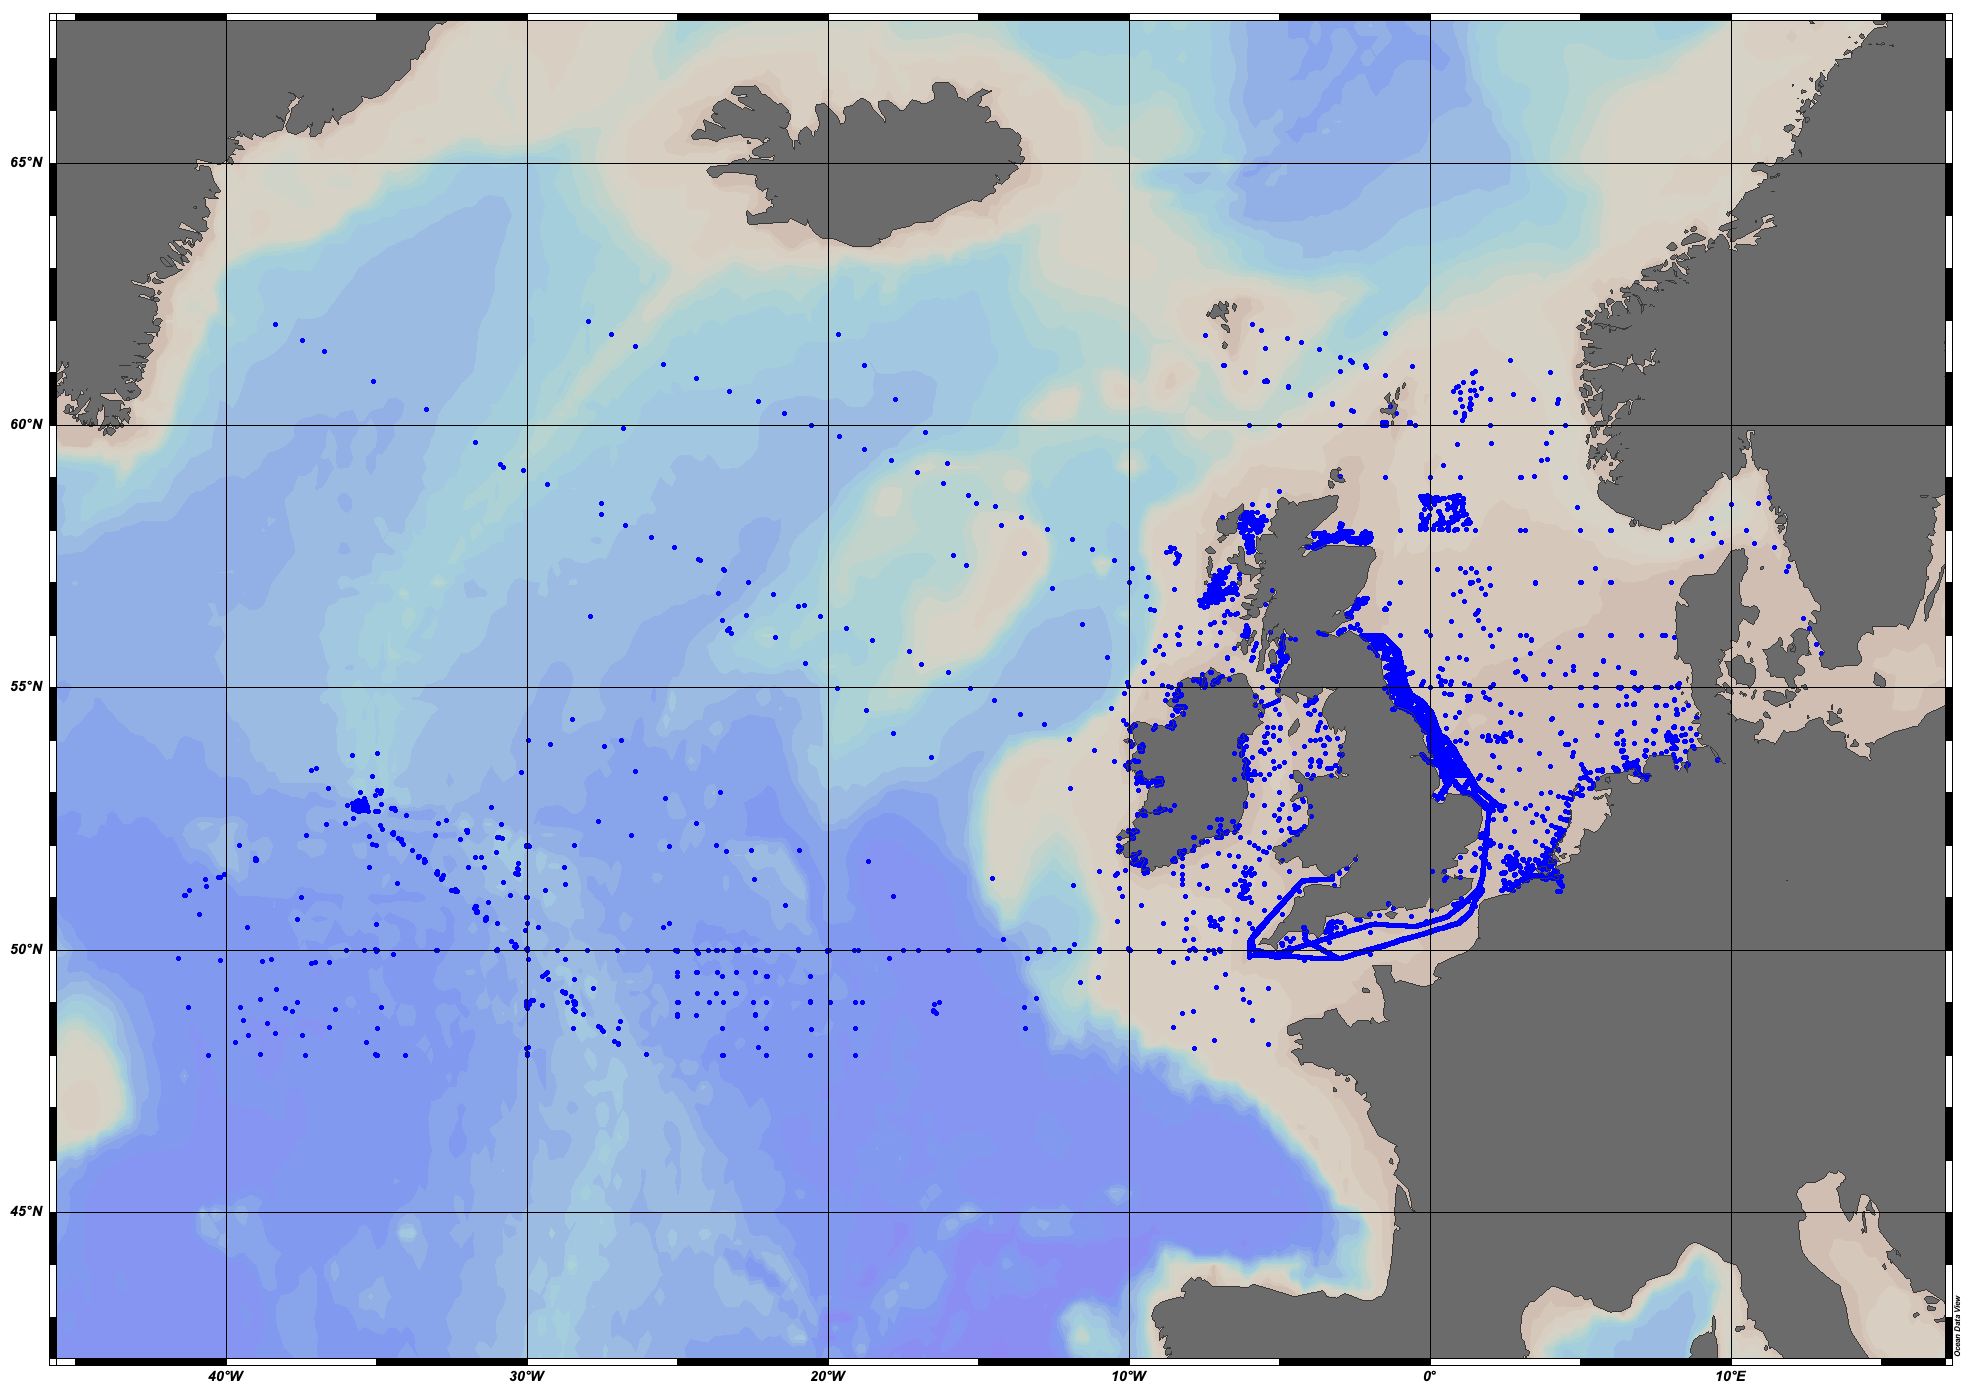
EMODnet Chemistry aims to provide access to marine chemistry datasets and derived data products concerning eutrophication, acidity and contaminants. The importance of the selected substances and other parameters relates to the Marine Strategy Framework Directive (MSFD). This aggregated dataset contains all unrestricted EMODnet Chemistry data on potential hazardous substances, despite the fact that some data might not be related to pollution (e.g. collected by deep corer). Temperature, salinity and additional parameters are included when available. It covers the Greater North Sea and Celtic Seas. Data were harmonised and validated by the 'Aarhus University, Department of Bioscience, Marine Ecology Roskilde' in Denmark. The dataset contains water (profiles), sediment (profiles) and biota (profiles and timeseries). The temporal coverage is 1970–2022 for water measurements, 1970–2021 for sediment measurements and 1979–2022 for biota measurements. Regional datasets concerning contaminants are automatically harvested and the resulting collections are harmonised and validated using ODV Software and following a common methodology for all sea regions ( https://doi.org/10.6092/8b52e8d7-dc92-4305-9337-7634a5cae3f4 ). Parameter names are based on P01 vocabulary, which relates to BODC Parameter Usage Vocabulary and is available at: https://vocab.nerc.ac.uk/search_nvs/P01/ . The harmonised dataset can be downloaded as as an ODV spreadsheet, which is composed of a metadata header followed by tab separated values. This spreadsheet can be imported into ODV Software for visualisation (more information can be found at: https://www.seadatanet.org/Software/ODV ). In addition, the same dataset is offered also as a txt file in a long/vertical format, in which each P01 measurement is a record line. Additionally, there are a series of columns that split P01 terms into subcomponents (substance, CAS number, matrix...).This transposed format is more adapted to worksheet applications (e.g. LibreOffice Calc).
-
EMODnet Chemistry aims to provide access to marine chemistry datasets and derived data products concerning eutrophication, acidity and contaminants. The importance of the selected substances and other parameters relates to the Marine Strategy Framework Directive (MSFD). This aggregated dataset contains all unrestricted EMODnet Chemistry data on potential hazardous substances, despite the fact that some data might not be related to pollution (e.g. collected by deep corer). Temperature, salinity and additional parameters are included when available. It covers the Greater North Sea and Celtic Seas. Data were harmonised and validated by the 'Aarhus University, Department of Bioscience, Marine Ecology Roskilde' in Denmark. The dataset contains water (profiles), sediment (profiles) and biota (profiles and timeseries). The temporal coverage is 1970–2021 for water measurements, 1973–2021 for sediment measurements and 1979–2021 for biota measurements. Regional datasets concerning contaminants are automatically harvested and the resulting collections are harmonised and validated using ODV Software and following a common methodology for all sea regions ( https://doi.org/10.6092/8b52e8d7-dc92-4305-9337-7634a5cae3f4). Parameter names are based on P01 vocabulary, which relates to BODC Parameter Usage Vocabulary and is available at: https://vocab.nerc.ac.uk/search_nvs/P01/. The harmonised dataset can be downloaded as as an ODV spreadsheet, which is composed of a metadata header followed by tab separated values. This spreadsheet can be imported into ODV Software for visualisation (more information can be found at: https://www.seadatanet.org/Software/ODV). In addition, the same dataset is offered also as a txt file in a long/vertical format, in which each P01 measurement is a record line. Additionally, there are a series of columns that split P01 terms into subcomponents (substance, CAS number, matrix...).This transposed format is more adapted to worksheet applications (e.g. LibreOffice Calc).
-
Water body ammonium - Monthly Climatology for the European Seas for the period 1960-2020 on the domain from longitude -45.0 to 70.0 degrees East and latitude 24.0 to 83.0 degrees North. Data Sources: observational data from SeaDataNet/EMODnet Chemistry Data Network. Description of DIVA analysis: The computation was done with the DIVAnd (Data-Interpolating Variational Analysis in n dimensions), version 2.7.9, using GEBCO 30sec topography for the spatial connectivity of water masses. Horizontal correlation length and vertical correlation length vary spatially depending on the topography and domain. Depth range: 0.0, 5.0, 10.0, 15.0, 20.0, 25.0, 30.0, 35.0, 40.0, 45.0, 50.0, 55.0, 60.0, 65.0, 70.0, 75.0, 80.0, 85.0, 90.0, 95.0, 100.0, 125.0, 150.0, 175.0, 200.0, 225.0, 250.0, 275.0, 300.0, 325.0, 350.0, 375.0, 400.0, 425.0, 450.0, 475.0, 500.0, 550.0, 600.0, 650.0, 700.0, 750.0, 800.0, 850.0, 900.0, 950.0, 1000.0, 1050.0, 1100.0, 1150.0, 1200.0, 1250.0, 1300.0, 1350.0, 1400.0, 1450.0, 1500.0, 1550.0, 1600.0, 1650.0, 1700.0, 1750.0, 1800.0, 1850.0, 1900.0, 1950.0, 2000.0, 2100.0, 2200.0, 2300.0, 2400.0, 2500.0, 2600.0, 2700.0, 2800.0, 2900.0, 3000.0, 3100.0, 3200.0, 3300.0, 3400.0, 3500.0, 3600.0, 3700.0, 3800.0, 3900.0, 4000.0, 4100.0, 4200.0, 4300.0, 4400.0, 4500.0, 4600.0, 4700.0, 4800.0, 4900.0, 5000.0, 5100.0, 5200.0, 5300.0, 5400.0, 5500.0 m. Units: umol/l. The horizontal resolution of the produced DIVAnd analysis is 0.25 degrees.
-
Water body phosphate - Monthly Climatology for the European Seas for the period 1960-2020 on the domain from longitude -45.0 to 70.0 degrees East and latitude 24.0 to 83.0 degrees North. Data Sources: observational data from SeaDataNet/EMODnet Chemistry Data Network. Description of DIVA analysis: The computation was done with the DIVAnd (Data-Interpolating Variational Analysis in n dimensions), version 2.7.9, using GEBCO 30sec topography for the spatial connectivity of water masses. Horizontal correlation length and vertical correlation length vary spatially depending on the topography and domain. Depth range: 0.0, 5.0, 10.0, 15.0, 20.0, 25.0, 30.0, 35.0, 40.0, 45.0, 50.0, 55.0, 60.0, 65.0, 70.0, 75.0, 80.0, 85.0, 90.0, 95.0, 100.0, 125.0, 150.0, 175.0, 200.0, 225.0, 250.0, 275.0, 300.0, 325.0, 350.0, 375.0, 400.0, 425.0, 450.0, 475.0, 500.0, 550.0, 600.0, 650.0, 700.0, 750.0, 800.0, 850.0, 900.0, 950.0, 1000.0, 1050.0, 1100.0, 1150.0, 1200.0, 1250.0, 1300.0, 1350.0, 1400.0, 1450.0, 1500.0, 1550.0, 1600.0, 1650.0, 1700.0, 1750.0, 1800.0, 1850.0, 1900.0, 1950.0, 2000.0, 2100.0, 2200.0, 2300.0, 2400.0, 2500.0, 2600.0, 2700.0, 2800.0, 2900.0, 3000.0, 3100.0, 3200.0, 3300.0, 3400.0, 3500.0, 3600.0, 3700.0, 3800.0, 3900.0, 4000.0, 4100.0, 4200.0, 4300.0, 4400.0, 4500.0, 4600.0, 4700.0, 4800.0, 4900.0, 5000.0, 5100.0, 5200.0, 5300.0, 5400.0, 5500.0 m. Units: umol/l. The horizontal resolution of the produced DIVAnd analysis is 0.25 degrees.
-
Water body dissolved inorganic nitrogen (DIN) - Monthly Climatology for the European Seas for the period 1960-2020 on the domain from longitude -45.0 to 70.0 degrees East and latitude 24.0 to 83.0 degrees North. Data Sources: observational data from SeaDataNet/EMODnet Chemistry Data Network. Description of DIVA analysis: The computation was done with the DIVAnd (Data-Interpolating Variational Analysis in n dimensions), version 2.7.9, using GEBCO 30sec topography for the spatial connectivity of water masses. Horizontal correlation length and vertical correlation length vary spatially depending on the topography and domain. Depth range: 0.0, 5.0, 10.0, 15.0, 20.0, 25.0, 30.0, 35.0, 40.0, 45.0, 50.0, 55.0, 60.0, 65.0, 70.0, 75.0, 80.0, 85.0, 90.0, 95.0, 100.0, 125.0, 150.0, 175.0, 200.0, 225.0, 250.0, 275.0, 300.0, 325.0, 350.0, 375.0, 400.0, 425.0, 450.0, 475.0, 500.0, 550.0, 600.0, 650.0, 700.0, 750.0, 800.0, 850.0, 900.0, 950.0, 1000.0, 1050.0, 1100.0, 1150.0, 1200.0, 1250.0, 1300.0, 1350.0, 1400.0, 1450.0, 1500.0, 1550.0, 1600.0, 1650.0, 1700.0, 1750.0, 1800.0, 1850.0, 1900.0, 1950.0, 2000.0, 2100.0, 2200.0, 2300.0, 2400.0, 2500.0, 2600.0, 2700.0, 2800.0, 2900.0, 3000.0, 3100.0, 3200.0, 3300.0, 3400.0, 3500.0, 3600.0, 3700.0, 3800.0, 3900.0, 4000.0, 4100.0, 4200.0, 4300.0, 4400.0, 4500.0, 4600.0, 4700.0, 4800.0, 4900.0, 5000.0, 5100.0, 5200.0, 5300.0, 5400.0, 5500.0 m. Units: umol/l. The horizontal resolution of the produced DIVAnd analysis is 0.25 degrees.
-
Water body silicate - Monthly Climatology for the European Seas for the period 1960-2020 on the domain from longitude -45.0 to 70.0 degrees East and latitude 24.0 to 83.0 degrees North. Data Sources: observational data from SeaDataNet/EMODnet Chemistry Data Network. Description of DIVA analysis: The computation was done with the DIVAnd (Data-Interpolating Variational Analysis in n dimensions), version 2.7.9, using GEBCO 30sec topography for the spatial connectivity of water masses. Horizontal correlation length and vertical correlation length vary spatially depending on the topography and domain. Depth range: 0.0, 5.0, 10.0, 15.0, 20.0, 25.0, 30.0, 35.0, 40.0, 45.0, 50.0, 55.0, 60.0, 65.0, 70.0, 75.0, 80.0, 85.0, 90.0, 95.0, 100.0, 125.0, 150.0, 175.0, 200.0, 225.0, 250.0, 275.0, 300.0, 325.0, 350.0, 375.0, 400.0, 425.0, 450.0, 475.0, 500.0, 550.0, 600.0, 650.0, 700.0, 750.0, 800.0, 850.0, 900.0, 950.0, 1000.0, 1050.0, 1100.0, 1150.0, 1200.0, 1250.0, 1300.0, 1350.0, 1400.0, 1450.0, 1500.0, 1550.0, 1600.0, 1650.0, 1700.0, 1750.0, 1800.0, 1850.0, 1900.0, 1950.0, 2000.0, 2100.0, 2200.0, 2300.0, 2400.0, 2500.0, 2600.0, 2700.0, 2800.0, 2900.0, 3000.0, 3100.0, 3200.0, 3300.0, 3400.0, 3500.0, 3600.0, 3700.0, 3800.0, 3900.0, 4000.0, 4100.0, 4200.0, 4300.0, 4400.0, 4500.0, 4600.0, 4700.0, 4800.0, 4900.0, 5000.0, 5100.0, 5200.0, 5300.0, 5400.0, 5500.0 m. Units: umol/l. The horizontal resolution of the produced DIVAnd analysis is 0.25 degrees.
-
Moving 6-year analysis and visualization of Water body chlorophyll-a in the North Sea. Four seasons (December-February, March-May, June-August, September-November). Data Sources: observational data from SeaDataNet/EMODnet Chemistry Data Network. Description of DIVA analysis: Geostatistical data analysis by DIVAnd (Data-Interpolating Variational Analysis) tool, version 2.7.9. results were subjected to the minfield option in DIVAnd to avoid negative/underestimated values in the interpolated results; error threshold masks L1 (0.3) and L2 (0.5) are included as well as the unmasked field. The depth dimension allows visualizing the gridded field at various depths.
-
Moving 6-year analysis and visualization of DIN in the North Sea. Four seasons (December-February, March-May, June-August, September-November). Data Sources: observational data from SeaDataNet/EMODnet Chemistry Data Network. Description of DIVA analysis: Geostatistical data analysis by DIVAnd (Data-Interpolating Variational Analysis) tool, version 2.7.9. results were subjected to the minfield option in DIVAnd to avoid negative/underestimated values in the interpolated results; error threshold masks L1 (0.3) and L2 (0.5) are included as well as the unmasked field. The depth dimension allows visualizing the gridded field at various depths.
-
Moving 6-year analysis and visualization of Water body silicate in the North Sea. Four seasons (December-February, March-May, June-August, September-November). Data Sources: observational data from SeaDataNet/EMODnet Chemistry Data Network. Description of DIVA analysis: Geostatistical data analysis by DIVAnd (Data-Interpolating Variational Analysis) tool, version 2.7.9. results were subjected to the minfield option in DIVAnd to avoid negative/underestimated values in the interpolated results; error threshold masks L1 (0.3) and L2 (0.5) are included as well as the unmasked field. The depth dimension allows visualizing the gridded field at various depths.
-
Moving 6-year analysis and visualization of Water body phosphate in the North Sea. Four seasons (December-February, March-May, June-August, September-November). Data Sources: observational data from SeaDataNet/EMODnet Chemistry Data Network. Description of DIVA analysis: Geostatistical data analysis by DIVAnd (Data-Interpolating Variational Analysis) tool, version 2.7.9. results were subjected to the minfield option in DIVAnd to avoid negative/underestimated values in the interpolated results; error threshold masks L1 (0.3) and L2 (0.5) are included as well as the unmasked field. The depth dimension allows visualizing the gridded field at various depths.