 EMODnet Product Catalogue
Coral Sea
Type of resources
Available actions
Topics
Keywords
Contact for the resource
Provided by
Years
Representation types
-
Size structure of populations (shell length in mm) and oocyte size (in µm) distribution of three hydrothermal vent gastropod species (Lepetodrilus schrolli, L. fijiensis and Shinkailepas tollmanni) of the South West Pacific back-arc basins. Individuals were collected in Bathymodiolus spp. and Ifremeria nautilei habitats at several vent sites in the Manus, North Fiji, Futuna and Lau back-arc basins during the CHUBACARC cruise in 2019. These data were collected through stereoscopic microscope observations and hostological analyses on several individuals of each species. Important Note: This submission has been initially submitted to SEA scieNtific Open data Edition (SEANOE) publication service and received the recorded DOI. The metadata elements have been further processed (refined) in EMODnet Ingestion Service in order to conform with the Data Submission Service specifications.
-
Field trips have been conducted from February 2019 to May 2020 in Poe lagoon (South Province - New Caledonia) to characterize its hydrodynamic processes and functionning. This shallow lagoon belongs to a wider area which has been registered at the UNESCO World Natural Heritage list in 2008 and has experienced recently beaching of seaweed (ulva sp.). A dedicated project (ELADE) has been launched to investigate paths of enrichment of this lagoon. This dataset belongs to the Hydrodynamics Task of this multidisciplinary project. Several moorings (~ 15) have been placed for observations of currents, temperature, pressure and salinity dynamics during 2 legs (Feb. to May 2019 ; July-August 2019). During this field period, one major atmospheric event happened in February 2019 : OMA cyclone. From september 2019 to may 2020, a single station (temperature, salinity, pressure) has been kept in the area of maximum ulva biomass. Sampling strategy avalaible on (Sextant - Marine Geographic Information System)-[https://sextant.ifremer.fr/record/5d2e6d07-6b8d-4c01-8cb3-41d8ef4a6518/]. More information on (PRESENCE project)-[https://wwz.ifremer.fr/nouvelle_caledonie/Recherches-expertises/Vulnerabilite-des-ecosystemes-recifo-lagonaires]. Important Note: This submission has been initially submitted to SEA scieNtific Open data Edition (SEANOE) publication service and received the recorded DOI. The metadata elements have been further processed (refined) in EMODnet Ingestion Service in order to conform with the Data Submission Service specifications.
-

This visualization product displays the density of floating micro-litter per net normalized per km² per year from specific protocols different from research and monitoring protocols. EMODnet Chemistry included the collection of marine litter in its 3rd phase. Before 2021, there was no coordinated effort at the regional or European scale for micro-litter. Given this situation, EMODnet Chemistry proposed to adopt the data gathering and data management approach as generally applied for marine data, i.e., populating metadata and data in the CDI Data Discovery and Access service using dedicated SeaDataNet data transport formats. EMODnet Chemistry is currently the official EU collector of micro-litter data from Marine Strategy Framework Directive (MSFD) National Monitoring activities (descriptor 10). A series of specific standard vocabularies or standard terms related to micro-litter have been added to SeaDataNet NVS (NERC Vocabulary Server) Common Vocabularies to describe the micro-litter. European micro-litter data are collected by the National Oceanographic Data Centres (NODCs). Micro-litter map products are generated from NODCs data after a test of the aggregated collection including data and data format checks and data harmonization. A filter is applied to represent only micro-litter sampled according to a very specific protocol such as the Volvo Ocean Race (VOR) or Oceaneye. Densities were calculated for each net using the following calculation: Density (number of particles per km²) = Micro-litter count / (Sampling effort (km) * Net opening (cm) * 0.00001) When the number of microlitters or the net opening was not filled, it was not possible to calculate the density. Percentiles 50, 75, 95 & 99 have been calculated taking into account data for all years. Warning: the absence of data on the map does no't necessarily mean that they do not exist, but that no information has been entered in the National Oceanographic Data Centre (NODC) for this area.
-
Coral reefs are one of the most diverse ecosystems on Earth. They are currently exposed to increasing levels of anthropogenic perturbations. Several recent reviews point to the lack of good indicators for these perturbations especially to monitor their effects on fish populations or fish assemblages. The SW lagoon of New Caledonia is an ideal location to test indicator species in this context as contrasting sites are present within a small geographical range. This study analysed fish from four sites, one with heavy industrial pollution, another dominated by domestic waste, a third with historic mining activities, and the fourth as a control. The butterfly fish, Chaetodon speculum, was chosen to determine C. speculum’s potential as an indicator species due to its link to coral, its sedentary behaviour and its wide geographical distribution. The size distribution, growth rate, age distribution and whole otolith composition were analysed at each site. Age and mean growth rate were analysed from daily increments of the otoliths. The concentrations of eight elements (Li, Mg, Co, Cu, Rb, Sr, and Ba) were measured by ICP-MS in the otoliths. The sites under anthropogenic impact were distinct from the control site by fish size frequencies, age distributions, and the chemical content of their otoliths. The chemical elements Mg, Co, Cu, and Rb showed differences amongst sites. Fish belonging to the sites furthest from Noume´a could be discriminated in nearly 80% of samples or 60% of the cases when otolith weight or fish age respectively were taken into account. Ni concentrations of the otoliths were also higher in the bays where water concentrations of this element were known to be higher, but these differences were no longer significant once corrected for otolith weight. Important Note: This submission has been initially submitted to SEA scieNtific Open data Edition (SEANOE) publication service and received the recorded DOI. The metadata elements have been further processed (refined) in EMODnet Ingestion Service in order to conform with the Data Submission Service specifications.
-
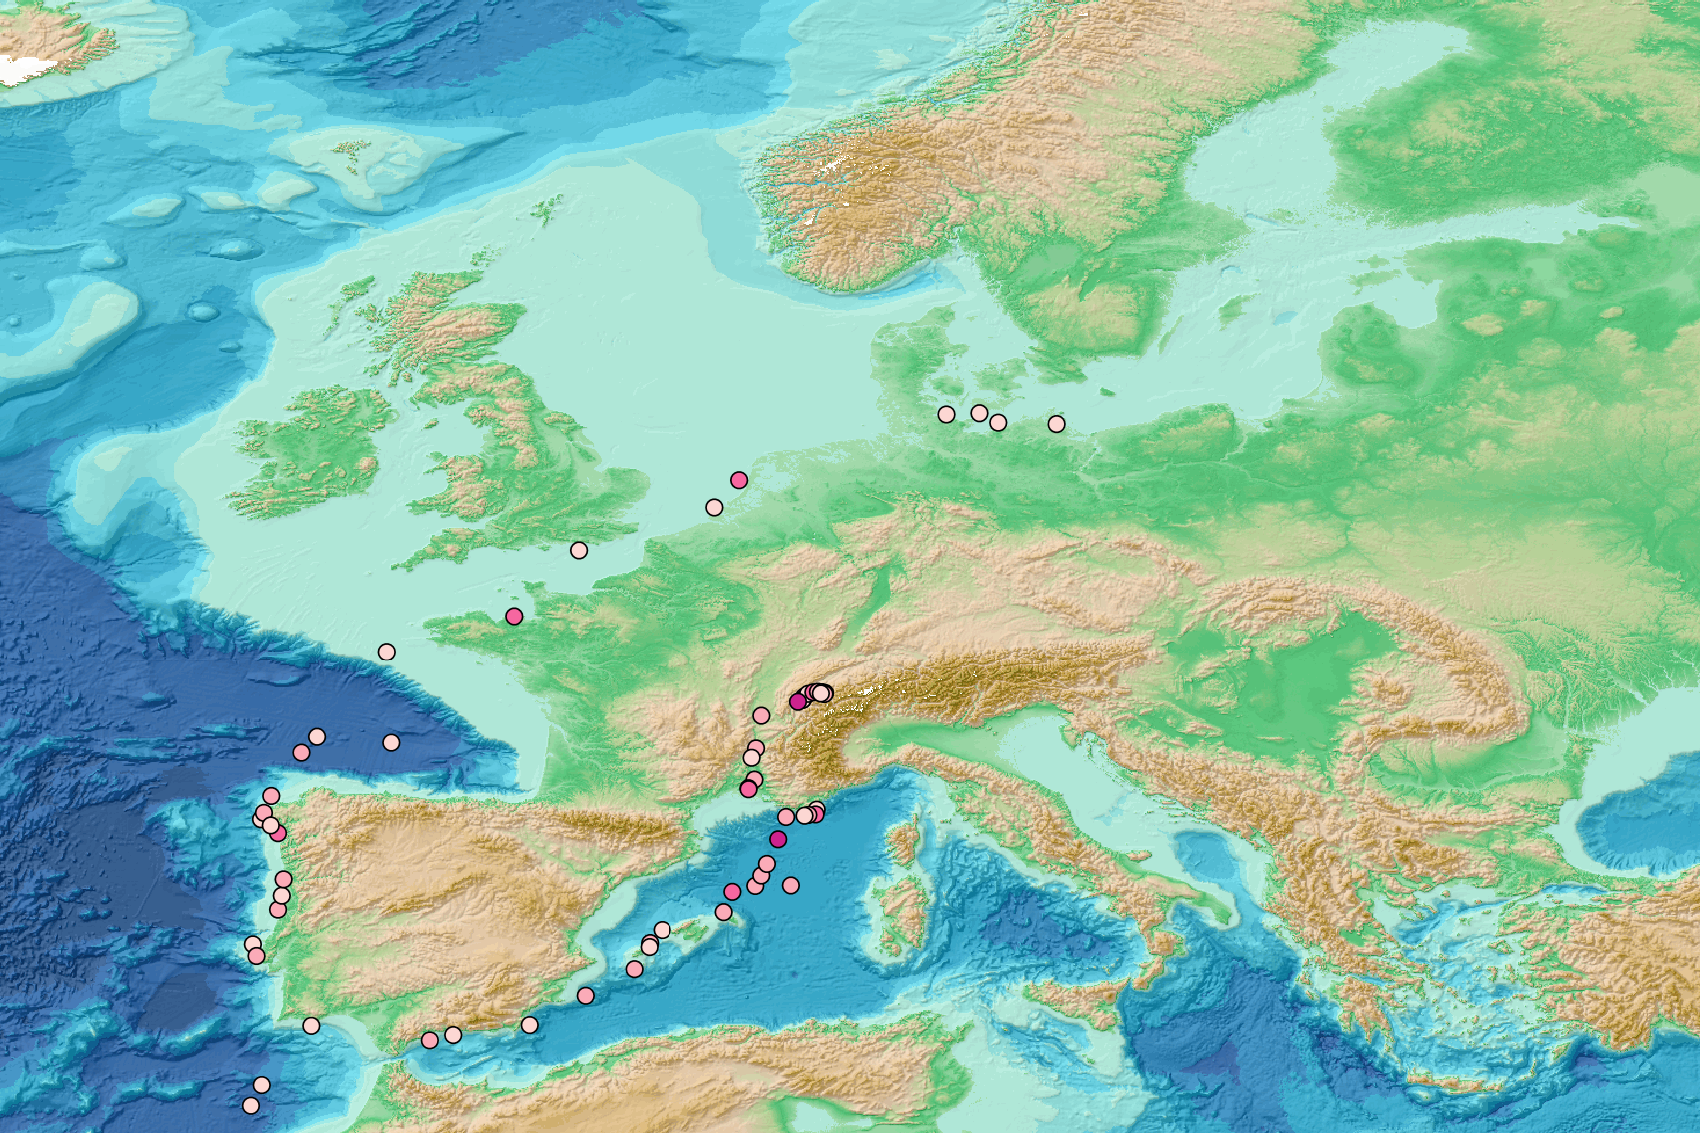
This visualization product displays the density of floating micro-litter per net normalized per km² per year from specific protocols different from research and monitoring protocols. EMODnet Chemistry included the collection of marine litter in its 3rd phase. Before 2021, there was no coordinated effort at the regional or European scale for micro-litter. Given this situation, EMODnet Chemistry proposed to adopt the data gathering and data management approach as generally applied for marine data, i.e., populating metadata and data in the CDI Data Discovery and Access service using dedicated SeaDataNet data transport formats. EMODnet Chemistry is currently the official EU collector of micro-litter data from Marine Strategy Framework Directive (MSFD) National Monitoring activities (descriptor 10). A series of specific standard vocabularies or standard terms related to micro-litter have been added to SeaDataNet NVS (NERC Vocabulary Server) Common Vocabularies to describe the micro-litter. European micro-litter data are collected by the National Oceanographic Data Centres (NODCs). Micro-litter map products are generated from NODCs data after a test of the aggregated collection including data and data format checks and data harmonization. A filter is applied to represent only micro-litter sampled according to a very specific protocol such as the Volvo Ocean Race (VOR) or Oceaneye. Densities were calculated for each net using the following calculation: Density (number of particles per km²) = Micro-litter count / (Sampling effort (km) * Net opening (cm) * 0.00001) When the number of microlitters or the net opening was not filled, the density could not be calculated. Percentiles 50, 75, 95 & 99 have been calculated taking into account data for all years. Warning: the absence of data on the map doesn't necessarily mean that they don't exist, but that no information has been entered in the National Oceanographic Data Centre (NODC) for this area.