 EMODnet Product Catalogue
Biota lipid concentrations
Type of resources
Available actions
Topics
Keywords
Contact for the resource
Provided by
Years
Formats
Representation types
-
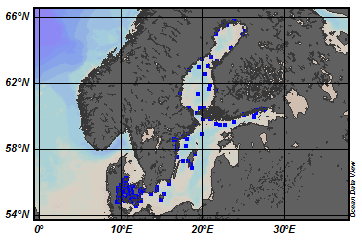
EMODnet Chemistry aims to provide access to marine chemistry data sets and derived data products concerning eutrophication, ocean acidification and contaminants. The chemicals chosen reflect importance to the Marine Strategy Framework Directive (MSFD). This regional aggregated dataset contains all unrestricted EMODnet Chemistry data on contaminants (49 parameters), and covers the Baltic Sea with 3818 CDI records divided per matrices: 1358 biota (396 Vertical profiles and 962 Time series),906 water profiles, 2510 sediment profiles. Vertical profiles temporal range is from 1985-04-16 to 2016-09-27. Time series temporal range is from 1972-05-02 to 2017-10-30. Data were aggregated and quality controlled by ‘Swedish Meteorological and Hydrological Institute (SMHI)’ from Sweden. Regional datasets concerning contaminants are automatically harvested. Parameter names in these datasets are based on P01, BODC Parameter Usage Vocabulary, which is available at: http://seadatanet.maris2.nl/bandit/browse_step.php . Each measurement value has a quality flag indicator. The resulting data collections for each Sea Basin are harmonised, and the collections are quality controlled by EMODnet Chemistry Regional Leaders using ODV Software and following a common methodology for all Sea Regions. Harmonisation means that: (1) unit conversion is carried out to express contaminant concentrations with a limited set of measurement units (according to EU directives 2013/39/UE; Comm. Dec. EU 2017/848) and (2) merging of variables described by different “local names” ,but corresponding exactly to the same concepts in BODC P01 vocabulary. The harmonised dataset can be downloaded as ODV spreadsheet (TXT file), which is composed of metadata header followed by tab separated values. This worksheet can be imported to ODV Software for visualisation (More information can be found at: https://www.seadatanet.org/Software/ODV ). The same dataset is offered also as XLSX file in a long/vertical format, in which each P01 measurement is a record line. Additionally, there are a series of columns that split P01 terms in subcomponents (measure, substance, CAS number, matrix...).This transposed format is more adapted to worksheet applications users (e.g. LibreOffice Calc). The 49 parameter names in this metadata record are based on P02, SeaDataNet Parameter Discovery Vocabulary, which is available at: http://seadatanet.maris2.nl/v_bodc_vocab_v2/vocab_relations.asp?lib=P02 . Detailed documentation will be published soon. The original datasets can be searched and downloaded from EMODnet Chemistry Download Service: https://emodnet-chemistry.maris.nl/search
-
EMODnet Chemistry aims to provide access to marine chemistry data sets and derived data products concerning eutrophication, ocean acidification and contaminants. The chemicals chosen reflect importance to the Marine Strategy Framework Directive (MSFD). This regional aggregated dataset contains all unrestricted EMODnet Chemistry data on contaminants (20 parameters), and covers the North East Atlantic Ocean with 2400 CDI records divided per matrices: 122 in biota (as time series), 1689 in water (as vertical profiles), 589 in sediment (478 Vertical profiles and 111 Time series). Vertical profiles temporal range is from 1970-07-29 to 2017-02-28. Time series temporal range is from 1979-02-28 to 2014-10-21. Data were aggregated and quality controlled by ‘IFREMER / IDM / SISMER - Scientific Information Systems for the SEA’ from France. Regional datasets concerning contaminants are automatically harvested. Parameter names in these datasets are based on P01, BODC Parameter Usage Vocabulary, which is available at: http://seadatanet.maris2.nl/bandit/browse_step.php . Each measurement value has a quality flag indicator. The resulting data collections for each Sea Basin are harmonised, and the collections are quality controlled by EMODnet Chemistry Regional Leaders using ODV Software and following a common methodology for all Sea Regions. Harmonisation means that: (1) unit conversion is carried out to express contaminant concentrations with a limited set of measurement units (according to EU directives 2013/39/UE; Comm. Dec. EU 2017/848) and (2) merging of variables described by different “local names” ,but corresponding exactly to the same concepts in BODC P01 vocabulary. The harmonised dataset can be downloaded as ODV spreadsheet (TXT file), which is composed of metadata header followed by tab separated values. This worksheet can be imported to ODV Software for visualisation (More information can be found at: https://www.seadatanet.org/Software/ODV ). The same dataset is offered also as XLSX file in a long/vertical format, in which each P01 measurement is a record line. Additionally, there are a series of columns that split P01 terms in subcomponents (measure, substance, CAS number, matrix...).This transposed format is more adapted to worksheet applications users (e.g. LibreOffice Calc). The 20 parameter names in this metadata record are based on P02, SeaDataNet Parameter Discovery Vocabulary, which is available at: http://seadatanet.maris2.nl/v_bodc_vocab_v2/vocab_relations.asp?lib=P02 . Detailed documentation will be published soon. The original datasets can be searched and downloaded from EMODnet Chemistry Download Service: https://emodnet-chemistry.maris.nl/search
-
EMODnet Chemistry aims to provide access to marine chemistry data sets and derived data products concerning eutrophication, ocean acidification and contaminants. The chemicals chosen reflect importance to the Marine Strategy Framework Directive (MSFD). This regional aggregated dataset contains all unrestricted EMODnet Chemistry data on contaminants (59 parameters), and covers the North Sea with 34978 CDI records divided per matrices: 3909 biota time series, 28071 water profiles, 2998 sediment profiles. Vertical profiles temporal range is from 1970-02-17 to 2017-10-26. Time series temporal range is from 1979-02-26 to 2017-02-28. Data were aggregated and quality controlled by ‘Aarhus University, Department of Bioscience, Marine Ecology Roskilde from Denmark. Regional datasets concerning contaminants are automatically harvested. Parameter names in these datasets are based on P01, BODC Parameter Usage Vocabulary, which is available at: http://seadatanet.maris2.nl/bandit/browse_step.php . Each measurement value has a quality flag indicator. The resulting data collections for each Sea Basin are harmonised, and the collections are quality controlled by EMODnet Chemistry Regional Leaders using ODV Software and following a common methodology for all Sea Regions. Harmonisation means that: (1) unit conversion is carried out to express contaminant concentrations with a limited set of measurement units (according to EU directives 2013/39/UE; Comm. Dec. EU 2017/848) and (2) merging of variables described by different “local names” ,but corresponding exactly to the same concepts in BODC P01 vocabulary. The harmonised dataset can be downloaded as ODV spreadsheet (TXT file), which is composed of metadata header followed by tab separated values. This worksheet can be imported to ODV Software for visualisation (More information can be found at: https://www.seadatanet.org/Software/ODV ). The same dataset is offered also as XLSX file in a long/vertical format, in which each P01 measurement is a record line. Additionally, there are a series of columns that split P01 terms in subcomponents (measure, substance, CAS number, matrix...).This transposed format is more adapted to worksheet applications users (e.g. LibreOffice Calc). The 59 parameter names in this metadata record are based on P02, SeaDataNet Parameter Discovery Vocabulary, which is available at: http://seadatanet.maris2.nl/v_bodc_vocab_v2/vocab_relations.asp?lib=P02 . Detailed documentation will be published soon. The original datasets can be searched and downloaded from EMODnet Chemistry Download Service: https://emodnet-chemistry.maris.nl/search
-
This dataset comprises energy density and proximal composition (water, ash, lipid and protein contents) for anchovy (Engraulis encrasicolus) and sardine (Sardina pilchardus) from the Bay of Biscay, the English Channel and the southern North Sea between 2014 and 2017. Fish were sampled throughout various seasons thanks to the (CAPTAIN)-[https://doi.org/10.13155/69764] project (France Filière Pêche). During the surveys, pelagic (PELGAS and JUVENA) or demersal (EVHOE and CGFS) trawl hauls are undertaken to identify species and measure individual fish traits. Professional sampling was performed from pelagic trawl or purse-seine catches. From the various surveys, a sub-sampling of the trawls was performed to cover as much as possible the spatial extent of the surveys along the french coast. From the various selected trawls, a sub-sampling of 5 fish per size class (when possible) was performed to cover the size range of each species, based on the following size classes : sardine (1 : <15 cm ; 2 : 15-20 cm ; 3 : >20cm), anchovy (1 : <10cm ; 2 : 10-14 cm ; 3 : >14cm). Each fish was individually measured to the nearest tenth of a centimeter and weighted to the nearest tenth of a gram. These measurements were taken either at sea or later in the laboratory. The collected fish were frozen individually at -20°C before laboratory processing. In the laboratory, maturity stages were determined following ICES guidelines ((ICES, 2008)-[https://doi.org/10.17895/ices.pub.19280426]) based on macroscopic gonads observation and using a six-stage key as follows: stages 1 & 2 indicate immature and developing individuals, stages 3–5 indicate three steps of increasing gonad development and the spawning period (stage 3: partial pre-spawning; stage 4: spawning (hydrated); stage 5: partial post-spawning), and stage 6 features the final post-spawning period. Fish characterised by maturity stages 3, 4 or 5 were considered as being in an active reproductive period as opposed to fish in stages 1, 2 or 6. Fish were then ground and freeze-dried during at least 48 hours. Water content of the entire fish was determined from dry mass and wet mass ratio. Then, fish were ground again to obtain fine homogeneous dry powder for subsequent analysis. Energy density measurements were performed following the protocols of (Gatti et al. (2018))-[https://archimer.ifremer.fr/doc/00416/52754/]. Two subsamples of fish powder were placed in an adiabatic bomb calorimeter (IKA C-4000 adiabatic bomb calorimeter, IKA-WerkeGmbh & co. KG) for energy measurements. The energy density (ED, kJ.g-1 dry mass) was determined by measuring the heat released through the combustion of a small subsample, approximately 200 mg. If the coefficient of variation between the two measurements exceeded 3%, a third measurement was made. Finally, ED subsamples measurements were averaged and assigned to each individual fish. Energy density analyses were conducted on 503 individuals for anchovy and 976 individuals for sardine. Ash content was determined gravimetrically by combusting dried tissue in a muffle furnace at 550°C for six hours. Lipids and proteins were analysed by a certified laboratory (Labocea, Plouzané, France). Protein content was estimated using the Kjeldahl method. It consists in first determining the quantity of nitrogen contained in the sample, and to convert it into protein content using a conversion factor (6.25 here). Lipid content was determined by hydrolysis, using petroleum ether as an organic solvent. Carbohydrates represent less than 1% of fish mass and were thus neglected. Protein, lipid and ash content did not exactly sum to 1 in DW (anchovy: mean = 0.91, sd = 0.04; sardine: mean = 0.90, sd = 0.04). This discrepancy may arise from residual water, measurement uncertainties, or to a lesser extent the exclusion of carbohydrates. Body component contents have been normalised by dividing each component by the sum of lipids, proteins and ash content, to sum to one, enabling comparisons between fishes, assuming proportional errors across the components. A total of 116 and 104 proximate composition analyses were performed for anchovy and sardine, respectively. Important Note: This submission has been initially submitted to SEA scieNtific Open data Edition (SEANOE) publication service and received the recorded DOI. The metadata elements have been further processed (refined) in EMODnet Ingestion Service in order to conform with the Data Submission Service specifications.
-
The Green Edge project was designed to investigate the onset, life and fate of a phytoplankton spring bloom (PSB) in the Arctic Ocean. The lengthening of the ice-free period and the warming of seawater, amongst other factors, have induced major changes in arctic ocean biology over the last decades. Because the PSB is at the base of the Arctic Ocean food chain, it is crucial to understand how changes in the arctic environment will affect it. Green Edge was a large multidisciplinary collaborative project bringing researchers and technicians from 28 different institutions in seven countries, together aiming at understanding these changes and their impacts on the future. The fieldwork for the Green Edge project took place over two years (2015 and 2016) and was carried out from both an ice camp and a research vessel in the Baffin Bay, Canadian arctic. Here, we describe the data set obtained during the research cruise, which took place aboard the Canadian Coast Guard Ship (CCGS) Amundsen in spring 2016. Important Note: This submission has been initially submitted to SEA scieNtific Open data Edition (SEANOE) publication service and received the recorded DOI. The metadata elements have been further processed (refined) in EMODnet Ingestion Service in order to conform with the Data Submission Service specifications.