 EMODnet Product Catalogue
Oceans
Type of resources
Available actions
Topics
Keywords
Contact for the resource
Provided by
Years
Formats
Representation types
Update frequencies
status
Service types
Scale 1:
Resolution
-
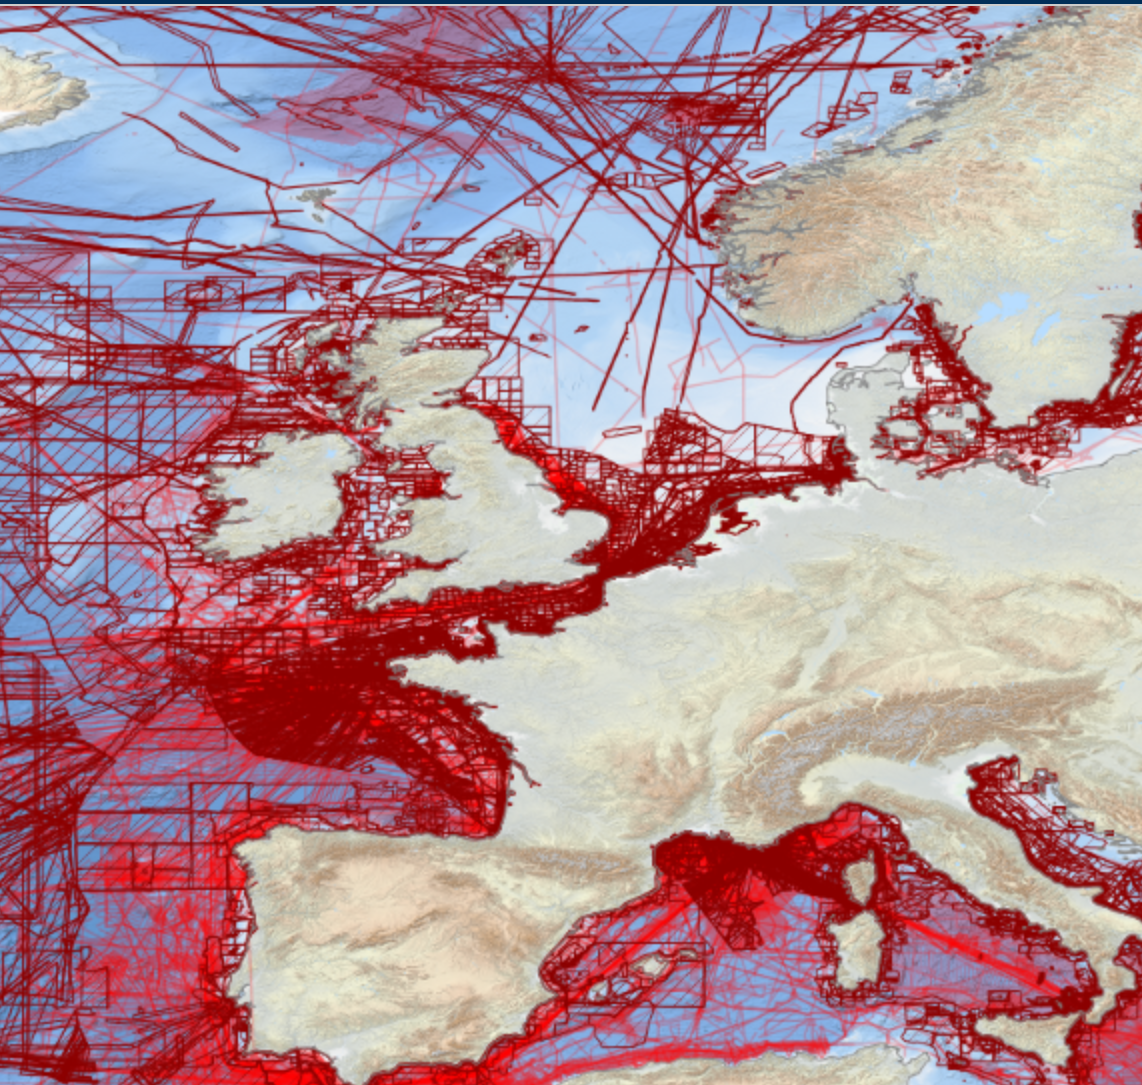
EMODnet Bathymetry has adopted the CDI Data Discovery & Access service as developed and operated by SeaDataNet, the pan-European network of NODCs, to bring together and provide access to available high resolution bathymetric survey data sets from many data providers, such as National Hydrographic Institutes, Research Institutes, and Survey companies. All bathymetric survey data are described with INSPIRE compliant metadata, following the CDI metadata profile, based on ISO 19115 – 19139 standards. This way, the CDI service gives users a highly detailed insight in the availability and geographical spreading of bathymetric survey data sets that are acquired and managed by an increasing group of data providers and for which users can request access for downloading. The CDI metadata are public domain and freely available for all users. However, a major part of the survey data sets is not freely available and requires negotiation with the data owners. The SeaDataNet CDI search, shopping and tracking mechanism facilitates identifying and requesting access to these background data sets from data providers. Note that all data sets are used internally with permission of the data owners for contributing to the EMODnet Digital Terrain Model (DTM) for the European sea regions. The service URL is : https://geo-service.maris.nl/emodnet_bathymetry/wfs?service=WFS&request=GetCapabilities. The layer in the Map Viewer facilitates users to view the locations of the CDI entries and to retrieve details of individual surveys by clicking on the map. From there users are linked to the actual CDI Data Discovery and Access service (https://cdi-bathymetry.seadatanet.org/search) for performing more queries and submitting requests for data access.
-
EMODnet Physics - TSM_NorthSea - Concentration of total suspended matter (conc_tsm, mg/l) is a product of the Coastcolour L2W Concentrations Data, obtained from the OC4 algorithm for clear and moderate turbid waters, and from the CoastColour v1 neural network.The L2W product was then remapped on a regular grid, maintaining the 300 m full resolution, in order to obtain L3 products over the North Sea and monthly averaged. Developed by EMODnet Physics.
-
Gridded abundance maps of marine mammals (sperm whale, short beaked common dolphin, common bottlenose dolphin, Atllantic spotted dolphin) around the Azores. This product was developed with DIVA (Data-Interpolating Variational Analysis). Data was provided by the Azores Fisheries Observation Programme (POPA).
-
This series of products displays the main functional types of benthic macroinvertebrates derived from a multivariate analysis of 13 life history traits. Several occurrence lists from EMODnet Biology were combined. A multivariate analysis of the life history traits revealed three main living modes. All final outcomes were interpolated by DIVAnd, the n-dimensional Data Interpolating Variational Analysis tool.
-
Gridded abundance map of Caretta caretta around the Azores between 1998 and 2002. This product was developed with DIVA (Data-Interpolating Variational Analysis). Data was provided by the Azores Fisheries Observation Programme (POPA).
-
Gridded abundance maps of marine birds from the North Sea. All the bird species of this dataset are indicator species for Descriptor 1 Biodiversity of the MSFD for the North East Atlantic. This product was developed with DIVA (Data-Interpolating Variational Analysis). Data was provided by JNCC (Joint Nature Conservation Committee): Dunn, T. 2012. JNCC seabird distribution and abundance data (all trips) from ESAS database. Data downloaded from OBIS-SEAMAP (http://seamap.env.duke.edu/dataset/427).
-
Gridded abundance maps of seal species. This product was developed with DIVA (Data-Interpolating Variational Analysis). Data was provided by JNCC (Joint Nature Conservation Committee): Dunn, T. 2012. JNCC seabird distribution and abundance data (all trips) from ESAS database. Data downloaded from OBIS-SEAMAP (http://seamap.env.duke.edu/dataset/427).
-
Gridded abundance map of marine birds around the Azores. This product was developed with DIVA (Data-Interpolating Variational Analysis). Data was provided by the Azores Fisheries Observation Programme (POPA).
-
This data product is a series of gridded abundance maps for 40 zooplankton species from 2007 to 2013 in the Baltic Sea, based on a neural network analysis. As input data a combination of EMODnet Biology datasets were used, together with the environmental variables dissolved oxygen, salinity, temperature, chlorophyll concentration bathymetry and the distance from coast. Additionally the position (latitude and longitude) and the year are provided to the neural network. DIVAnd (n-dimensional Data-Interpolating Variational Analysis) and the neural network library Knet were used in this analysis.
-
This data product is an R Shiny application that discloses the data collected by the National Institute of Oceanography and Experimental Geophysics (OGS) in the North Adriatic-Gulf of Trieste LTER. A time series has been built of observations on the species composition of the plankton. The application shows the evolution over time of abundance of major groups of species, as well as the most frequent species (or other taxonomic units) in the dataset. There is also a multivariate representation based on a PCA of abundances of the most frequent species, which shows the seasonal (monthly) fluctuations and the long-term (yearly) trend, and the contribution of each individual species to the temporal evolution of the community.