 EMODnet Product Catalogue
Southeast Atlantic Ocean (20W)
Type of resources
Available actions
Topics
Keywords
Contact for the resource
Provided by
Years
Representation types
-
As part of the second mission of the (GOCART)-[https://projects.noc.ac.uk/gocart/] (Gauging Ocean organic Carbon fluxes using Autonomous Robotic Technologies) project, funded by the European Research Council, a Slocum glider (unit-405, Doombar) spent about 4 months surveying the top 1000m of a low oxygen region of the Northern Benguela Upwelling region, off the coast of Namibia. The goal of the mission was to characterize the temporal variability in organic carbon flux and remineralisation depth during the spring bloom in a highly productive but low oxygen region in the Benguela Current, off the Namibian coast. The glider was a Teledyne Webb Research (Slocum)-[https://www.teledynemarine.com/brands/webb-research/slocum-glider] G2, equipped with: Seabird Glider Payload CTD (pumped), measuring temperature, conductivity and pressure Sea-Bird WETLabs ECO Puck Triplet BB2FL-SLC scattering fluorescence sensor, measuring chlorophyll fluorescence and optical backscattering at 700 and 532nm Aanderaa 4831 oxygen optode, measuring dissolved oxygen concentration. The glider was deployed at 11.225°E, 19.331°S on 14th February 2018 from the RV Mirabilis, the vessel of the Namibian Ministry of Fisheries, during the second leg of the 2018 Hake Survey off the northern Namibian shelf and recovered on June 19th, 2018 during the (DY090 cruise)-[https://www.bodc.ac.uk/resources/inventories/cruise_inventory/report/16386/] on board RSS Discovery, during the COMICS cruise (Controls over Oceanic Mesopelagic Interior Carbon Storage), funded by the Natural Environmental Research Council. The latter cruise was in the vicinity of the glider from 1st-19th June, 2018. To validate/calibrate the glider sensors, we conducted several targeted casts (where gliders and ships started profiles simultaneously) and non-targeted casts (unplanned matchups where gliders and ships CTD-profiles were within an acceptable range of each other). Bottle samples were collected on all ship CTD profiles. For calibration purposes, we evaluated and determined that casts within 5 km and 12 hours of each other were considered glider ship matchups. These matchups exhibited strong correlation (linear regression r^2 = 0.95).Variables calibrated were salinity, chlorophyll concentration and oxygen concentration. Doombar’s mission was slightly modified 3 times during the 4-month deployment: 1 – Sampling around a 12 km triangle at BN0 (centred at 10.80°E, 18.25°S) from 19/02/2018-27/03/2018: Once the glider reached the site (BN0), it was tasked to survey a triangle with 12 km side, centred at that location. The location of the triangle was chosen based on low currents to help constrain advective processes and the predominantly westward surface currents in the region . The 12km sided triangle was chosen based on the time it took the glider to do a complete circuit, aiming for the glider to take around 1.5 days around the triangle. 2 – Sampling around a 12 km triangle at BN (centred at 10.95°E, 18.05°S) from 27/03/2018-08/06/2018: Given that the mission was to survey a low oxygen region, and oxygen concentrations monitored by the glider weren’t consistently low, on March 26th the glider was re-tasked to establish a new triangle (BN) centred at 10.95°E, 18.05°S, Northeast of the initial sampling site, where lower oxygen concentrations were expected. 3 – Station-keeping (“virtual-mooring”) 1.5km North of BN from 08/06/2018-19/06/2018: Throughout its deployment, Doombar gradually reduced its forward speed from about 4km per 1000m dive to about 1.5km. This meant that the glider could no longer cover the triangle in less than 2 days. So, while the ship was in the vicinity, Doombar was assigned a station keeping mission 1.5 km from the cruise main station, to not only avoid the risk of hitting the glider, but also so that any ship data could contribute to validating glider sensor data. Further information on sensor validation can be found in the netcdf file as well as documented in (Lovecchio et al, 2022)-[https://doi.org/10.1029/2022JC019063]. Important Note: This submission has been initially submitted to SEA scieNtific Open data Edition (SEANOE) publication service and received the recorded DOI. The metadata elements have been further processed (refined) in EMODnet Ingestion Service in order to conform with the Data Submission Service specifications.
-

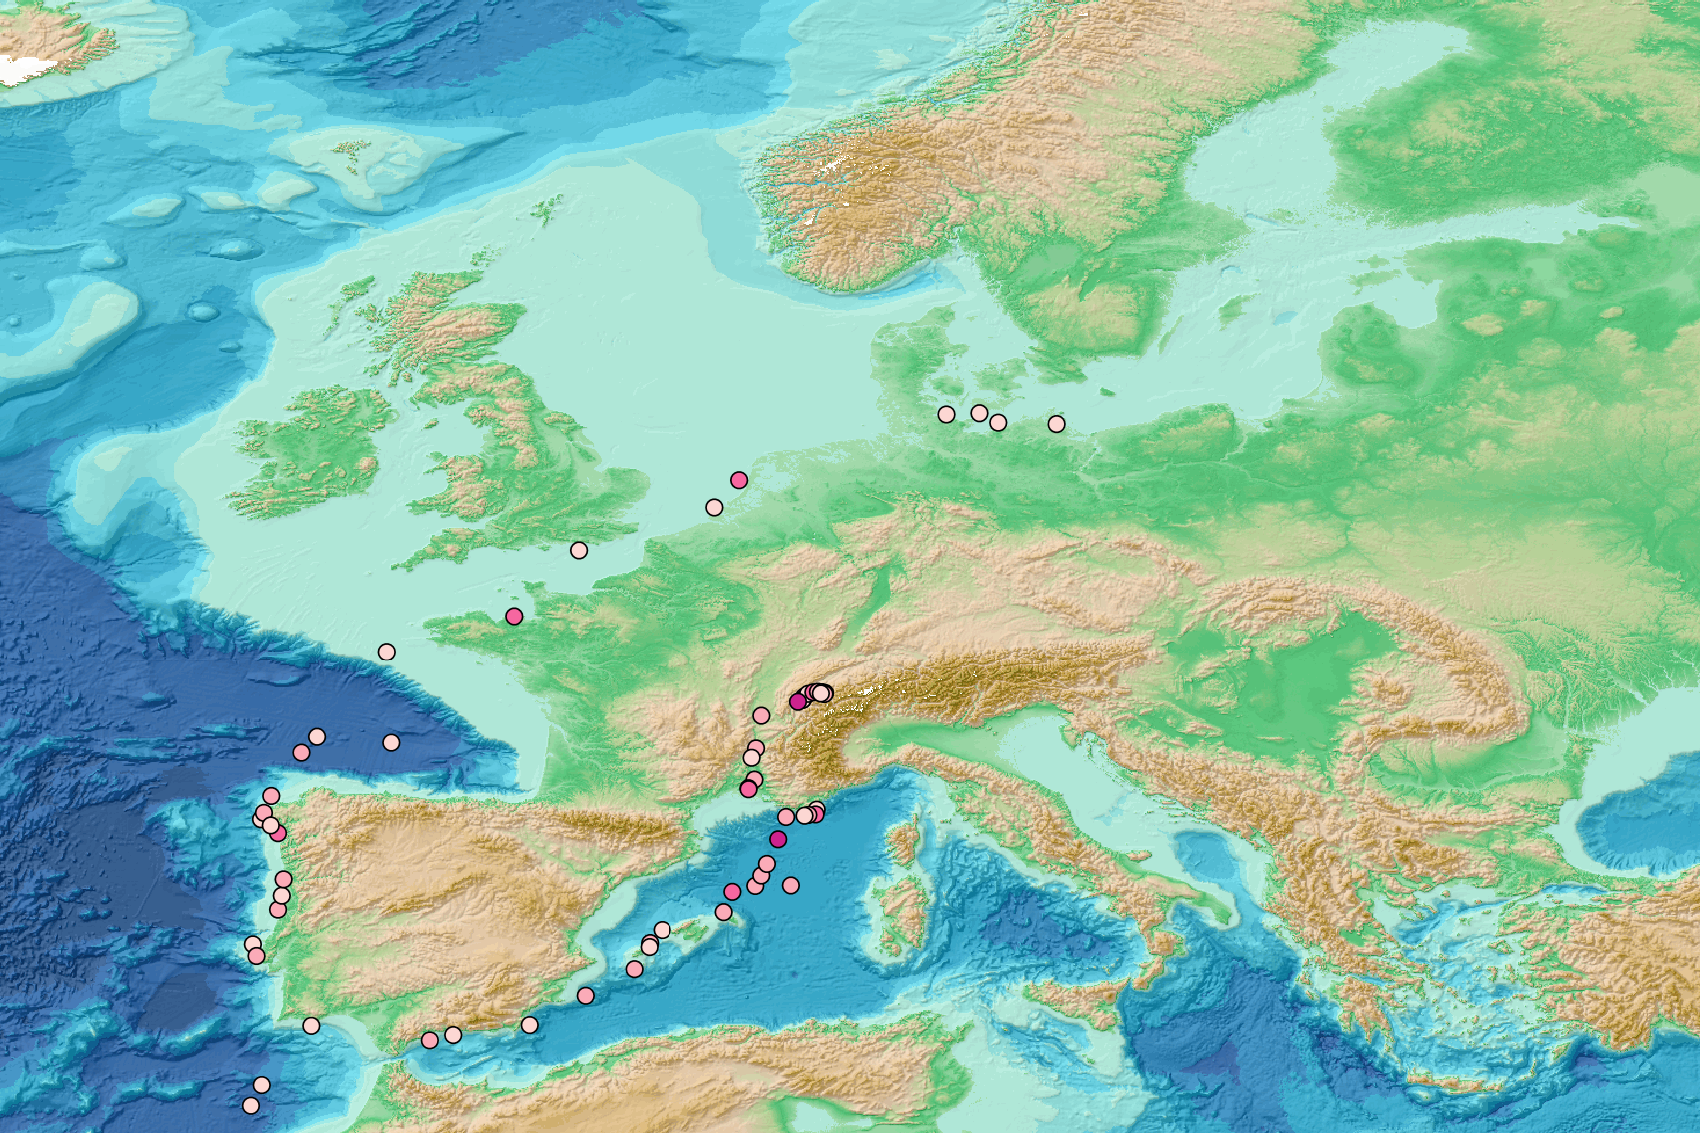
This visualization product displays the density of floating micro-litter per net normalized per km² per year from specific protocols different from research and monitoring protocols. EMODnet Chemistry included the collection of marine litter in its 3rd phase. Before 2021, there was no coordinated effort at the regional or European scale for micro-litter. Given this situation, EMODnet Chemistry proposed to adopt the data gathering and data management approach as generally applied for marine data, i.e., populating metadata and data in the CDI Data Discovery and Access service using dedicated SeaDataNet data transport formats. EMODnet Chemistry is currently the official EU collector of micro-litter data from Marine Strategy Framework Directive (MSFD) National Monitoring activities (descriptor 10). A series of specific standard vocabularies or standard terms related to micro-litter have been added to SeaDataNet NVS (NERC Vocabulary Server) Common Vocabularies to describe the micro-litter. European micro-litter data are collected by the National Oceanographic Data Centres (NODCs). Micro-litter map products are generated from NODCs data after a test of the aggregated collection including data and data format checks and data harmonization. A filter is applied to represent only micro-litter sampled according to a very specific protocol such as the Volvo Ocean Race (VOR) or Oceaneye. Densities were calculated for each net using the following calculation: Density (number of particles per km²) = Micro-litter count / (Sampling effort (km) * Net opening (cm) * 0.00001) When the number of microlitters or the net opening was not filled, it was not possible to calculate the density. Percentiles 50, 75, 95 & 99 have been calculated taking into account data for all years. Warning: the absence of data on the map does no't necessarily mean that they do not exist, but that no information has been entered in the National Oceanographic Data Centre (NODC) for this area.
-
Distribution of five mitochondrial haplotypes among 176 individuals , and multilocus genotypes at the eight microsatellite loci analysed for a total of 177 individuals, obtained for the vesicomyid bivalve Christineconcha regab from chemiosynthetic sites of the West African Equatorial margin. Important Note: This submission has been initially submitted to SEA scieNtific Open data Edition (SEANOE) publication service and received the recorded DOI. The metadata elements have been further processed (refined) in EMODnet Ingestion Service in order to conform with the Data Submission Service specifications.
-
This visualization product displays the density of floating micro-litter per net normalized per km² per year from specific protocols different from research and monitoring protocols. EMODnet Chemistry included the collection of marine litter in its 3rd phase. Before 2021, there was no coordinated effort at the regional or European scale for micro-litter. Given this situation, EMODnet Chemistry proposed to adopt the data gathering and data management approach as generally applied for marine data, i.e., populating metadata and data in the CDI Data Discovery and Access service using dedicated SeaDataNet data transport formats. EMODnet Chemistry is currently the official EU collector of micro-litter data from Marine Strategy Framework Directive (MSFD) National Monitoring activities (descriptor 10). A series of specific standard vocabularies or standard terms related to micro-litter have been added to SeaDataNet NVS (NERC Vocabulary Server) Common Vocabularies to describe the micro-litter. European micro-litter data are collected by the National Oceanographic Data Centres (NODCs). Micro-litter map products are generated from NODCs data after a test of the aggregated collection including data and data format checks and data harmonization. A filter is applied to represent only micro-litter sampled according to a very specific protocol such as the Volvo Ocean Race (VOR) or Oceaneye. Densities were calculated for each net using the following calculation: Density (number of particles per km²) = Micro-litter count / (Sampling effort (km) * Net opening (cm) * 0.00001) When the number of microlitters or the net opening was not filled, the density could not be calculated. Percentiles 50, 75, 95 & 99 have been calculated taking into account data for all years. Warning: the absence of data on the map doesn't necessarily mean that they don't exist, but that no information has been entered in the National Oceanographic Data Centre (NODC) for this area.