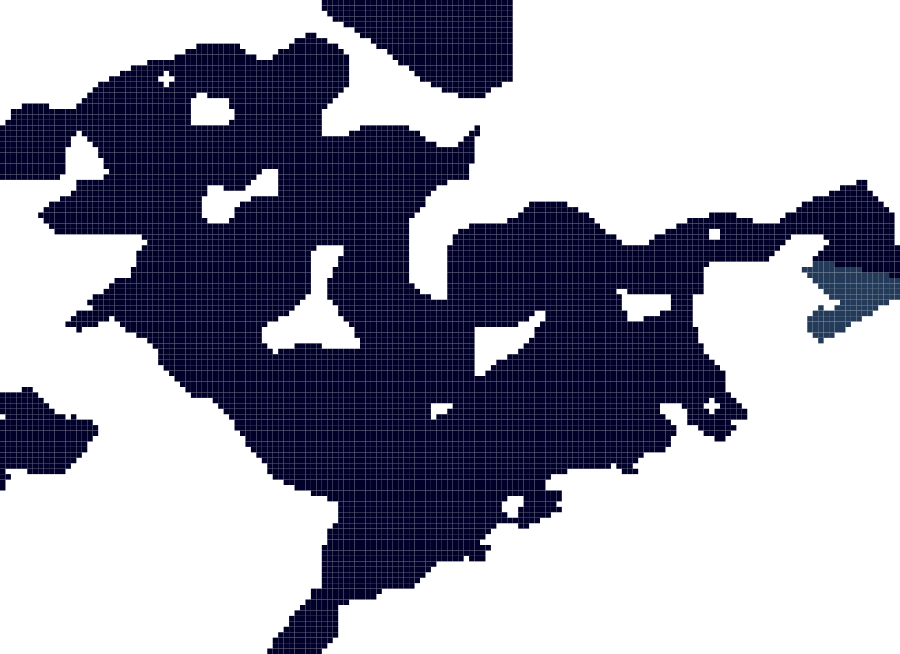
abundance
Type of resources
Available actions
Topics
Keywords
Contact for the resource
Provided by
Years
status
-

This dataproduct consists of a set of gridded map layers showing the average abundance of different species of species groups for different time windows (seasonal, annual or multi-annual as appropriate) using spatial modelling. They cover a wide taxonomic range, from the smallest organisms (e.g. diatoms, flagellates) to the largest ones (e.g. fish, birds, reptiles, mammals), encompassing all trophic levels.
-

This dataproduct consists of a set of gridded map layers showing the average abundance of different species of species groups for different time windows (seasonal, annual or multi-annual as appropriate) using spatial modelling. They cover a wide taxonomic range, from the smallest organisms (e.g. diatoms, flagellates) to the largest ones (e.g. fish, birds, reptiles, mammals), encompassing all trophic levels.
-

This dataproduct consists of a set of gridded map layers showing the average abundance of different species of species groups for different time windows (seasonal, annual or multi-annual as appropriate) using spatial modelling. They cover a wide taxonomic range, from the smallest organisms (e.g. diatoms, flagellates) to the largest ones (e.g. fish, birds, reptiles, mammals), encompassing all trophic levels.
-

The data product on benthic living modes (Beauchard, 2018), was based on an extensive compilation of data on benthic abundance and biomass. However, this dataset was only present as a data file, without the underlying scripts to reproduce the result. With the present data product, we correct this procedural gap. This dataset differs in details from the file underlying the data product on living modes. Datasets were selected that were sufficiently similar in methods for sampling (either boxcore or grab), sampled surface (in the order of 0.1 square meter, although the exact value is variable - it can be found back in the data files) and sieves (1 mm and 0.5 mm sieves were included). For all datasets, abundance was either used directly from the given abundance in the dataset, or calculated from the given counts and area sampled.
 EMODnet Product Catalogue