 EMODnet Product Catalogue
0.009 degree
Type of resources
Available actions
Topics
Keywords
Contact for the resource
Provided by
Years
Formats
Resolution
-
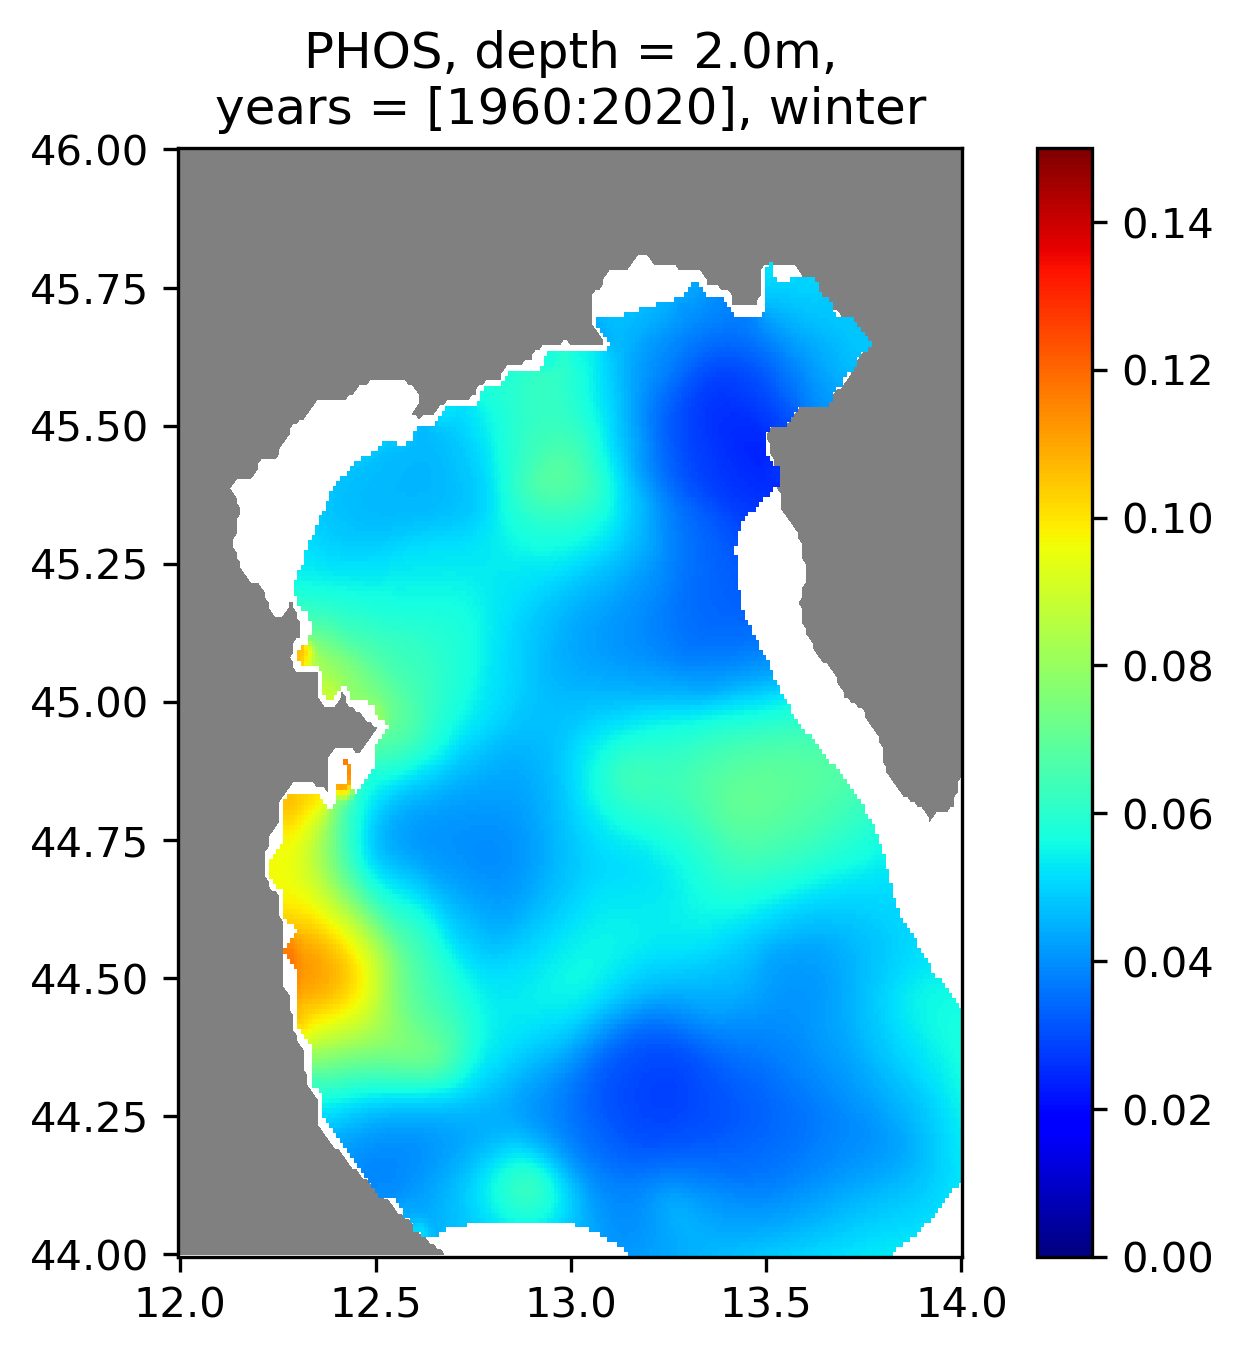
Water body phosphate - Seasonal Climatology for Po River for the period 1960-2020 on the domain: Lon E12.0-14.0deg., Lat N44.0-46.0deg. Data Sources: observational data from SeaDataNet/EMODNet Chemistry Data Network. Description of DIVA analysis: The computation was done with the DIVAnd (Data-Interpolating Variational Analysis in n dimensions), version 2.7.9, using GEBCO 30sec topography for the spatial connectivity of water masses. The horizontal resolution of the produced DIVAnd maps grids is dx=dy=0.009 degrees (around 975m and 708m accordingly). The vertical resolution is 14 depth levels: [0., 2., 4., 6., 8., 10., 15., 20., 25., 30., 40., 50., 60., 70.]. A relative correlation length used based on topography gradients and the horizontal correlation length varies from 25 km to 12.5 km. The vertical correlation length (in meters) is: [4.,4.,4.,4.,4.,10.,10.,10.,10.,20.,20.,20.,20.,20.]. Duplicates check was performed using the following criteria for space and time: dlon=0.01deg., dlat=0.01deg., ddepth=0.01m, dtime=1min, dvalue=0.01. The error variance (epsilon2) was set equal to 1. Data weight was reduced at shallow waters. Data weighting was applied with the following threshold values: lon=0.03, lat=0.03, depth=2. An anamorphosis transformation was applied to the data (function DIVAnd.Anam.loglin) to avoid unrealistic negative values: threshold value=200. The mean value was used as background analysis field. Quality control of the observations was applied using the interpolated field (QCMETHOD=3). Residuals (differences between the observations and the analysis (interpolated linearly to the location of the observations) were calculated. Observations with residuals outside the minimum and maximum values of the 99% quantile were discarded from the analysis. Seasons definition: Winter=Jan-Mar, Spring=Apr-Jun, Summer=Jul-Sep, Autumn=Oct-Dec. Originators of Italian data sets-List of contributors: - Brunetti Fabio (OGS) - Cardin Vanessa, Bensi Manuel doi:10.6092/36728450-4296-4e6a-967d-d5b6da55f306 - Cardin Vanessa, Bensi Manuel, Ursella Laura, Siena Giuseppe doi:10.6092/f8e6d18e-f877-4aa5-a983-a03b06ccb987 - Cataletto Bruno (OGS) - Cinzia Comici Cinzia (OGS) - Civitarese Giuseppe (OGS) - DeVittor Cinzia (OGS) - Giani Michele (OGS) - Kovacevic Vedrana (OGS) - Mosetti Renzo (OGS) - Solidoro C.,Beran A.,Cataletto B.,Celussi M.,Cibic T.,Comici C.,Del Negro P.,De Vittor C.,Minocci M.,Monti M.,Fabbro C.,Falconi C.,Franzo A.,Libralato S.,Lipizer M.,Negussanti J.S.,Russel H.,Valli G., doi:10.6092/e5518899-b914-43b0-8139-023718aa63f5 - Celio Massimo (ARPA FVG) - Malaguti Antonella (ENEA) - Fonda Umani Serena (UNITS) - Bignami Francesco (ISAC/CNR) - Boldrini Alfredo (ISMAR/CNR) - Marini Mauro (ISMAR/CNR) - Miserocchi Stefano (ISMAR/CNR) - Zaccone Renata (IAMC/CNR) - Lavezza, R., Dubroca, L. F. C., Ludicone, D., Kress, N., Herut, B., Civitarese, G., Cruzado, A., Lefèvre, D.,Souvermezoglou, E., Yilmaz, A., Tugrul, S., and Ribera d'Alcala, M.: Compilation of quality controlled nutrient profiles from the Mediterranean Sea, doi:10.1594/PANGAEA.771907, 2011.
-
_2.0m_1980_2020_winter.png)
Dissolved inorganic nitrogen (DIN) - Seasonal Climatology for Po River for the period 1980-2020 on the domain: Lon E12.0-14.0deg., Lat N44.0-46.0deg. Data Sources: observational data from SeaDataNet/EMODNet Chemistry Data Network. Description of DIVA analysis: The computation was done with the DIVAnd (Data-Interpolating Variational Analysis in n dimensions), version 2.7.9, using GEBCO 30sec topography for the spatial connectivity of water masses. The horizontal resolution of the produced DIVAnd maps grids is dx=dy=0.009 degrees (around 975m and 708m accordingly). The vertical resolution is 14 depth levels: [0., 2., 4., 6., 8., 10., 15., 20., 25., 30., 40., 50., 60., 70.]. A relative correlation length used based on topography gradients and the horizontal correlation length varies from 25 km to 12.5 km. The vertical correlation length (in meters) is: [4.,4.,4.,4.,4.,10.,10.,10.,10.,20.,20.,20.,20.,20.]. Duplicates check was performed using the following criteria for space and time: dlon=0.01deg., dlat=0.01deg., ddepth=0.01m, dtime=1min, dvalue=0.01. The error variance (epsilon2) was set equal to 1. Data weight was reduced at shallow waters. Data weighting was applied with the following threshold values: lon=0.03, lat=0.03, depth=2. An anamorphosis transformation was applied to the data (function DIVAnd.Anam.loglin) to avoid unrealistic negative values: threshold value=200. The mean value was used as background analysis field. Quality control of the observations was applied using the interpolated field (QCMETHOD=3). Residuals (differences between the observations and the analysis (interpolated linearly to the location of the observations) were calculated. Observations with residuals outside the minimum and maximum values of the 99% quantile were discarded from the analysis. Seasons definition: Winter=Jan-Mar, Spring=Apr-Jun, Summer=Jul-Sep, Autumn=Oct-Dec. Originators of Italian data sets-List of contributors: - Brunetti Fabio (OGS) - Cardin Vanessa, Bensi Manuel doi:10.6092/36728450-4296-4e6a-967d-d5b6da55f306 - Cardin Vanessa, Bensi Manuel, Ursella Laura, Siena Giuseppe doi:10.6092/f8e6d18e-f877-4aa5-a983-a03b06ccb987 - Cataletto Bruno (OGS) - Cinzia Comici Cinzia (OGS) - Civitarese Giuseppe (OGS) - DeVittor Cinzia (OGS) - Giani Michele (OGS) - Kovacevic Vedrana (OGS) - Mosetti Renzo (OGS) - Solidoro C.,Beran A.,Cataletto B.,Celussi M.,Cibic T.,Comici C.,Del Negro P.,De Vittor C.,Minocci M.,Monti M.,Fabbro C.,Falconi C.,Franzo A.,Libralato S.,Lipizer M.,Negussanti J.S.,Russel H.,Valli G., doi:10.6092/e5518899-b914-43b0-8139-023718aa63f5 - Celio Massimo (ARPA FVG) - Malaguti Antonella (ENEA) - Fonda Umani Serena (UNITS) - Bignami Francesco (ISAC/CNR) - Boldrini Alfredo (ISMAR/CNR) - Marini Mauro (ISMAR/CNR) - Miserocchi Stefano (ISMAR/CNR) - Zaccone Renata (IAMC/CNR) - Lavezza, R., Dubroca, L. F. C., Ludicone, D., Kress, N., Herut, B., Civitarese, G., Cruzado, A., Lefèvre, D.,Souvermezoglou, E., Yilmaz, A., Tugrul, S., and Ribera d'Alcala, M.: Compilation of quality controlled nutrient profiles from the Mediterranean Sea, doi:10.1594/PANGAEA.771907, 2011.
-
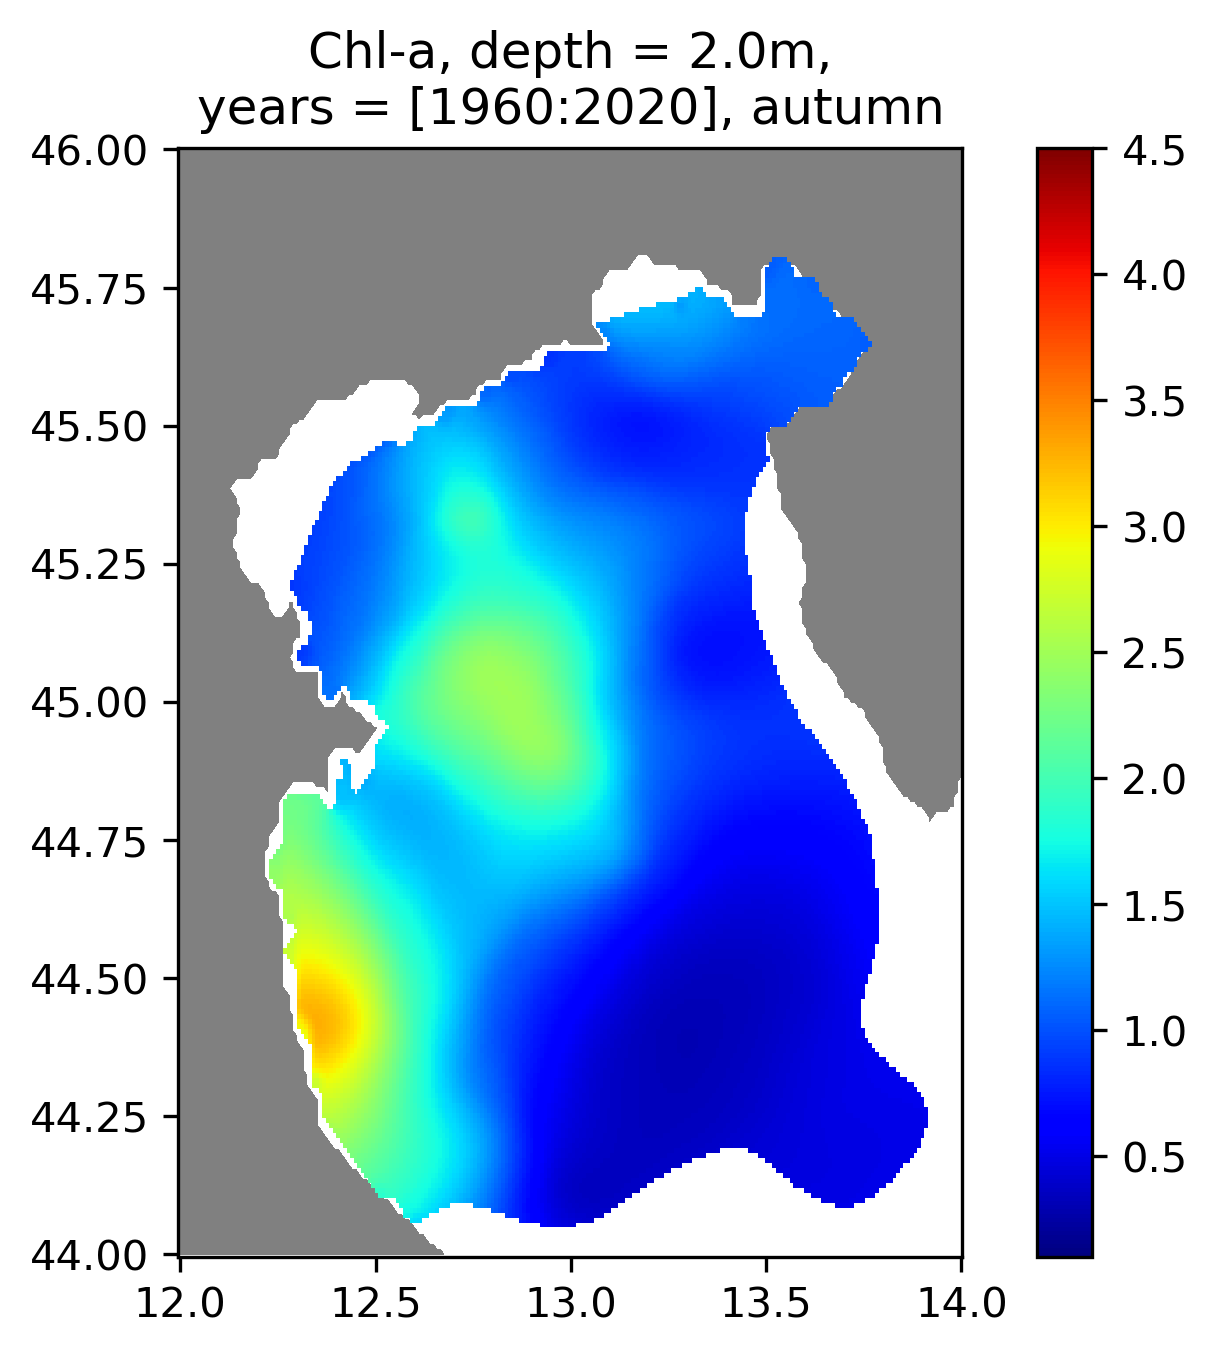
Water body chlorophyll-a - Seasonal Climatology for Po River for the period 1960-2020 on the domain: Lon E12.0-14.0deg., Lat N44.0-46.0deg. Data Sources: observational data from SeaDataNet/EMODNet Chemistry Data Network. Description of DIVA analysis: The computation was done with the DIVAnd (Data-Interpolating Variational Analysis in n dimensions), version 2.7.9, using GEBCO 30sec topography for the spatial connectivity of water masses. The horizontal resolution of the produced DIVAnd maps grids is dx=dy=0.009 degrees (around 975m and 708m accordingly). The vertical resolution is 14 depth levels: [0., 2., 4., 6., 8., 10., 15., 20., 25., 30., 40., 50., 60., 70.]. A relative correlation length used based on topography gradients and the horizontal correlation length varies from 25 km to 12.5 km. The vertical correlation length (in meters) is: [4.,4.,4.,4.,4.,10.,10.,10.,10.,20.,20.,20.,20.,20.]. Duplicates check was performed using the following criteria for space and time: dlon=0.01deg., dlat=0.01deg., ddepth=0.01m, dtime=1min, dvalue=0.01. The error variance (epsilon2) was set equal to 1. Data weight was reduced at shallow waters. Data weighting was applied with the following threshold values: lon=0.03, lat=0.03, depth=2. An anamorphosis transformation was applied to the data (function DIVAnd.Anam.loglin) to avoid unrealistic negative values: threshold value=200. The mean value was used as background analysis field. Quality control of the observations was applied using the interpolated field (QCMETHOD=3). Residuals (differences between the observations and the analysis (interpolated linearly to the location of the observations) were calculated. Observations with residuals outside the minimum and maximum values of the 99% quantile were discarded from the analysis. Seasons definition: Winter=Jan-Mar, Spring=Apr-Jun, Summer=Jul-Sep, Autumn=Oct-Dec. Originators of Italian data sets-List of contributors: - Brunetti Fabio (OGS) - Cardin Vanessa, Bensi Manuel doi:10.6092/36728450-4296-4e6a-967d-d5b6da55f306 - Cardin Vanessa, Bensi Manuel, Ursella Laura, Siena Giuseppe doi:10.6092/f8e6d18e-f877-4aa5-a983-a03b06ccb987 - Cataletto Bruno (OGS) - Cinzia Comici Cinzia (OGS) - Civitarese Giuseppe (OGS) - DeVittor Cinzia (OGS) - Giani Michele (OGS) - Kovacevic Vedrana (OGS) - Mosetti Renzo (OGS) - Solidoro C.,Beran A.,Cataletto B.,Celussi M.,Cibic T.,Comici C.,Del Negro P.,De Vittor C.,Minocci M.,Monti M.,Fabbro C.,Falconi C.,Franzo A.,Libralato S.,Lipizer M.,Negussanti J.S.,Russel H.,Valli G., doi:10.6092/e5518899-b914-43b0-8139-023718aa63f5 - Celio Massimo (ARPA FVG) - Malaguti Antonella (ENEA) - Fonda Umani Serena (UNITS) - Bignami Francesco (ISAC/CNR) - Boldrini Alfredo (ISMAR/CNR) - Marini Mauro (ISMAR/CNR) - Miserocchi Stefano (ISMAR/CNR) - Zaccone Renata (IAMC/CNR) - Lavezza, R., Dubroca, L. F. C., Ludicone, D., Kress, N., Herut, B., Civitarese, G., Cruzado, A., Lefèvre, D.,Souvermezoglou, E., Yilmaz, A., Tugrul, S., and Ribera d'Alcala, M.: Compilation of quality controlled nutrient profiles from the Mediterranean Sea, doi:10.1594/PANGAEA.771907, 2011.
-
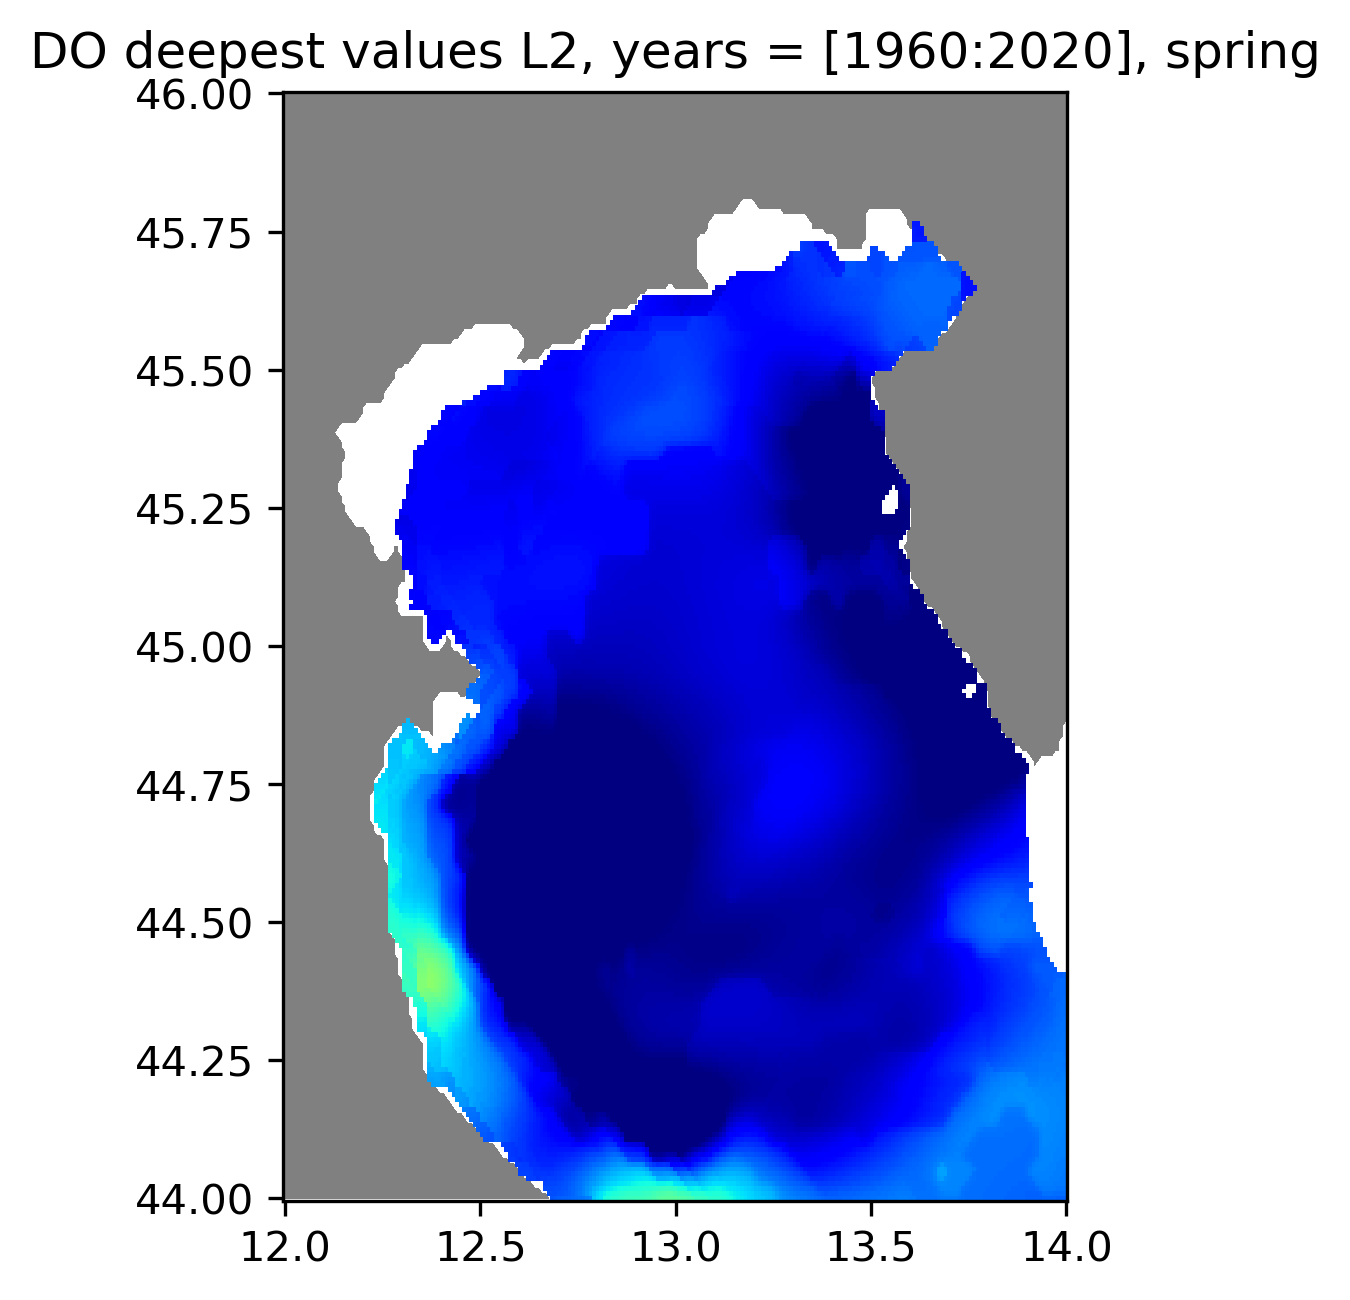
Water body dissolved oxygen concentration - Seasonal Climatology for Po River for the period 1960-2020 on the domain: Lon E12.0-14.0deg., Lat N44.0-46.0deg. Data Sources: observational data from SeaDataNet/EMODNet Chemistry Data Network. Description of DIVA analysis: The computation was done with the DIVAnd (Data-Interpolating Variational Analysis in n dimensions), version 2.7.9, using GEBCO 30sec topography for the spatial connectivity of water masses. The horizontal resolution of the produced DIVAnd maps grids is dx=dy=0.009 degrees (around 975m and 708m accordingly). The vertical resolution is 14 depth levels: [0., 2., 4., 6., 8., 10., 15., 20., 25., 30., 40., 50., 60., 70.]. A relative correlation length used based on topography gradients and the horizontal correlation length varies from 25 km to 12.5 km. The vertical correlation length (in meters) is: [4.,4.,4.,4.,4.,10.,10.,10.,10.,20.,20.,20.,20.,20.]. Duplicates check was performed using the following criteria for space and time: dlon=0.01deg., dlat=0.01deg., ddepth=0.01m, dtime=1min, dvalue=0.01. The error variance (epsilon2) was set equal to 1. Data weight was reduced at shallow waters. Data weighting was applied with the following threshold values: lon=0.03, lat=0.03, depth=2. An anamorphosis transformation was applied to the data (function DIVAnd.Anam.loglin) to avoid unrealistic negative values: threshold value=200. The mean value was used as background analysis field. Quality control of the observations was applied using the interpolated field (QCMETHOD=3). Residuals (differences between the observations and the analysis (interpolated linearly to the location of the observations) were calculated. Observations with residuals outside the minimum and maximum values of the 99% quantile were discarded from the analysis. Seasons definition: Winter=Jan-Mar, Spring=Apr-Jun, Summer=Jul-Sep, Autumn=Oct-Dec. Originators of Italian data sets-List of contributors: - Brunetti Fabio (OGS) - Cardin Vanessa, Bensi Manuel doi:10.6092/36728450-4296-4e6a-967d-d5b6da55f306 - Cardin Vanessa, Bensi Manuel, Ursella Laura, Siena Giuseppe doi:10.6092/f8e6d18e-f877-4aa5-a983-a03b06ccb987 - Cataletto Bruno (OGS) - Cinzia Comici Cinzia (OGS) - Civitarese Giuseppe (OGS) - DeVittor Cinzia (OGS) - Giani Michele (OGS) - Kovacevic Vedrana (OGS) - Mosetti Renzo (OGS) - Solidoro C.,Beran A.,Cataletto B.,Celussi M.,Cibic T.,Comici C.,Del Negro P.,De Vittor C.,Minocci M.,Monti M.,Fabbro C.,Falconi C.,Franzo A.,Libralato S.,Lipizer M.,Negussanti J.S.,Russel H.,Valli G., doi:10.6092/e5518899-b914-43b0-8139-023718aa63f5 - Celio Massimo (ARPA FVG) - Malaguti Antonella (ENEA) - Fonda Umani Serena (UNITS) - Bignami Francesco (ISAC/CNR) - Boldrini Alfredo (ISMAR/CNR) - Marini Mauro (ISMAR/CNR) - Miserocchi Stefano (ISMAR/CNR) - Zaccone Renata (IAMC/CNR) - Lavezza, R., Dubroca, L. F. C., Ludicone, D., Kress, N., Herut, B., Civitarese, G., Cruzado, A., Lefèvre, D.,Souvermezoglou, E., Yilmaz, A., Tugrul, S., and Ribera d'Alcala, M.: Compilation of quality controlled nutrient profiles from the Mediterranean Sea, doi:10.1594/PANGAEA.771907, 2011.
-
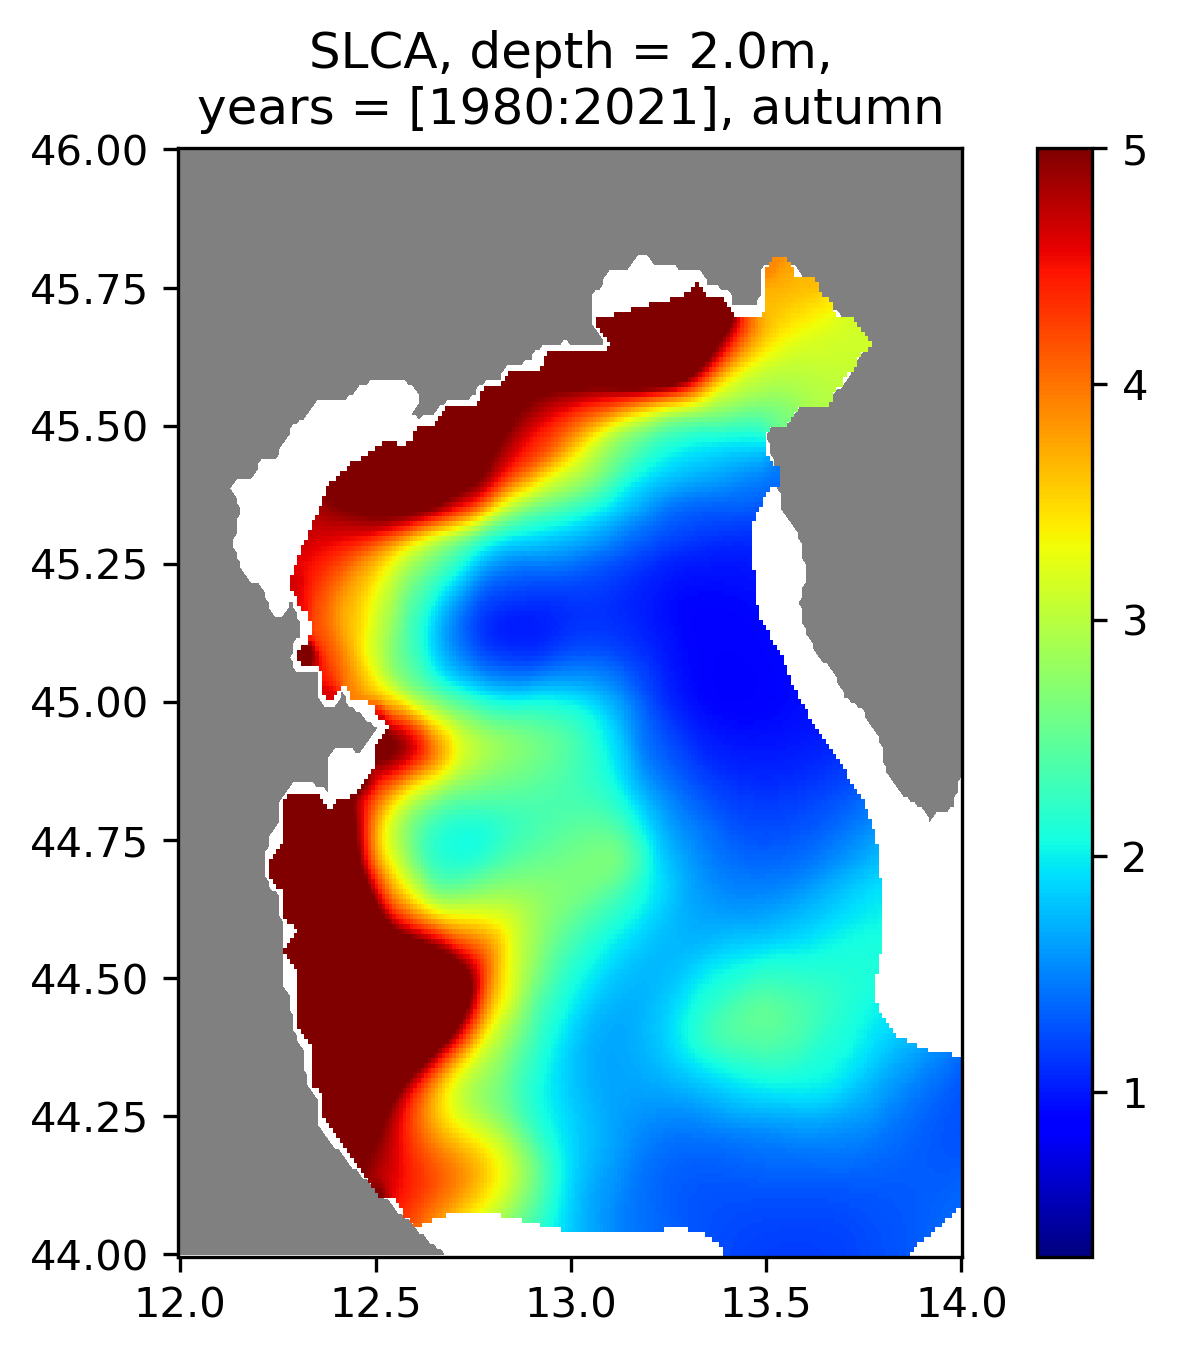
Water body silicate - Seasonal Climatology for Po River for the period 1980-2021 on the domain: Lon E12.0-14.0deg., Lat N44.0-46.0deg. Data Sources: observational data from SeaDataNet/EMODNet Chemistry Data Network. Description of DIVA analysis: The computation was done with the DIVAnd (Data-Interpolating Variational Analysis in n dimensions), version 2.7.9, using GEBCO 30sec topography for the spatial connectivity of water masses. The horizontal resolution of the produced DIVAnd maps grids is dx=dy=0.009 degrees (around 975m and 708m accordingly). The vertical resolution is 14 depth levels: [0., 2., 4., 6., 8., 10., 15., 20., 25., 30., 40., 50., 60., 70.]. A relative correlation length used based on topography gradients and the horizontal correlation length varies from 25 km to 12.5 km. The vertical correlation length (in meters) is: [4.,4.,4.,4.,4.,10.,10.,10.,10.,20.,20.,20.,20.,20.]. Duplicates check was performed using the following criteria for space and time: dlon=0.01deg., dlat=0.01deg., ddepth=0.01m, dtime=1min, dvalue=0.01. The error variance (epsilon2) was set equal to 1. Data weight was reduced at shallow waters. Data weighting was applied with the following threshold values: lon=0.03, lat=0.03, depth=2. An anamorphosis transformation was applied to the data (function DIVAnd.Anam.loglin) to avoid unrealistic negative values: threshold value=200. The mean value was used as background analysis field. Quality control of the observations was applied using the interpolated field (QCMETHOD=3). Residuals (differences between the observations and the analysis (interpolated linearly to the location of the observations) were calculated. Observations with residuals outside the minimum and maximum values of the 99% quantile were discarded from the analysis. Seasons definition: Winter=Jan-Mar, Spring=Apr-Jun, Summer=Jul-Sep, Autumn=Oct-Dec. Originators of Italian data sets-List of contributors: - Brunetti Fabio (OGS) - Cardin Vanessa, Bensi Manuel doi:10.6092/36728450-4296-4e6a-967d-d5b6da55f306 - Cardin Vanessa, Bensi Manuel, Ursella Laura, Siena Giuseppe doi:10.6092/f8e6d18e-f877-4aa5-a983-a03b06ccb987 - Cataletto Bruno (OGS) - Cinzia Comici Cinzia (OGS) - Civitarese Giuseppe (OGS) - DeVittor Cinzia (OGS) - Giani Michele (OGS) - Kovacevic Vedrana (OGS) - Mosetti Renzo (OGS) - Solidoro C.,Beran A.,Cataletto B.,Celussi M.,Cibic T.,Comici C.,Del Negro P.,De Vittor C.,Minocci M.,Monti M.,Fabbro C.,Falconi C.,Franzo A.,Libralato S.,Lipizer M.,Negussanti J.S.,Russel H.,Valli G., doi:10.6092/e5518899-b914-43b0-8139-023718aa63f5 - Celio Massimo (ARPA FVG) - Malaguti Antonella (ENEA) - Fonda Umani Serena (UNITS) - Bignami Francesco (ISAC/CNR) - Boldrini Alfredo (ISMAR/CNR) - Marini Mauro (ISMAR/CNR) - Miserocchi Stefano (ISMAR/CNR) - Zaccone Renata (IAMC/CNR) - Lavezza, R., Dubroca, L. F. C., Ludicone, D., Kress, N., Herut, B., Civitarese, G., Cruzado, A., Lefèvre, D.,Souvermezoglou, E., Yilmaz, A., Tugrul, S., and Ribera d'Alcala, M.: Compilation of quality controlled nutrient profiles from the Mediterranean Sea, doi:10.1594/PANGAEA.771907, 2011.
-
Water body phosphate - Seasonal Climatology for Po River for the period 1980-2019 on the domain: Lon E12.0-14.0 deg.E, Lat N44.0-46.00 deg.N. Data Sources: observational data from SeaDataNet/EMODNet Chemistry Data Network. Description of DIVA analysis: The computation was done with the DIVAnd (Data-Interpolating Variational Analysis in n dimensions), version 2.7.4, using GEBCO 30sec topography for the spatial connectivity of water masses. A relative correlation length used based on topography gradients and the horizontal correlation length varies from 25 km to 12.5 km. The vertical correlation length (in meters) is: [4.,4.,4.,4.,4.,10.,10.,10.,10.,20.,20.,20.,20.,20.]. Depth range: [0., 2., 4., 6., 8., 10., 15., 20., 25., 30., 40., 50., 60., 70.]. Units: umol/l. The horizontal resolution of the produced DIVAnd maps grids is dx=dy=0.009 degrees (around 975m and 708m accordingly). Additional analysis parameters: The error variance (epsilon2) was set equal to 1. Data weight was reduced near the coasts. Data weighting was applied with the following threshold values: lon=0.03, lat=0.03, depth=2. Threshold value for log transformation=200. Seasons definition: Winter=Jan-Mar, Spring=Apr-Jun, Summer=Jul-Sep, Autumn=Oct-Dec. DOI: 10.6092/jb28-9k33
-
Dissolved inorganic nitrogen (DIN) - Seasonal Climatology for Po River for the period 1980-2019 on the domain: Lon E12.0-14.0 deg.E, Lat N44.0-46.00 deg.N. Data Sources: observational data from SeaDataNet/EMODNet Chemistry Data Network. Description of DIVA analysis: The computation was done with the DIVAnd (Data-Interpolating Variational Analysis in n dimensions), version 2.7.4, using GEBCO 30sec topography for the spatial connectivity of water masses. A relative correlation length used based on topography gradients and the horizontal correlation length varies from 25 km to 12.5 km. The vertical correlation length (in meters) is: [4.,4.,4.,4.,4.,10.,10.,10.,10.,20.,20.,20.,20.,20.]. Depth range: [0., 2., 4., 6., 8., 10., 15., 20., 25., 30., 40., 50., 60., 70.]. Units: umol/l. The horizontal resolution of the produced DIVAnd maps grids is dx=dy=0.009 degrees (around 975m and 708m accordingly). Additional analysis parameters: The error variance (epsilon2) was set equal to 1. Data weight was reduced near the coasts. Data weighting was applied with the following threshold values: lon=0.03, lat=0.03, depth=2. Threshold value for log transformation=200. Seasons definition: Winter=Jan-Mar, Spring=Apr-Jun, Summer=Jul-Sep, Autumn=Oct-Dec. DOI: 10.6092/p8ec-3v81
-
Water body chlorophyll-a - Seasonal Climatology for Po River for the period 1980-2019 on the domain: Lon E12.0-14.0 deg.E, Lat N44.0-46.00 deg.N. Data Sources: observational data from SeaDataNet/EMODNet Chemistry Data Network. Description of DIVA analysis: The computation was done with the DIVAnd (Data-Interpolating Variational Analysis in n dimensions), version 2.7.4, using GEBCO 30sec topography for the spatial connectivity of water masses. A relative correlation length used based on topography gradients and the horizontal correlation length varies from 25 km to 12.5 km. The vertical correlation length (in meters) is: [4.,4.,4.,4.,4.,10.,10.,10.,10.,20.,20.,20.,20.,20.]. Depth range: [0., 2., 4., 6., 8., 10., 15., 20., 25., 30., 40., 50., 60., 70.]. Units: mg/m3. The horizontal resolution of the produced DIVAnd maps grids is dx=dy=0.009 degrees (around 975m and 708m accordingly). Additional analysis parameters: The error variance (epsilon2) was set equal to 1. Data weight was reduced near the coasts. Data weighting was applied with the following threshold values: lon=0.03, lat=0.03, depth=2. Threshold value for log transformation=200. Seasons definition: Winter=Jan-Mar, Spring=Apr-Jun, Summer=Jul-Sep, Autumn=Oct-Dec. DOI: 10.6092/nv0n-4996
-
Water body dissolved oxygen concentration - Seasonal Climatology for Po River for the period 1960-2019 on the domain: Lon E12.0-14.0 deg.E, Lat N44.0-46.00 deg.N. Data Sources: observational data from SeaDataNet/EMODNet Chemistry Data Network. Description of DIVA analysis: The computation was done with the DIVAnd (Data-Interpolating Variational Analysis in n dimensions), version 2.7.4, using GEBCO 30sec topography for the spatial connectivity of water masses. A relative correlation length used based on topography gradients and the horizontal correlation length varies from 25 km to 12.5 km. The vertical correlation length (in meters) is: [4.,4.,4.,4.,4.,10.,10.,10.,10.,20.,20.,20.,20.,20.]. Depth range: [0., 2., 4., 6., 8., 10., 15., 20., 25., 30., 40., 50., 60., 70.]. Units: umol/l. The horizontal resolution of the produced DIVAnd maps grids is dx=dy=0.009 degrees (around 975m and 708m accordingly). Additional analysis parameters: The error variance (epsilon2) was set equal to 1. Data weight was reduced near the coasts. Data weighting was applied with the following threshold values: lon=0.03, lat=0.03, depth=2. Threshold value for log transformation=200. Seasons definition: Winter=Jan-Mar, Spring=Apr-Jun, Summer=Jul-Sep, Autumn=Oct-Dec. DOI: 10.6092/tasv-9066
-
Water body silicate - Seasonal Climatology for Po River for the period 1980-2019 on the domain: Lon E12.0-14.0 deg.E, Lat N44.0-46.00 deg.N. Data Sources: observational data from SeaDataNet/EMODNet Chemistry Data Network. Description of DIVA analysis: The computation was done with the DIVAnd (Data-Interpolating Variational Analysis in n dimensions), version 2.7.4, using GEBCO 30sec topography for the spatial connectivity of water masses. A relative correlation length used based on topography gradients and the horizontal correlation length varies from 25 km to 12.5 km. The vertical correlation length (in meters) is: [4.,4.,4.,4.,4.,10.,10.,10.,10.,20.,20.,20.,20.,20.]. Depth range: [0., 2., 4., 6., 8., 10., 15., 20., 25., 30., 40., 50., 60., 70.]. Units: umol/l. The horizontal resolution of the produced DIVAnd maps grids is dx=dy=0.009 degrees (around 975m and 708m accordingly). Additional analysis parameters: The error variance (epsilon2) was set equal to 1. Data weight was reduced near the coasts. Data weighting was applied with the following threshold values: lon=0.03, lat=0.03, depth=2. Threshold value for log transformation=200. Seasons definition: Winter=Jan-Mar, Spring=Apr-Jun, Summer=Jul-Sep, Autumn=Oct-Dec. DOI: 10.6092/njvc-n987