 EMODnet Product Catalogue
Sediment grain size parameters
Type of resources
Available actions
Topics
Keywords
Contact for the resource
Provided by
Years
Formats
Representation types
-
EMODnet Chemistry aims to provide access to marine chemistry data sets and derived data products concerning eutrophication, ocean acidification and contaminants. The chemicals chosen reflect importance to the Marine Strategy Framework Directive (MSFD). This regional aggregated dataset contains all unrestricted EMODnet Chemistry data on contaminants (24 parameters), and covers the Mediterranean Sea with 4517 CDI records divided per matrices: 520 biota profiles, 560 water profiles, 3437 sediment (26 Vertical profiles and 3411 Time series). In the water dataset, the vertical profiles temporal range is from 1974-09-12 to 2015-09-14. In sediment dataset, vertical profiles temporal range is from 2010-08-02 to 2014-09-28 and time series temporal range is from 1981-06-27 to 2018-08-02. In biota time series temporal range is from 1979-03-29 to 2017-03-15. Data were aggregated and quality controlled by ‘Hellenic Centre for Marine Research, Hellenic National Oceanographic Data Centre (HCMR/HNODC)’ from Greece. Regional datasets concerning contaminants are automatically harvested. Parameter names in these datasets are based on P01, BODC Parameter Usage Vocabulary, which is available at: http://seadatanet.maris2.nl/bandit/browse_step.php . Each measurement value has a quality flag indicator. The resulting data collections for each Sea Basin are harmonised, and the collections are quality controlled by EMODnet Chemistry Regional Leaders using ODV Software and following a common methodology for all Sea Regions. Harmonisation means that: (1) unit conversion is carried out to express contaminant concentrations with a limited set of measurement units (according to EU directives 2013/39/UE; Comm. Dec. EU 2017/848) and (2) merging of variables described by different “local names” ,but corresponding exactly to the same concepts in BODC P01 vocabulary. The harmonised dataset can be downloaded as ODV spreadsheet (TXT file), which is composed of metadata header followed by tab separated values. This worksheet can be imported to ODV Software for visualisation (More information can be found at: https://www.seadatanet.org/Software/ODV ). The same dataset is offered also as XLSX file in a long/vertical format, in which each P01 measurement is a record line. Additionally, there are a series of columns that split P01 terms in subcomponents (measure, substance, CAS number, matrix...).This transposed format is more adapted to worksheet applications users (e.g. LibreOffice Calc). The 24 parameter names in this metadata record are based on P02, SeaDataNet Parameter Discovery Vocabulary, which is available at: http://seadatanet.maris2.nl/v_bodc_vocab_v2/vocab_relations.asp?lib=P02 . Detailed documentation will be published soon. The original datasets can be searched and downloaded from EMODnet Chemistry Download Service: https://emodnet-chemistry.maris.nl/search
-
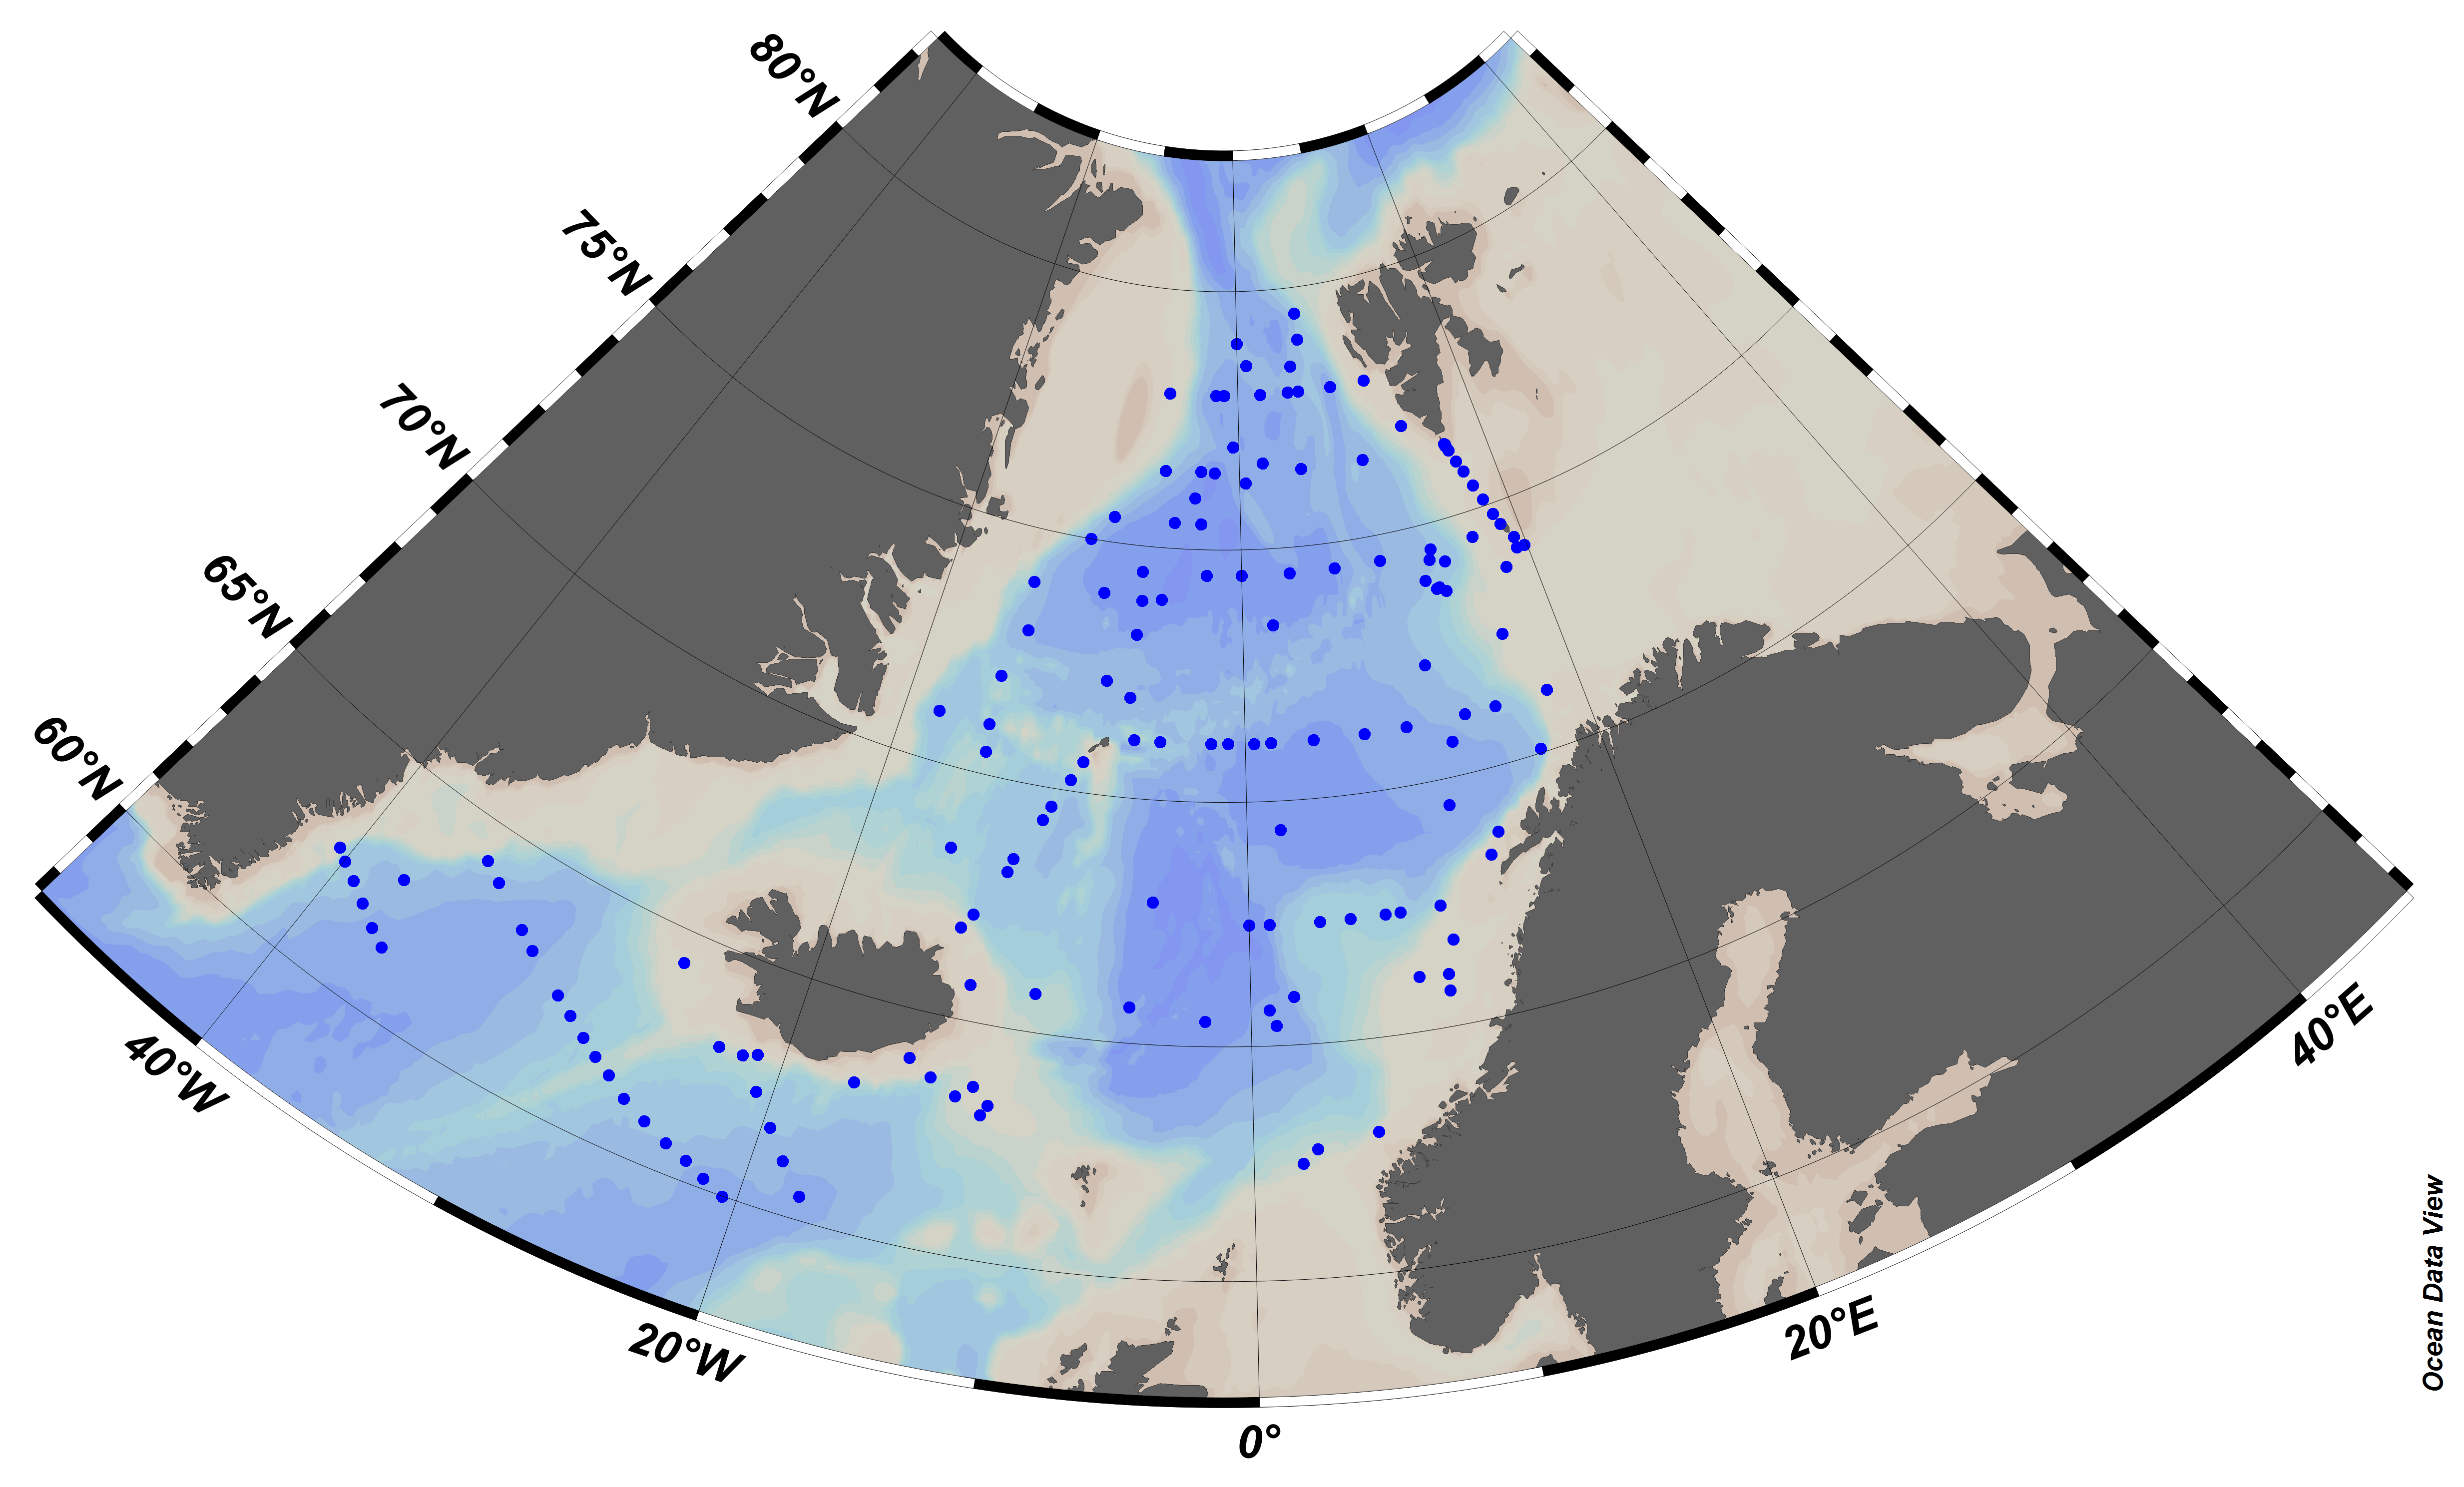
EMODnet Chemistry aims to provide access to marine chemistry data sets and derived data products concerning eutrophication, ocean acidification and contaminants. The chemicals chosen reflect importance to the Marine Strategy Framework Directive (MSFD). This regional aggregated dataset contains all unrestricted EMODnet Chemistry data on contaminants (20 parameters), and covers the Arctic Ocean with 548 CDI records divided per matrices: 235 water profiles, 313 sediment profiles. Vertical profiles temporal range is from 1974-03-25 to 2015-06-15. Data were aggregated and quality controlled by ‘Institute of Marine Research - Norwegian Marine Data Centre (NMD)’ from Norway. Regional datasets concerning contaminants are automatically harvested. Parameter names in these datasets are based on P01, BODC Parameter Usage Vocabulary, which is available at: http://seadatanet.maris2.nl/bandit/browse_step.php . Each measurement value has a quality flag indicator. The resulting data collections for each Sea Basin are harmonised, and the collections are quality controlled by EMODnet Chemistry Regional Leaders using ODV Software and following a common methodology for all Sea Regions. Harmonisation means that: (1) unit conversion is carried out to express contaminant concentrations with a limited set of measurement units (according to EU directives 2013/39/UE; Comm. Dec. EU 2017/848) and (2) merging of variables described by different “local names” ,but corresponding exactly to the same concepts in BODC P01 vocabulary. The harmonised dataset can be downloaded as ODV spreadsheet (TXT file), which is composed of metadata header followed by tab separated values. This worksheet can be imported to ODV Software for visualisation (More information can be found at: https://www.seadatanet.org/Software/ODV ). The same dataset is offered also as XLSX file in a long/vertical format, in which each P01 measurement is a record line. Additionally, there are a series of columns that split P01 terms in subcomponents (measure, substance, CAS number, matrix...).This transposed format is more adapted to worksheet applications users (e.g. LibreOffice Calc). The 20 parameter names in this metadata record are based on P02, SeaDataNet Parameter Discovery Vocabulary, which is available at: http://seadatanet.maris2.nl/v_bodc_vocab_v2/vocab_relations.asp?lib=P02 . Detailed documentation will be published soon. The original datasets can be searched and downloaded from EMODnet Chemistry Download Service: https://emodnet-chemistry.maris.nl/search
-
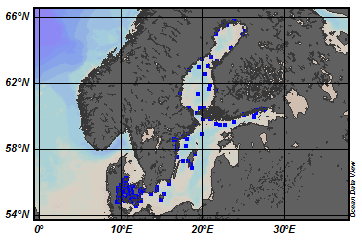
EMODnet Chemistry aims to provide access to marine chemistry data sets and derived data products concerning eutrophication, ocean acidification and contaminants. The chemicals chosen reflect importance to the Marine Strategy Framework Directive (MSFD). This regional aggregated dataset contains all unrestricted EMODnet Chemistry data on contaminants (49 parameters), and covers the Baltic Sea with 3818 CDI records divided per matrices: 1358 biota (396 Vertical profiles and 962 Time series),906 water profiles, 2510 sediment profiles. Vertical profiles temporal range is from 1985-04-16 to 2016-09-27. Time series temporal range is from 1972-05-02 to 2017-10-30. Data were aggregated and quality controlled by ‘Swedish Meteorological and Hydrological Institute (SMHI)’ from Sweden. Regional datasets concerning contaminants are automatically harvested. Parameter names in these datasets are based on P01, BODC Parameter Usage Vocabulary, which is available at: http://seadatanet.maris2.nl/bandit/browse_step.php . Each measurement value has a quality flag indicator. The resulting data collections for each Sea Basin are harmonised, and the collections are quality controlled by EMODnet Chemistry Regional Leaders using ODV Software and following a common methodology for all Sea Regions. Harmonisation means that: (1) unit conversion is carried out to express contaminant concentrations with a limited set of measurement units (according to EU directives 2013/39/UE; Comm. Dec. EU 2017/848) and (2) merging of variables described by different “local names” ,but corresponding exactly to the same concepts in BODC P01 vocabulary. The harmonised dataset can be downloaded as ODV spreadsheet (TXT file), which is composed of metadata header followed by tab separated values. This worksheet can be imported to ODV Software for visualisation (More information can be found at: https://www.seadatanet.org/Software/ODV ). The same dataset is offered also as XLSX file in a long/vertical format, in which each P01 measurement is a record line. Additionally, there are a series of columns that split P01 terms in subcomponents (measure, substance, CAS number, matrix...).This transposed format is more adapted to worksheet applications users (e.g. LibreOffice Calc). The 49 parameter names in this metadata record are based on P02, SeaDataNet Parameter Discovery Vocabulary, which is available at: http://seadatanet.maris2.nl/v_bodc_vocab_v2/vocab_relations.asp?lib=P02 . Detailed documentation will be published soon. The original datasets can be searched and downloaded from EMODnet Chemistry Download Service: https://emodnet-chemistry.maris.nl/search
-
EMODnet Chemistry aims to provide access to marine chemistry data sets and derived data products concerning eutrophication, ocean acidification and contaminants. The chemicals chosen reflect importance to the Marine Strategy Framework Directive (MSFD). This regional aggregated dataset contains all unrestricted EMODnet Chemistry data on contaminants (20 parameters), and covers the North East Atlantic Ocean with 2400 CDI records divided per matrices: 122 in biota (as time series), 1689 in water (as vertical profiles), 589 in sediment (478 Vertical profiles and 111 Time series). Vertical profiles temporal range is from 1970-07-29 to 2017-02-28. Time series temporal range is from 1979-02-28 to 2014-10-21. Data were aggregated and quality controlled by ‘IFREMER / IDM / SISMER - Scientific Information Systems for the SEA’ from France. Regional datasets concerning contaminants are automatically harvested. Parameter names in these datasets are based on P01, BODC Parameter Usage Vocabulary, which is available at: http://seadatanet.maris2.nl/bandit/browse_step.php . Each measurement value has a quality flag indicator. The resulting data collections for each Sea Basin are harmonised, and the collections are quality controlled by EMODnet Chemistry Regional Leaders using ODV Software and following a common methodology for all Sea Regions. Harmonisation means that: (1) unit conversion is carried out to express contaminant concentrations with a limited set of measurement units (according to EU directives 2013/39/UE; Comm. Dec. EU 2017/848) and (2) merging of variables described by different “local names” ,but corresponding exactly to the same concepts in BODC P01 vocabulary. The harmonised dataset can be downloaded as ODV spreadsheet (TXT file), which is composed of metadata header followed by tab separated values. This worksheet can be imported to ODV Software for visualisation (More information can be found at: https://www.seadatanet.org/Software/ODV ). The same dataset is offered also as XLSX file in a long/vertical format, in which each P01 measurement is a record line. Additionally, there are a series of columns that split P01 terms in subcomponents (measure, substance, CAS number, matrix...).This transposed format is more adapted to worksheet applications users (e.g. LibreOffice Calc). The 20 parameter names in this metadata record are based on P02, SeaDataNet Parameter Discovery Vocabulary, which is available at: http://seadatanet.maris2.nl/v_bodc_vocab_v2/vocab_relations.asp?lib=P02 . Detailed documentation will be published soon. The original datasets can be searched and downloaded from EMODnet Chemistry Download Service: https://emodnet-chemistry.maris.nl/search
-
EMODnet Chemistry aims to provide access to marine chemistry data sets and derived data products concerning eutrophication, ocean acidification and contaminants. The chemicals chosen reflect importance to the Marine Strategy Framework Directive (MSFD). This regional aggregated dataset contains all unrestricted EMODnet Chemistry data on contaminants (59 parameters), and covers the North Sea with 34978 CDI records divided per matrices: 3909 biota time series, 28071 water profiles, 2998 sediment profiles. Vertical profiles temporal range is from 1970-02-17 to 2017-10-26. Time series temporal range is from 1979-02-26 to 2017-02-28. Data were aggregated and quality controlled by ‘Aarhus University, Department of Bioscience, Marine Ecology Roskilde from Denmark. Regional datasets concerning contaminants are automatically harvested. Parameter names in these datasets are based on P01, BODC Parameter Usage Vocabulary, which is available at: http://seadatanet.maris2.nl/bandit/browse_step.php . Each measurement value has a quality flag indicator. The resulting data collections for each Sea Basin are harmonised, and the collections are quality controlled by EMODnet Chemistry Regional Leaders using ODV Software and following a common methodology for all Sea Regions. Harmonisation means that: (1) unit conversion is carried out to express contaminant concentrations with a limited set of measurement units (according to EU directives 2013/39/UE; Comm. Dec. EU 2017/848) and (2) merging of variables described by different “local names” ,but corresponding exactly to the same concepts in BODC P01 vocabulary. The harmonised dataset can be downloaded as ODV spreadsheet (TXT file), which is composed of metadata header followed by tab separated values. This worksheet can be imported to ODV Software for visualisation (More information can be found at: https://www.seadatanet.org/Software/ODV ). The same dataset is offered also as XLSX file in a long/vertical format, in which each P01 measurement is a record line. Additionally, there are a series of columns that split P01 terms in subcomponents (measure, substance, CAS number, matrix...).This transposed format is more adapted to worksheet applications users (e.g. LibreOffice Calc). The 59 parameter names in this metadata record are based on P02, SeaDataNet Parameter Discovery Vocabulary, which is available at: http://seadatanet.maris2.nl/v_bodc_vocab_v2/vocab_relations.asp?lib=P02 . Detailed documentation will be published soon. The original datasets can be searched and downloaded from EMODnet Chemistry Download Service: https://emodnet-chemistry.maris.nl/search
-
The ReZoEnv field campaign was conducted at 9 sites distributed within contrasted seagrass (Zostera notlei) meadows in the Arcachon Bay. This multi-parameter survey was conducted during one year (November 2015 – November 2016). Water levels, temperature and light were recorded every 10 minutes. While bed sediment characteristics (granulometry, water content, organic matter content), seagrass characteristics (coverage, biometry, chlorophyll and CNP content) were measured monthly. Additionally, wind-wave parameters were obtained from high frequency pressure sensor at 4 sites, every 20 minutes. List of sites : ANDE : 44.745091 N, 1.121366 O FONT : 44.722631 N, 1.080133 O GAIL : 44.662573 N, 1.099575 O GARR : 44.705132 N, 1.121562 O HAUT : 44.729331 N, 1.15608 O ILE : 44.683117 N, 1.162716 O JACQ : 44.724563 N, 1.181109 O PASS : 44.689927 N, 1.089491 O ROCH : 44.648529 N, 1.127736 O Important Note: This submission has been initially submitted to SEA scieNtific Open data Edition (SEANOE) publication service and received the recorded DOI. The metadata elements have been further processed (refined) in EMODnet Ingestion Service in order to conform with the Data Submission Service specifications.
-
Dataset gives a baseline for micro- and mesoplastic pollution distribution in 24 beaches along the Latvian coastline (Northern Europe, Baltic states), filling the existing knowledge gap and contributing to the global understanding of microplastic particles presence, transport, and the processes governing its dynamics. We also highlight citizen science as a fundamental tool to support data collection and raise awareness about microplastic pollution, as samples were collected by up to 250 volunteers during organized campaigns (Dimante-Deimantovica et al. 2023).
-
This data set is associated with the manuscript draft entitled "How is particulate organic carbon transported in the Congo-River-fed Submarine Canyon to the deep-sea"? accpeted for publication in the Journal EGU Biogeosciences on 18 August 2024. The dataset includes grain-size measurements, total organic carbon contents, carbon stable isotopes and radiocarbon ages on sediment samples collected in a sediment trap and multi-cores in the Congo Submarine Canyon at 2 km of water depth. Important Note: This submission has been initially submitted to SEA scieNtific Open data Edition (SEANOE) publication service and received the recorded DOI. The metadata elements have been further processed (refined) in EMODnet Ingestion Service in order to conform with the Data Submission Service specifications.
-
Coastal marine sediments receive intensive stress from urbanization and industrialization, which is manifested by increased contents of heavy metals and organic pollutants. Saronikos Gulf and the small embayment of Elefsis, stretch along the coast of the greater Athens and Pireaus port, the most urbanized and industrialized areas in Greece. Here we present the data of a 20-years geochemical record on grain-size, organic carbon, and major and trace elements contents of the Saronikos Gulf sediments. A total of 216 sediment samples were collected within the period of 1999 to 2018 from the four sub-sectors of the gulf, namely, the Elefsis Bay, the Inner, Outer, and Western (Megara and Epidavros basin) Saronikos Gulf. Additionally, at least one core was obtained from each sub-sector. Sediments deposited at pre-industrial periods were recognized by 14C and 210Pb datings, and served for establishing regionalized, background levels of metals. Factor analysis was conducted to reveal the inter-parametric relationships, thus their common sources, as well as transport and deposition pathways. Then, Enrichment Factors and the multi-elemental Modified Pollution Index (MPI) were calculated to assess the current environmental status of the sediments. Data of sampling sites with at least a five-year record, were assessed for temporal trends, to explore whether sustained, increasing or decreasing trends of the MPI are observed. The dataset and analyses presented here support the research article entitled Geochemistry of major and trace elements in surface sediments of the Saronikos Gulf (Greece): assessment of contamination between 1999 and 2018 by Karageorgis A.P., Botsou F., Kaberi H., and Iliakis S., https://doi.org/10.1016/j.scitotenv.2020.137046
-
study to assecc the suitability of disposal of the surface sediment, after cleaning the channel, in the marine area of the internal Saronic Gulf (Dilaveri)