 EMODnet Product Catalogue
Baltic Sea
Type of resources
Available actions
Topics
Keywords
Contact for the resource
Provided by
Years
Formats
Representation types
Update frequencies
status
Scale 1:
Resolution
-
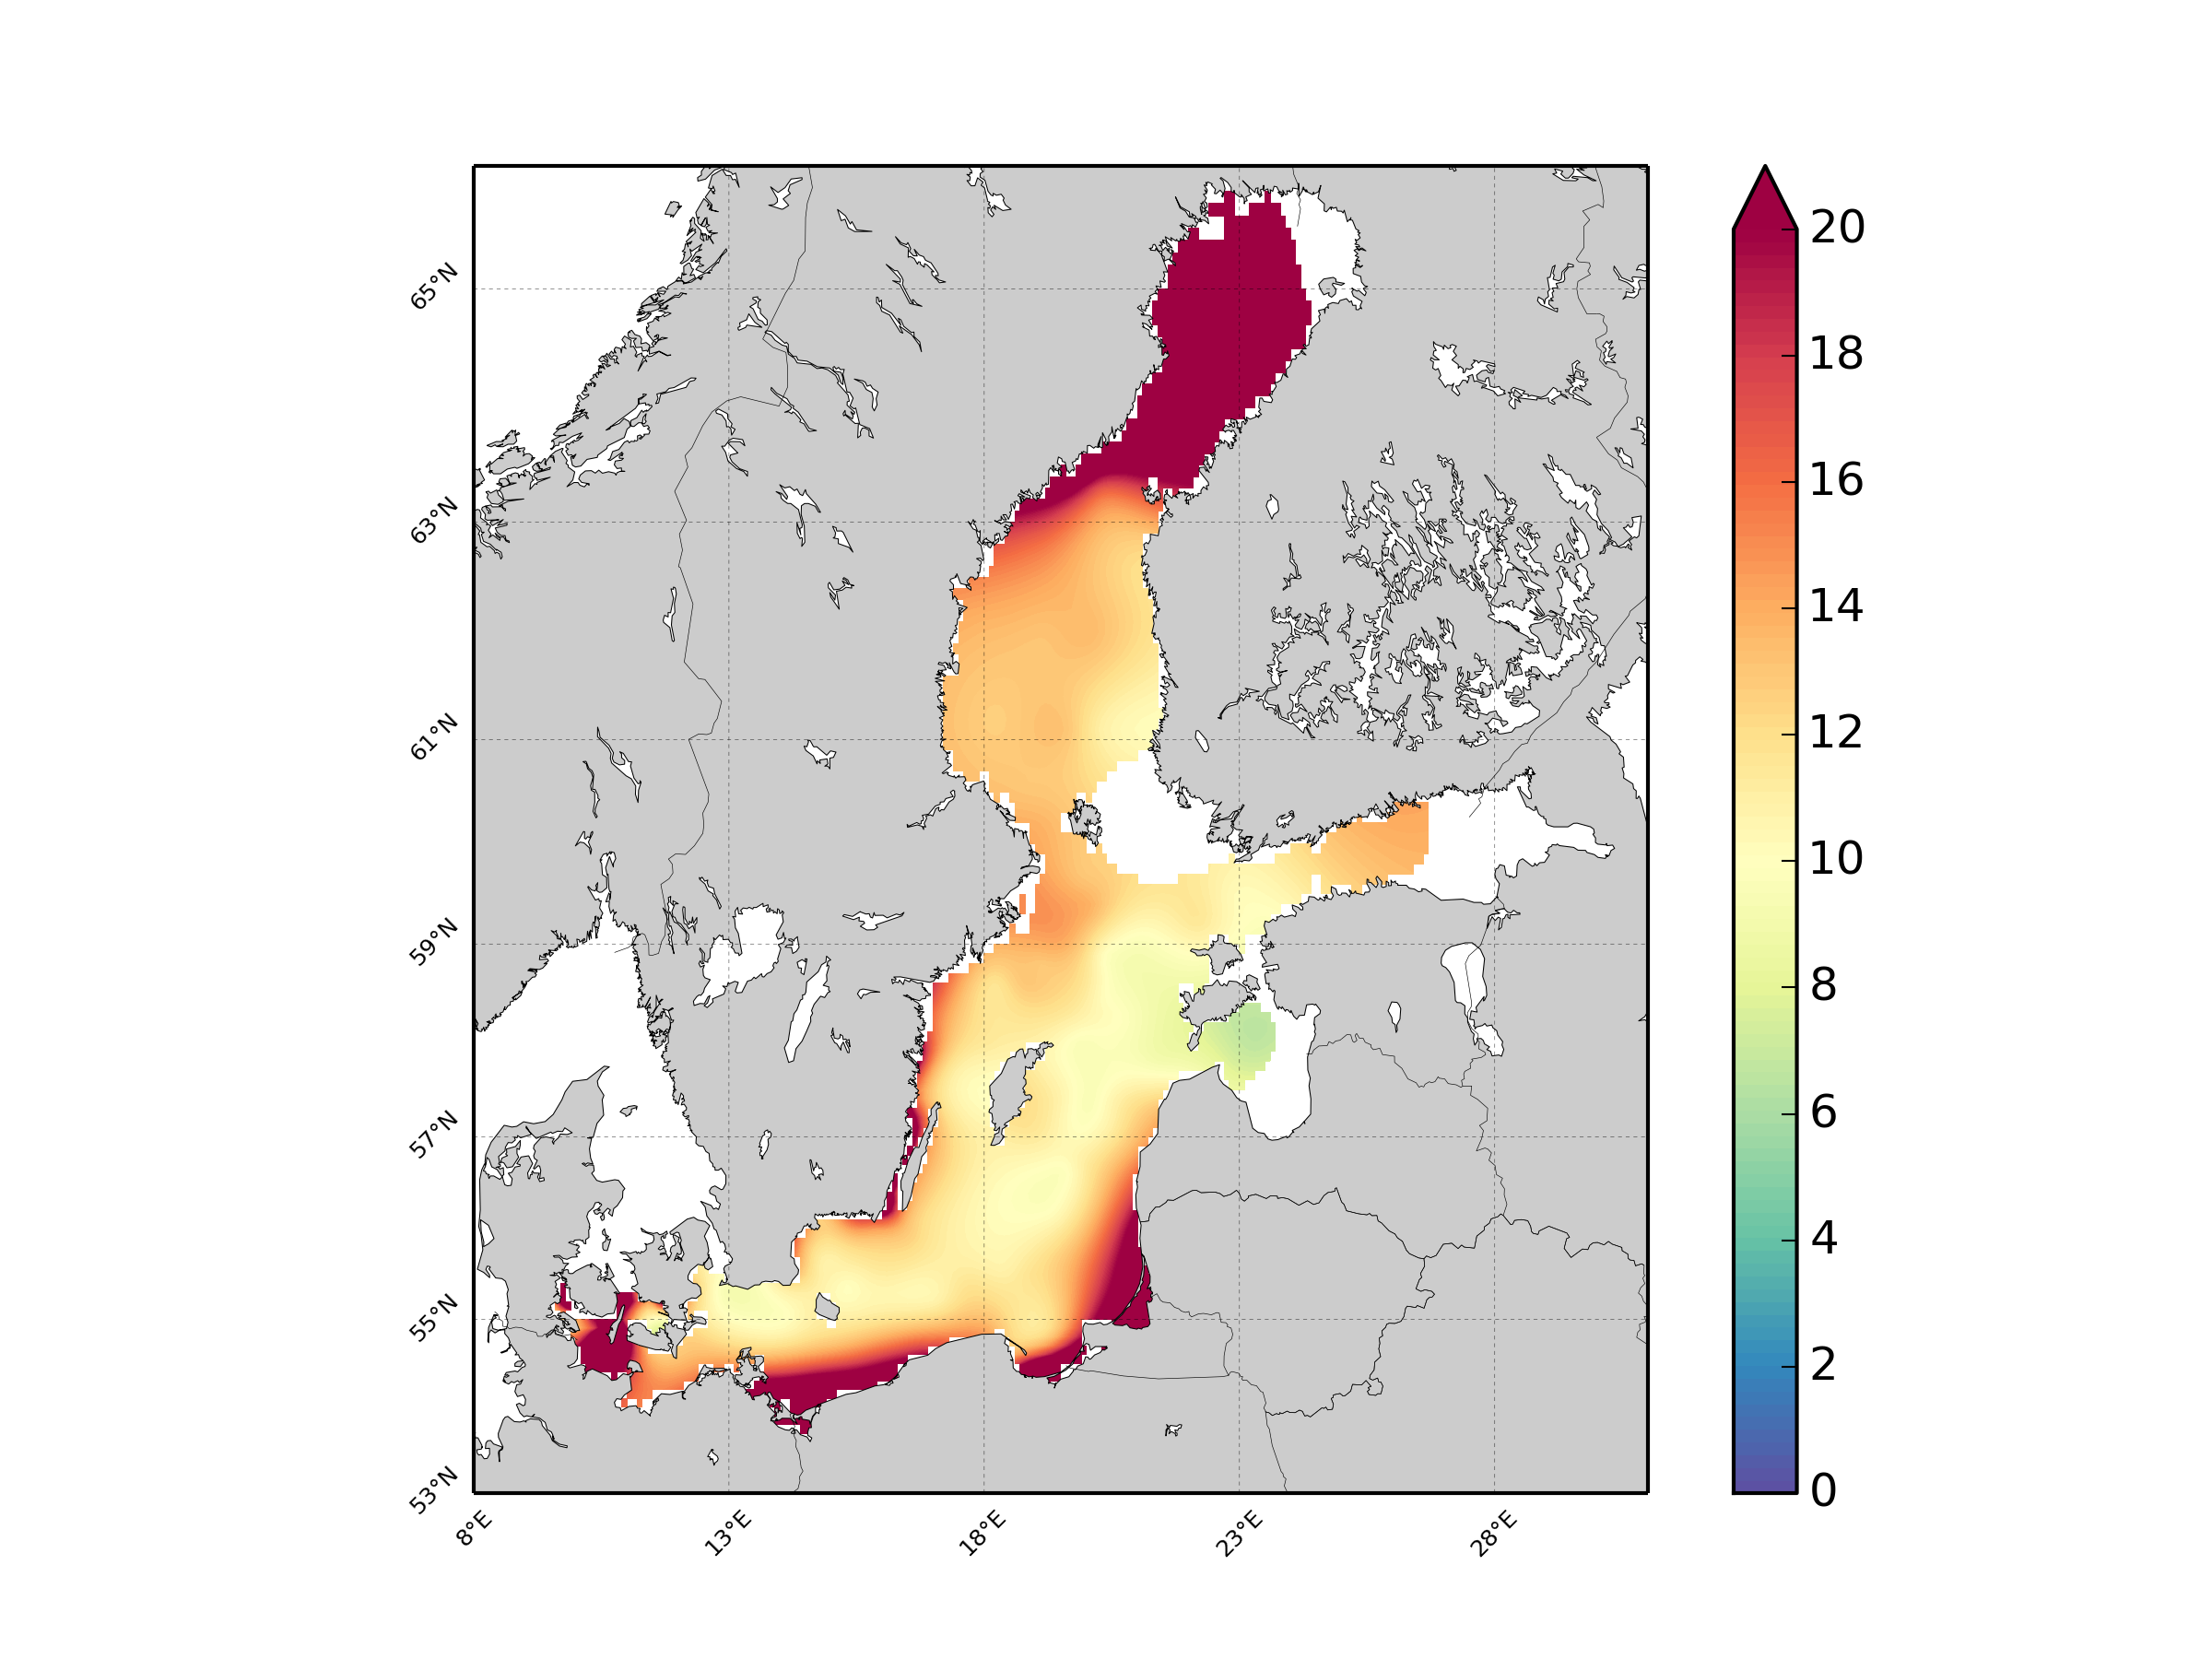
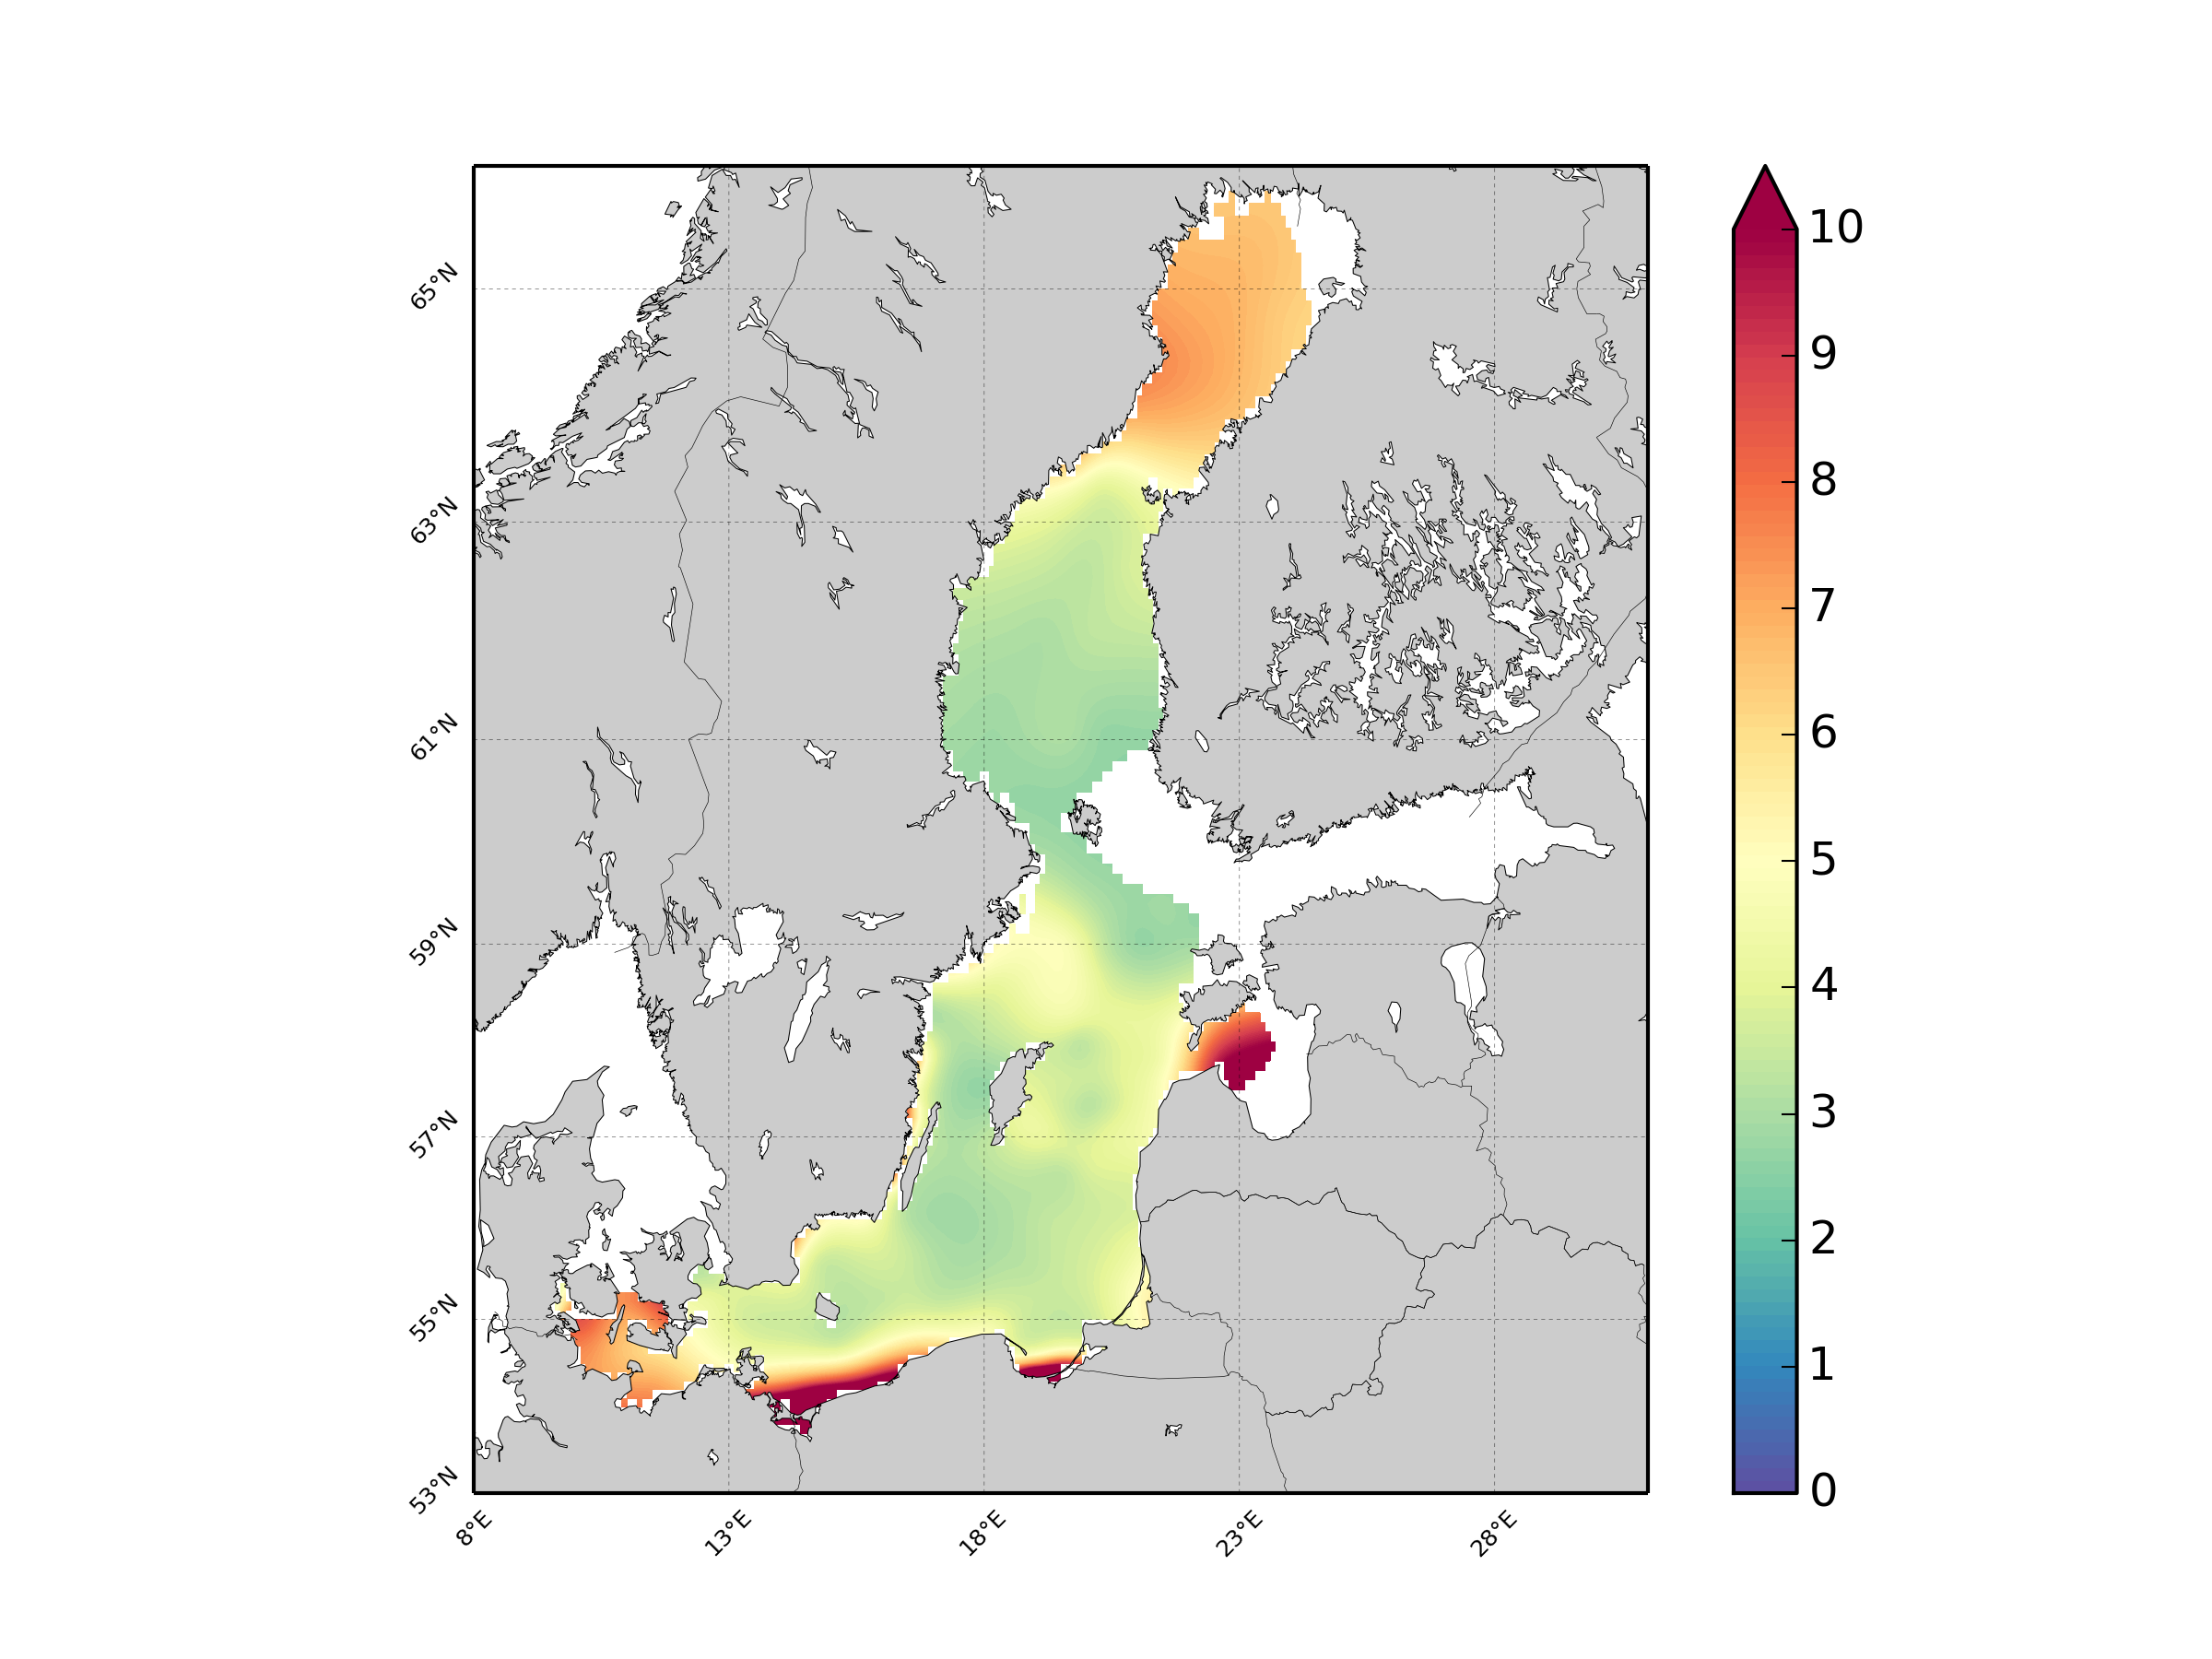
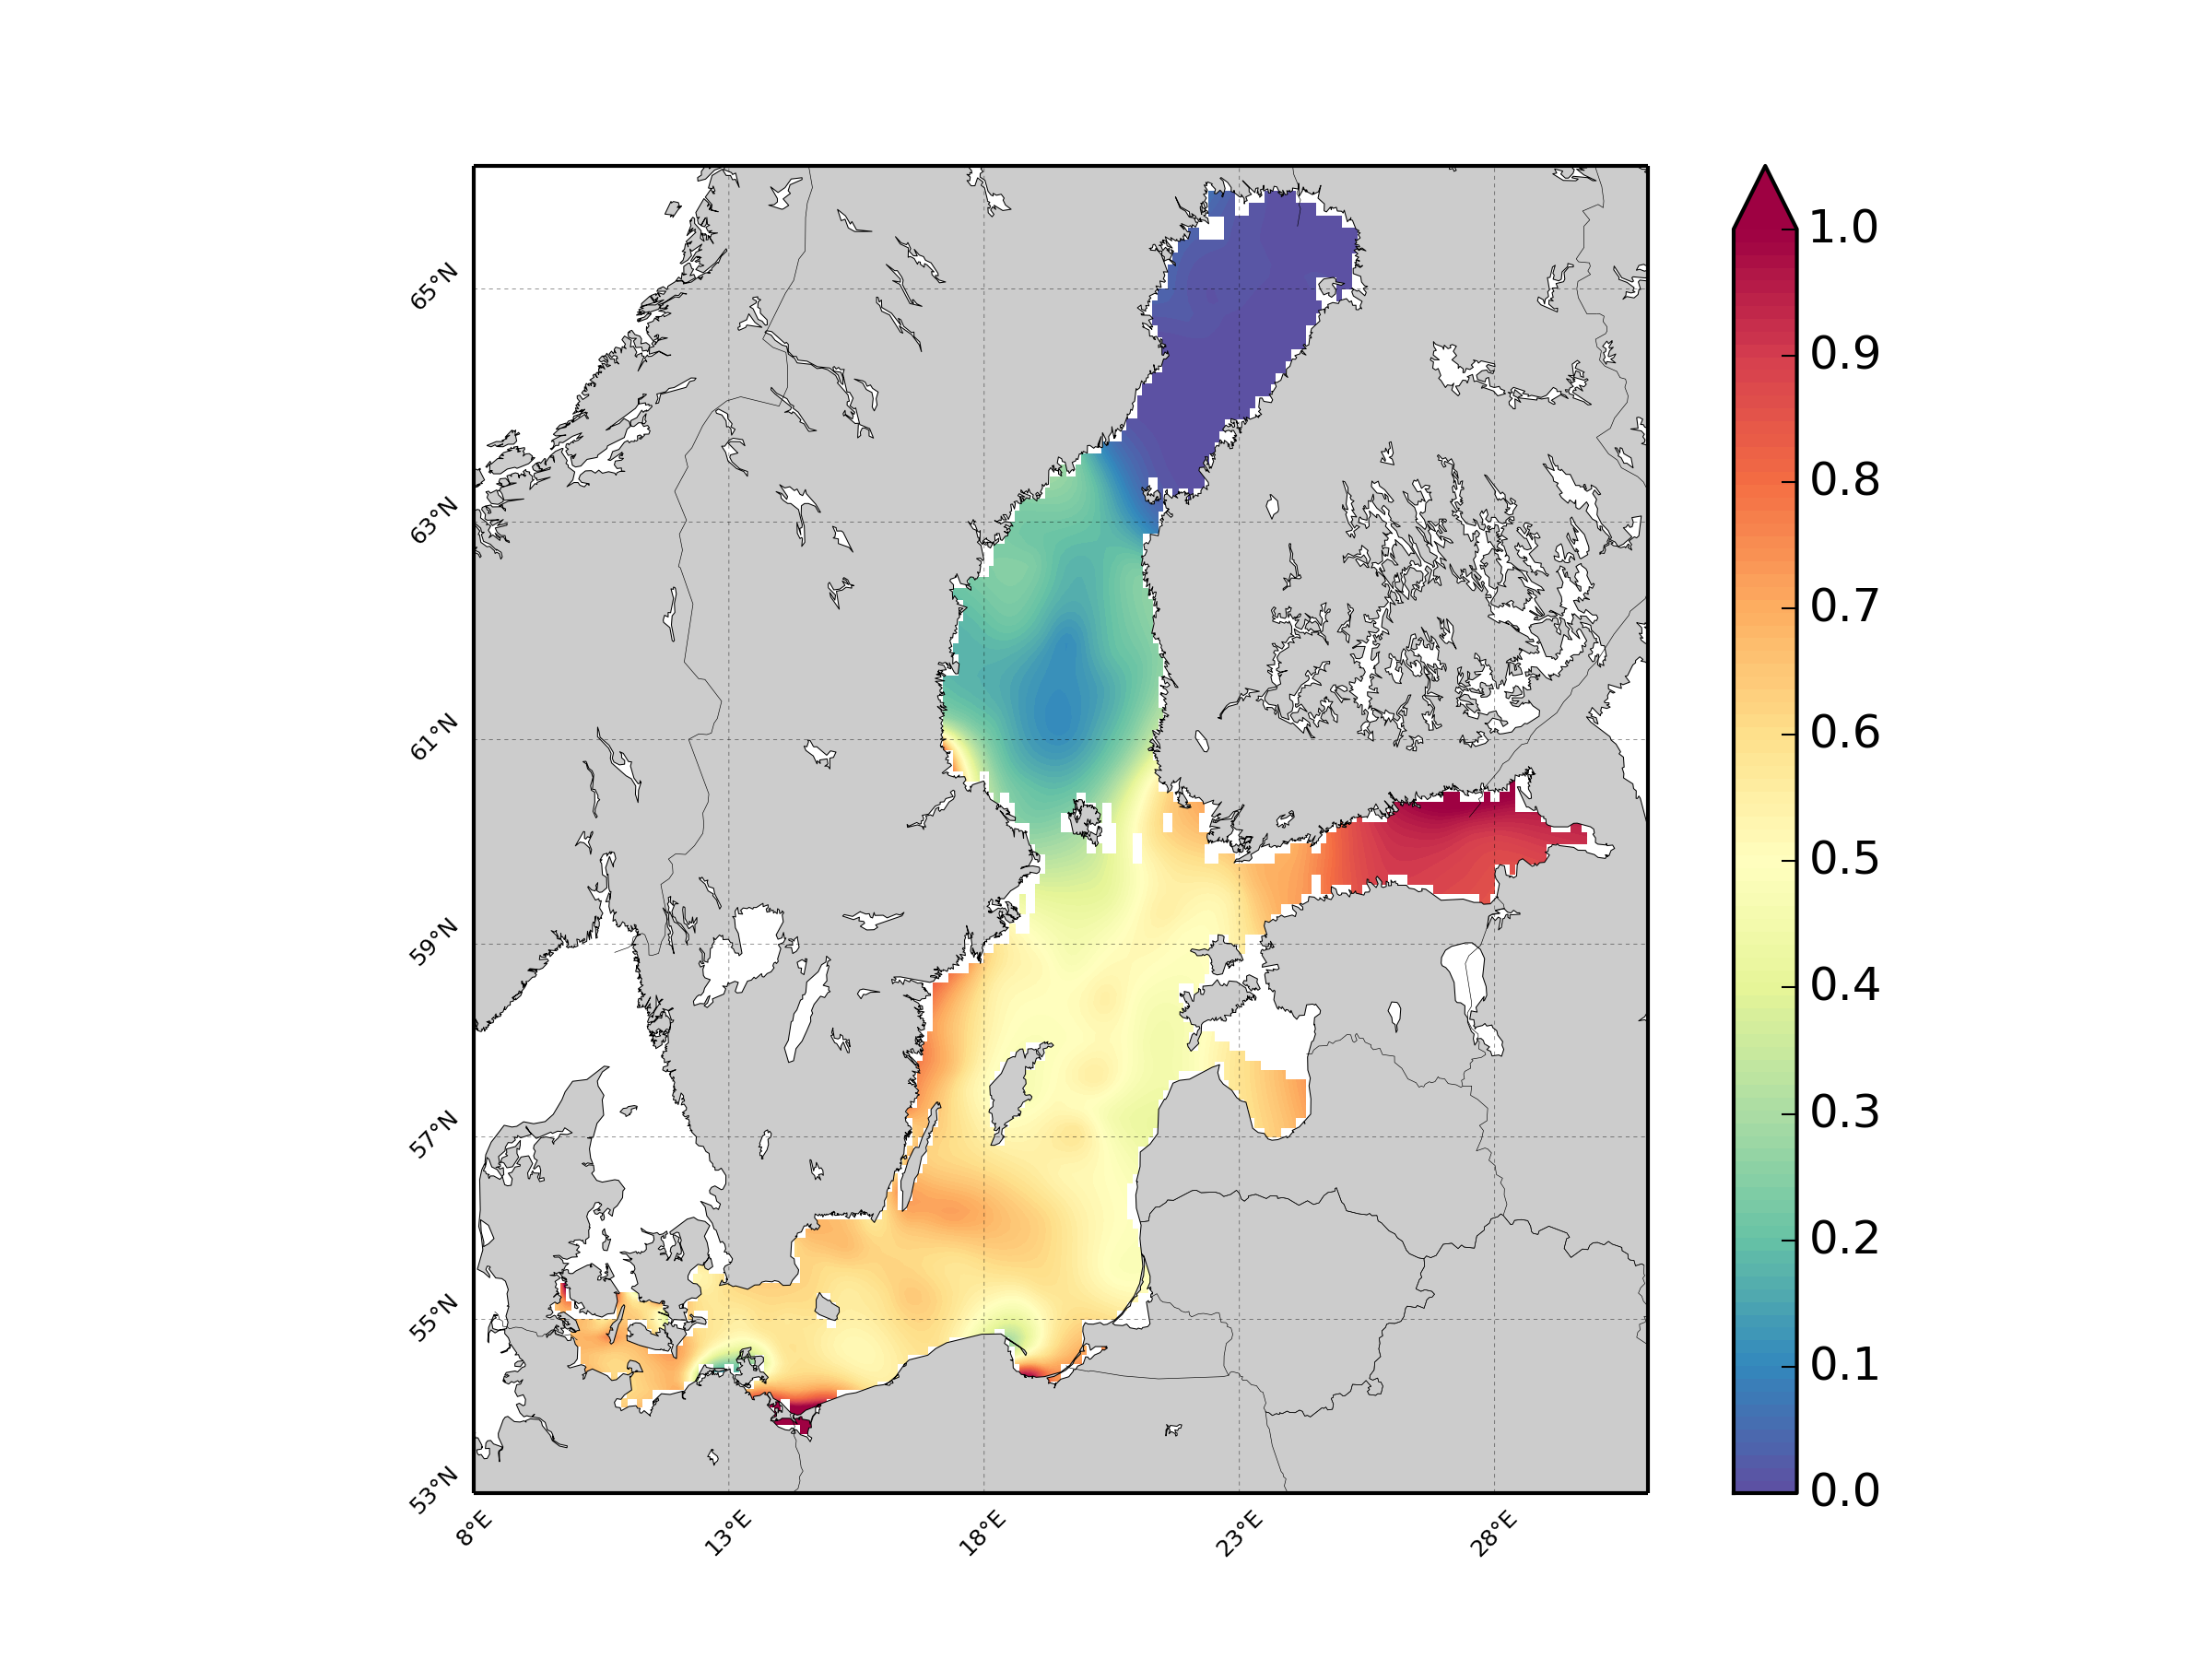
Units: umol/l. Method: spatial interpolation produced with DIVA (Data-Interpolating Variational Analysis). URL: http://modb.oce.ulg.ac.be/DIVA. Comment: Every year of the time dimension corresponds to a 10-year centred average for each season : - winter season (December-February), - spring (March-May), - summer (June-August), - autumn (September-November). Diva settings: Snr=1.0, CL=0.7.
-
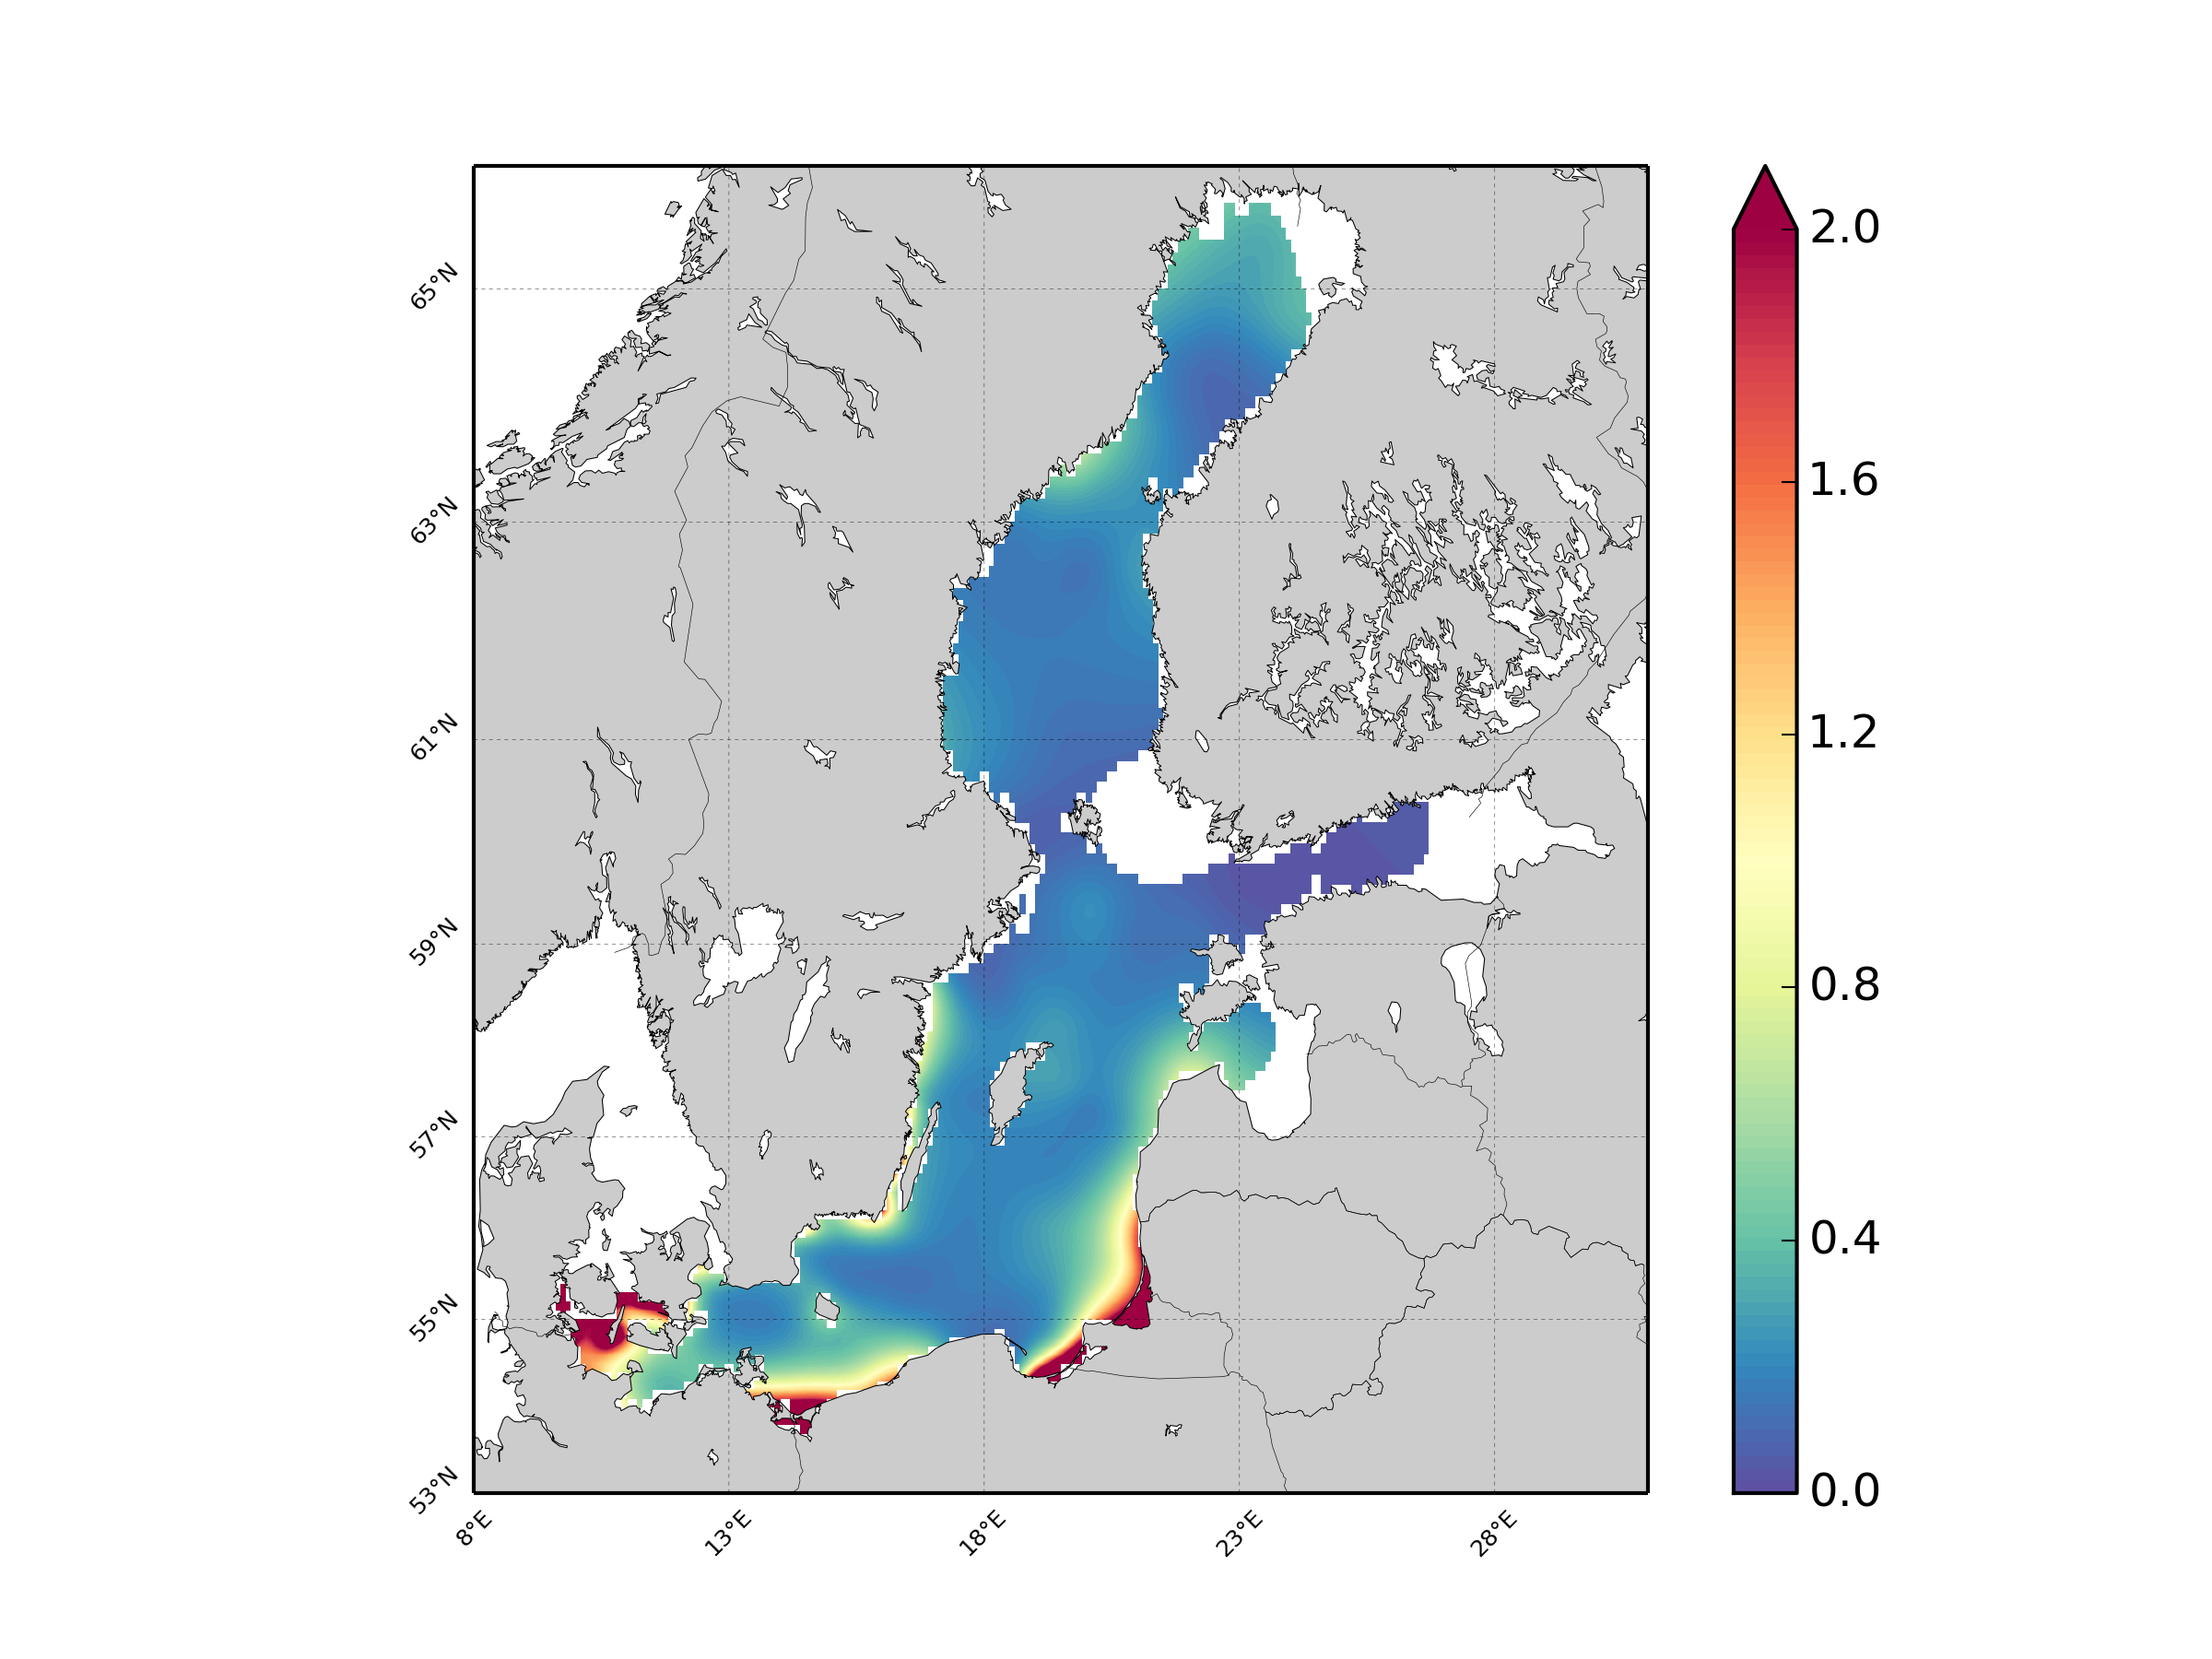
Units: umol/l. Method: spatial interpolation produced with DIVA (Data-Interpolating Variational Analysis). URL: http://modb.oce.ulg.ac.be/DIVA. Comment: Every year of the time dimension corresponds to a 10-year centred average for each season : - winter season (December-February), - spring (March-May), - summer (June-August), - autumn (September-November). Diva settings: Snr=1.0, CL=0.7
-
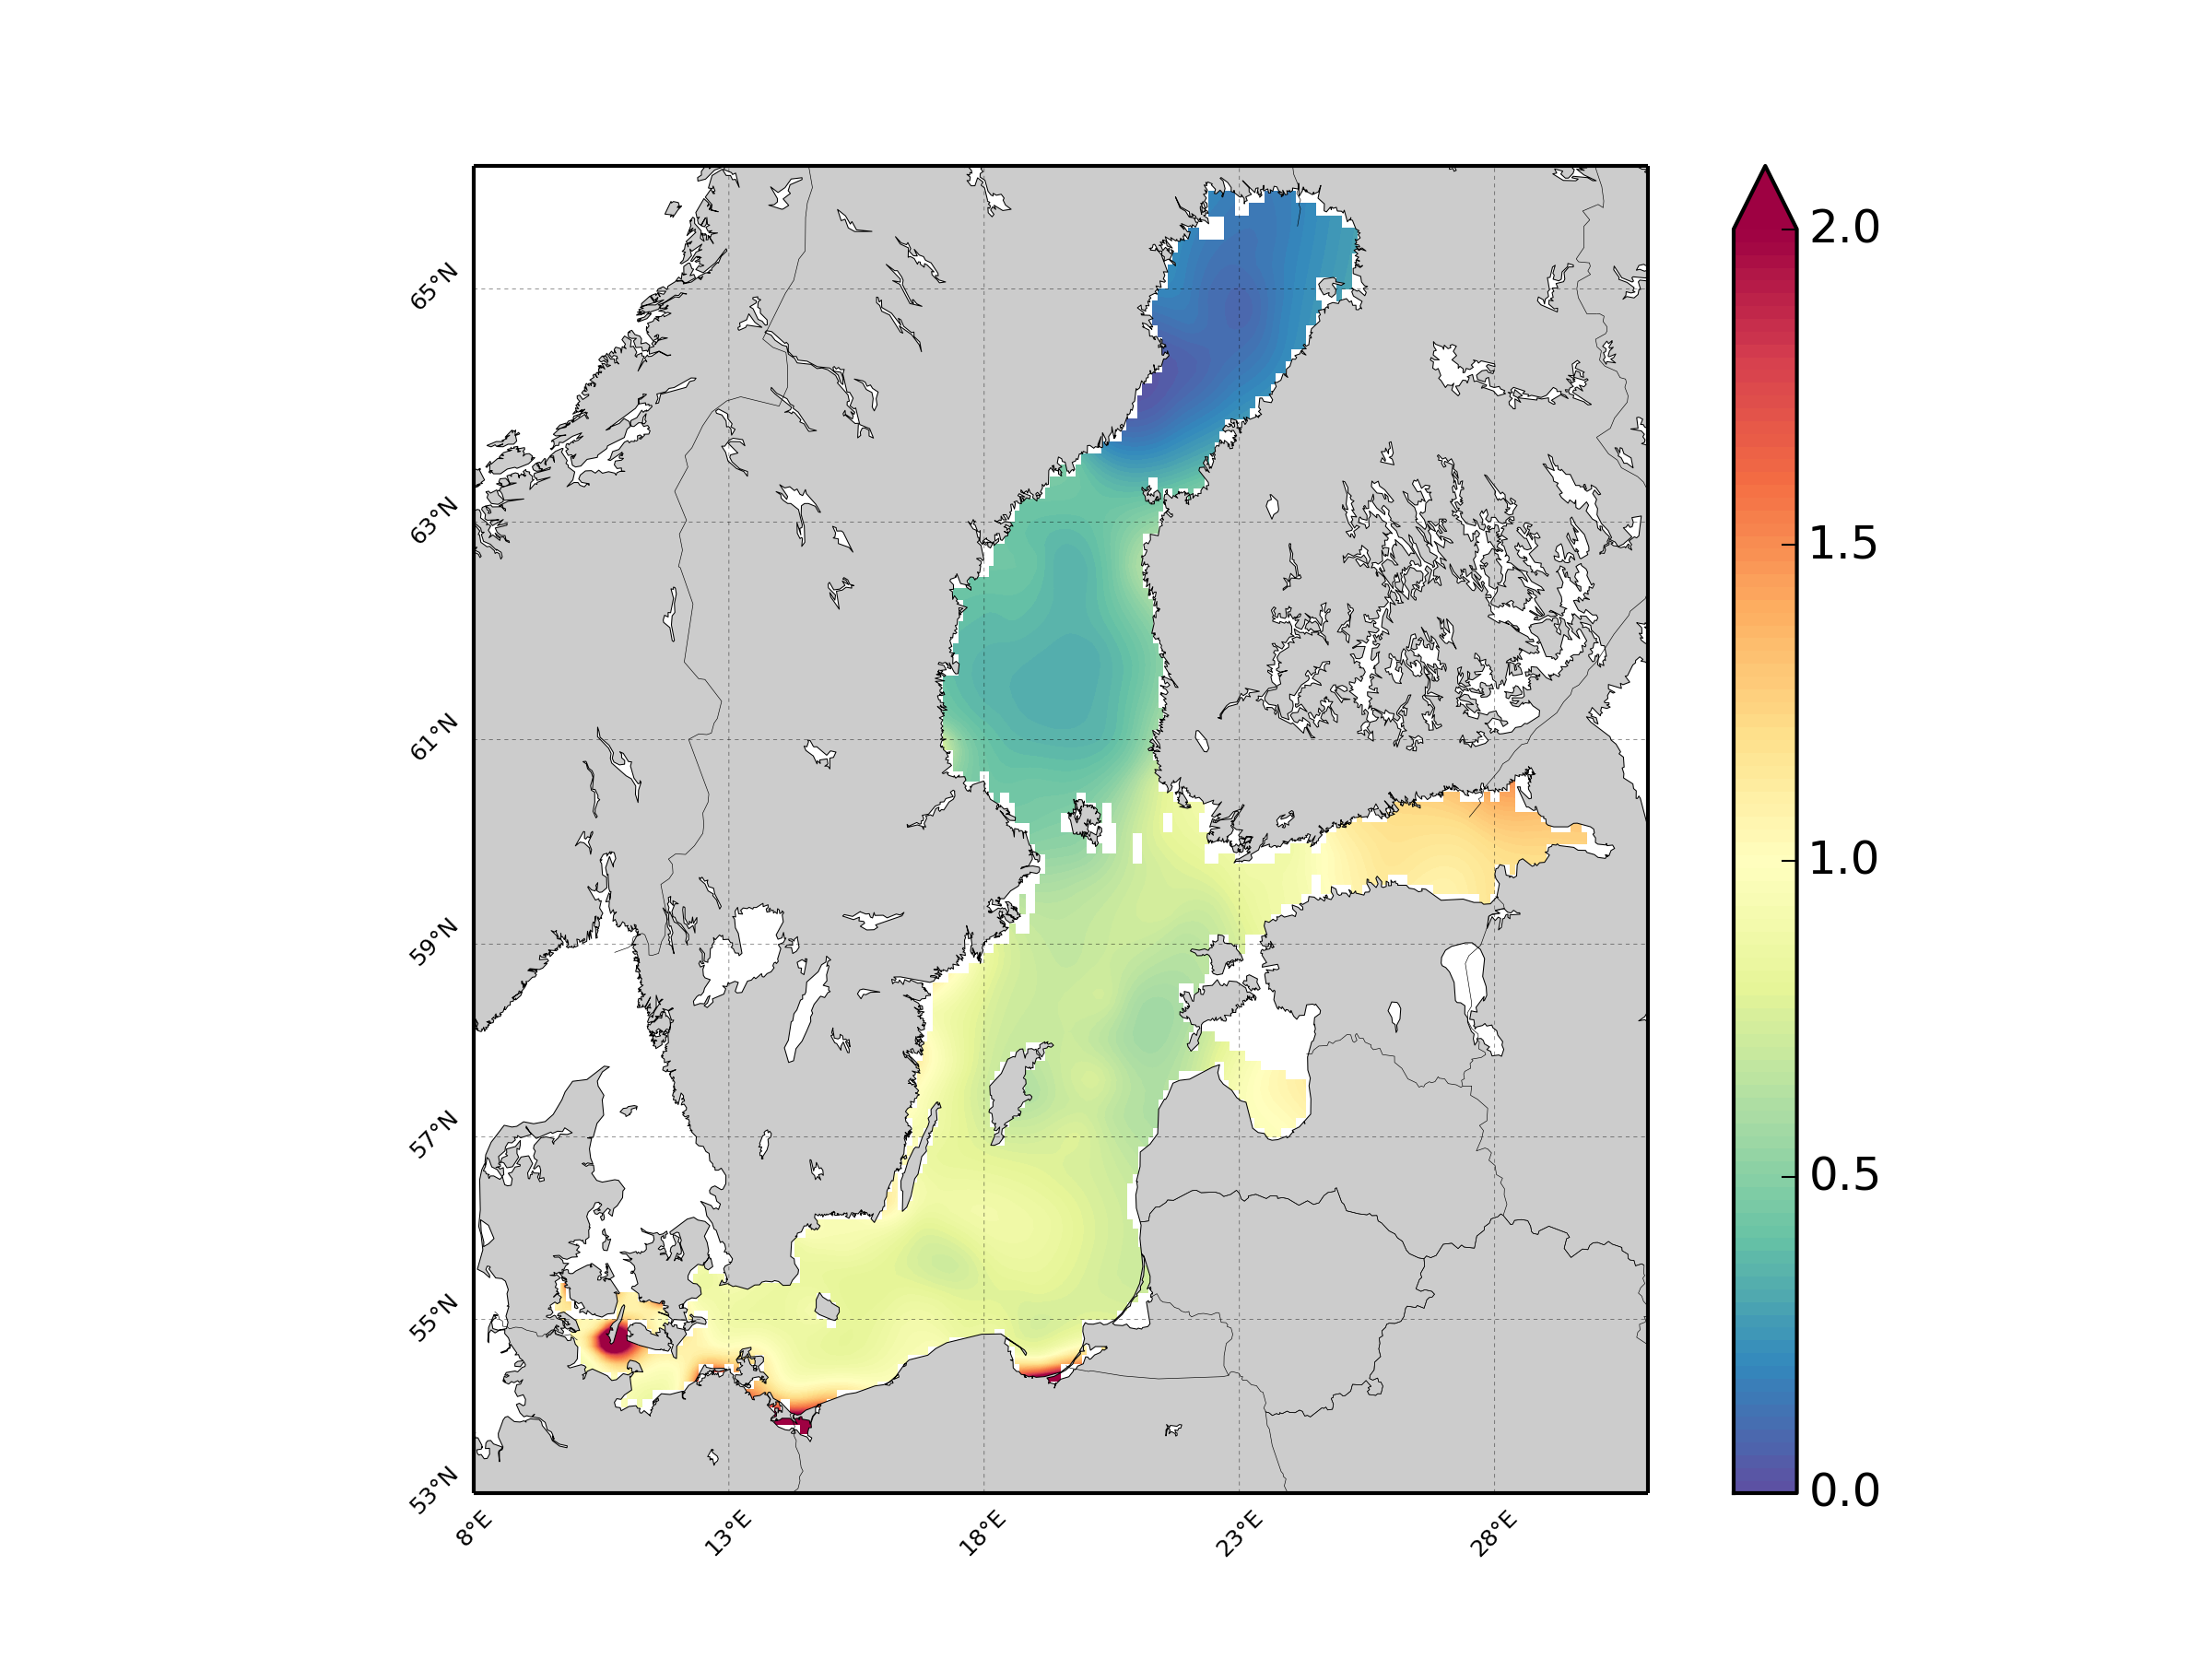
Units: umol/l. Method: spatial interpolation produced with DIVA (Data-Interpolating Variational Analysis). URL: http://modb.oce.ulg.ac.be/DIVA. Comment: Every year of the time dimension corresponds to a 10-year centred average for each season : - winter season (December-February), - spring (March-May), - summer (June-August), - autumn (September-November). Diva settings: Snr=1.0, CL=0.7.
-
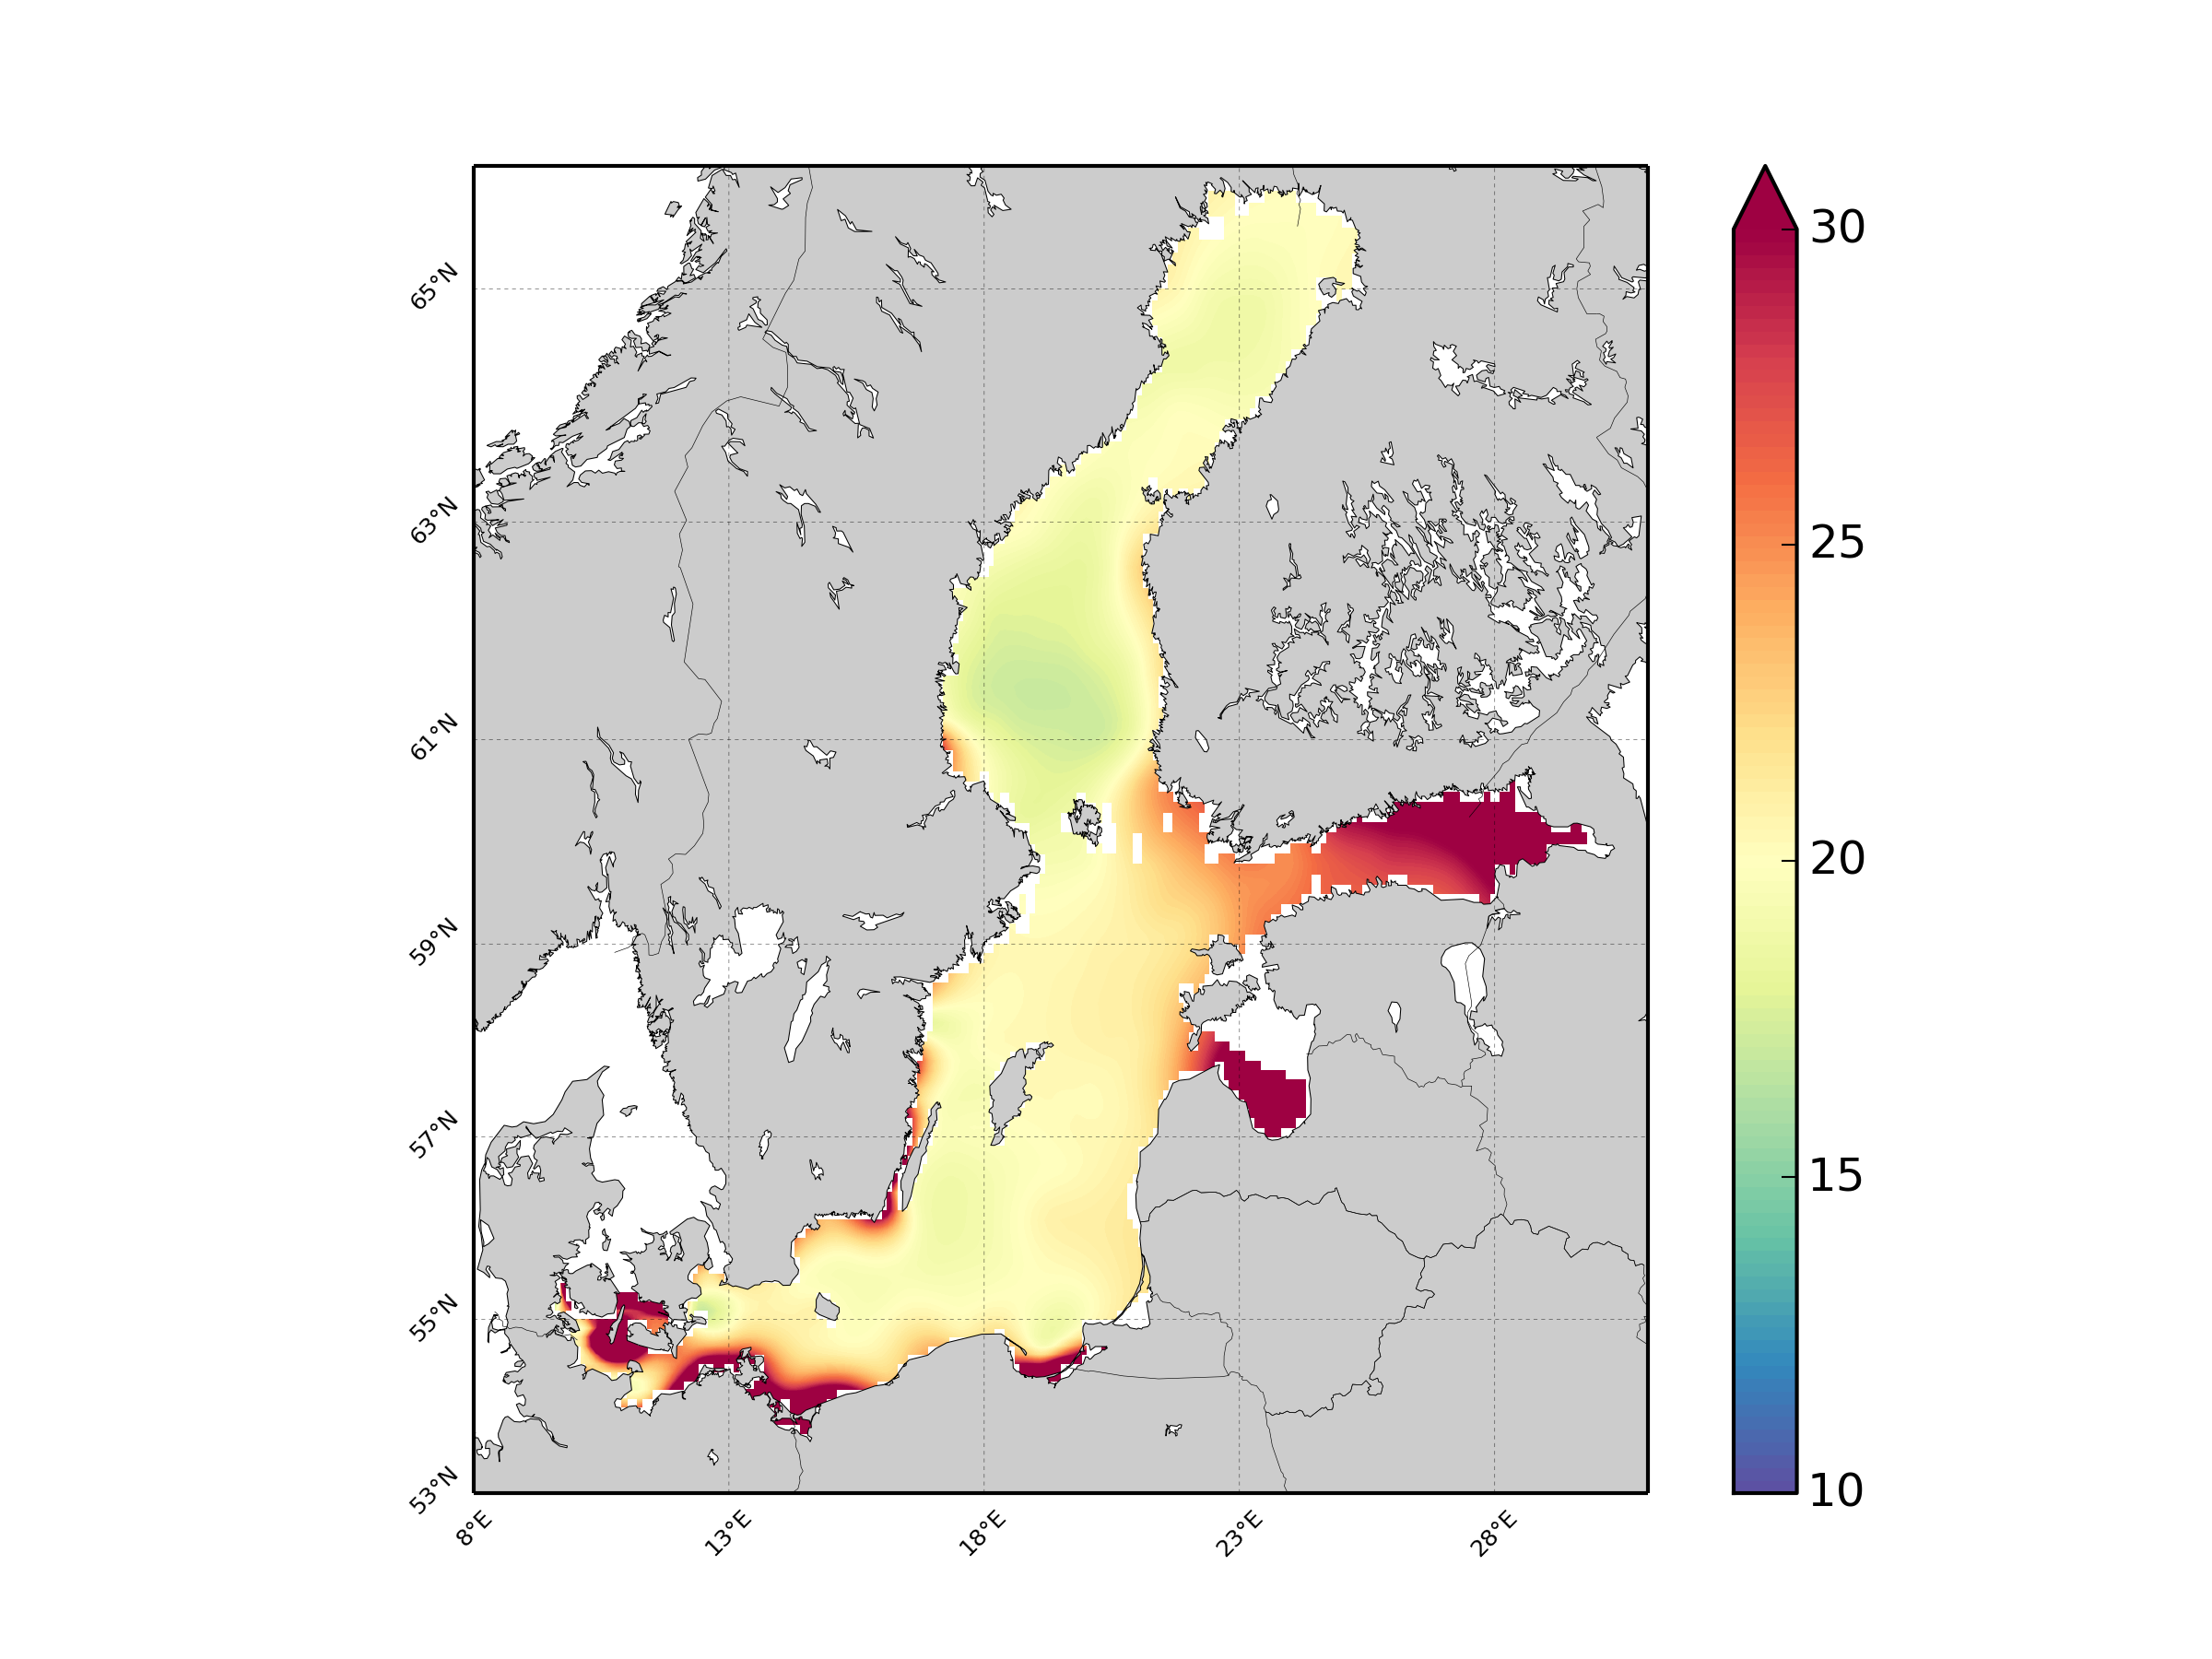
Units: umol/l. Method: spatial interpolation produced with DIVA (Data-Interpolating Variational Analysis). URL: http://modb.oce.ulg.ac.be/DIVA. Comment: Every year of the time dimension corresponds to a 10-year centred average for each season : - winter season (December-February), - spring (March-May), - summer (June-August), - autumn (September-November). Diva settings: Snr=1.0, CL=0.7
-
Units: umol/l. Method: spatial interpolation produced with DIVA (Data-Interpolating Variational Analysis). URL: http://modb.oce.ulg.ac.be/DIVA. Comment: Every year of the time dimension corresponds to a 10-year centred average for each season : - winter season (December-February), - spring (March-May), - summer (June-August), - autumn (September-November). Diva settings: Snr=1.0, CL=0.7.
-
EMODnet Chemistry aims to provide access to marine chemistry data sets and derived data products concerning eutrophication, ocean acidification and contaminants. The chemicals chosen reflect importance to the Marine Strategy Framework Directive (MSFD). This regional aggregated dataset contains all unrestricted EMODnet Chemistry data on contaminants (49 parameters), and covers the Baltic Sea with 3818 CDI records divided per matrices: 1358 biota (396 Vertical profiles and 962 Time series),906 water profiles, 2510 sediment profiles. Vertical profiles temporal range is from 1985-04-16 to 2016-09-27. Time series temporal range is from 1972-05-02 to 2017-10-30. Data were aggregated and quality controlled by ‘Swedish Meteorological and Hydrological Institute (SMHI)’ from Sweden. Regional datasets concerning contaminants are automatically harvested. Parameter names in these datasets are based on P01, BODC Parameter Usage Vocabulary, which is available at: http://seadatanet.maris2.nl/bandit/browse_step.php . Each measurement value has a quality flag indicator. The resulting data collections for each Sea Basin are harmonised, and the collections are quality controlled by EMODnet Chemistry Regional Leaders using ODV Software and following a common methodology for all Sea Regions. Harmonisation means that: (1) unit conversion is carried out to express contaminant concentrations with a limited set of measurement units (according to EU directives 2013/39/UE; Comm. Dec. EU 2017/848) and (2) merging of variables described by different “local names” ,but corresponding exactly to the same concepts in BODC P01 vocabulary. The harmonised dataset can be downloaded as ODV spreadsheet (TXT file), which is composed of metadata header followed by tab separated values. This worksheet can be imported to ODV Software for visualisation (More information can be found at: https://www.seadatanet.org/Software/ODV ). The same dataset is offered also as XLSX file in a long/vertical format, in which each P01 measurement is a record line. Additionally, there are a series of columns that split P01 terms in subcomponents (measure, substance, CAS number, matrix...).This transposed format is more adapted to worksheet applications users (e.g. LibreOffice Calc). The 49 parameter names in this metadata record are based on P02, SeaDataNet Parameter Discovery Vocabulary, which is available at: http://seadatanet.maris2.nl/v_bodc_vocab_v2/vocab_relations.asp?lib=P02 . Detailed documentation will be published soon. The original datasets can be searched and downloaded from EMODnet Chemistry Download Service: https://emodnet-chemistry.maris.nl/search
-
Tallink ship Victoria I, with ferrybox system mounted onboard, is traveling (since end of 2023) regularly between Tallinn and Helsinki was appointed for summer of 2024 to Tallinn Mariehamn Stockholm line. During that period there were also some cruises to Visby (starting from Tallinn and via Helsinki).
-
The dataset includes continuous velocity, direction, and depth measurements in 9 fixed locations (3x3 grid) in the Gulf of Riga, Baltic Sea. It is a space-time-aligned dataset of continuous velocity, direction, and depth measurements near Skulte, the Gulf of Riga, Baltic Sea (Eelsalu et al. 2025, Proceedings of the Estonian Academy of Sciences). All sensors measured 0.4m from the bottom of the sea. The measurements are done using a Hall effect sensor-based velocity profiler called Hydromast (Egerer et al. 2024, IEEE sensors). The minimum velocity provided in this dataset is 0.12m/s, validated with ADV. If the velocity is under this threshold, the velocity and direction read NaN. The depth and temperature measurements are valid at all times.
-
Dataset gives a baseline for micro- and mesoplastic pollution distribution in 24 beaches along the Latvian coastline (Northern Europe, Baltic states), filling the existing knowledge gap and contributing to the global understanding of microplastic particles presence, transport, and the processes governing its dynamics. We also highlight citizen science as a fundamental tool to support data collection and raise awareness about microplastic pollution, as samples were collected by up to 250 volunteers during organized campaigns (Dimante-Deimantovica et al. 2023).