 EMODnet Product Catalogue
Taurida V.I. Vernadsky National University
Type of resources
Available actions
Topics
Keywords
Contact for the resource
Provided by
Years
Formats
Representation types
Scale 1:
Resolution
-
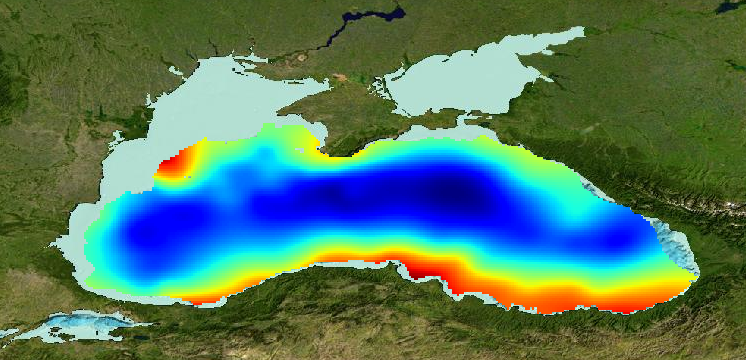
Gridded product for visualization of Water body dissolved oxygen concentration in the Black Sea generated by DIVA 4.6.11 using all EMODNET Chemistry data from 1970 to 2014. Depth range (IODE standard depths): 0 – 250m. DIVA settings: signal-to-noise ratio and correlation length were estimated using data mean distance as a minimum (for L), and both parameters vertically filtered. Background field: the data mean value is subtracted from the data. Detrending of data: no. Advection constraint applied: no. Every year of the time dimension corresponds to a 10-year centred average for each season: - winter: December - February, - spring: March - May, - summer: June - August, - autumn: September – November Units: umol/l
-
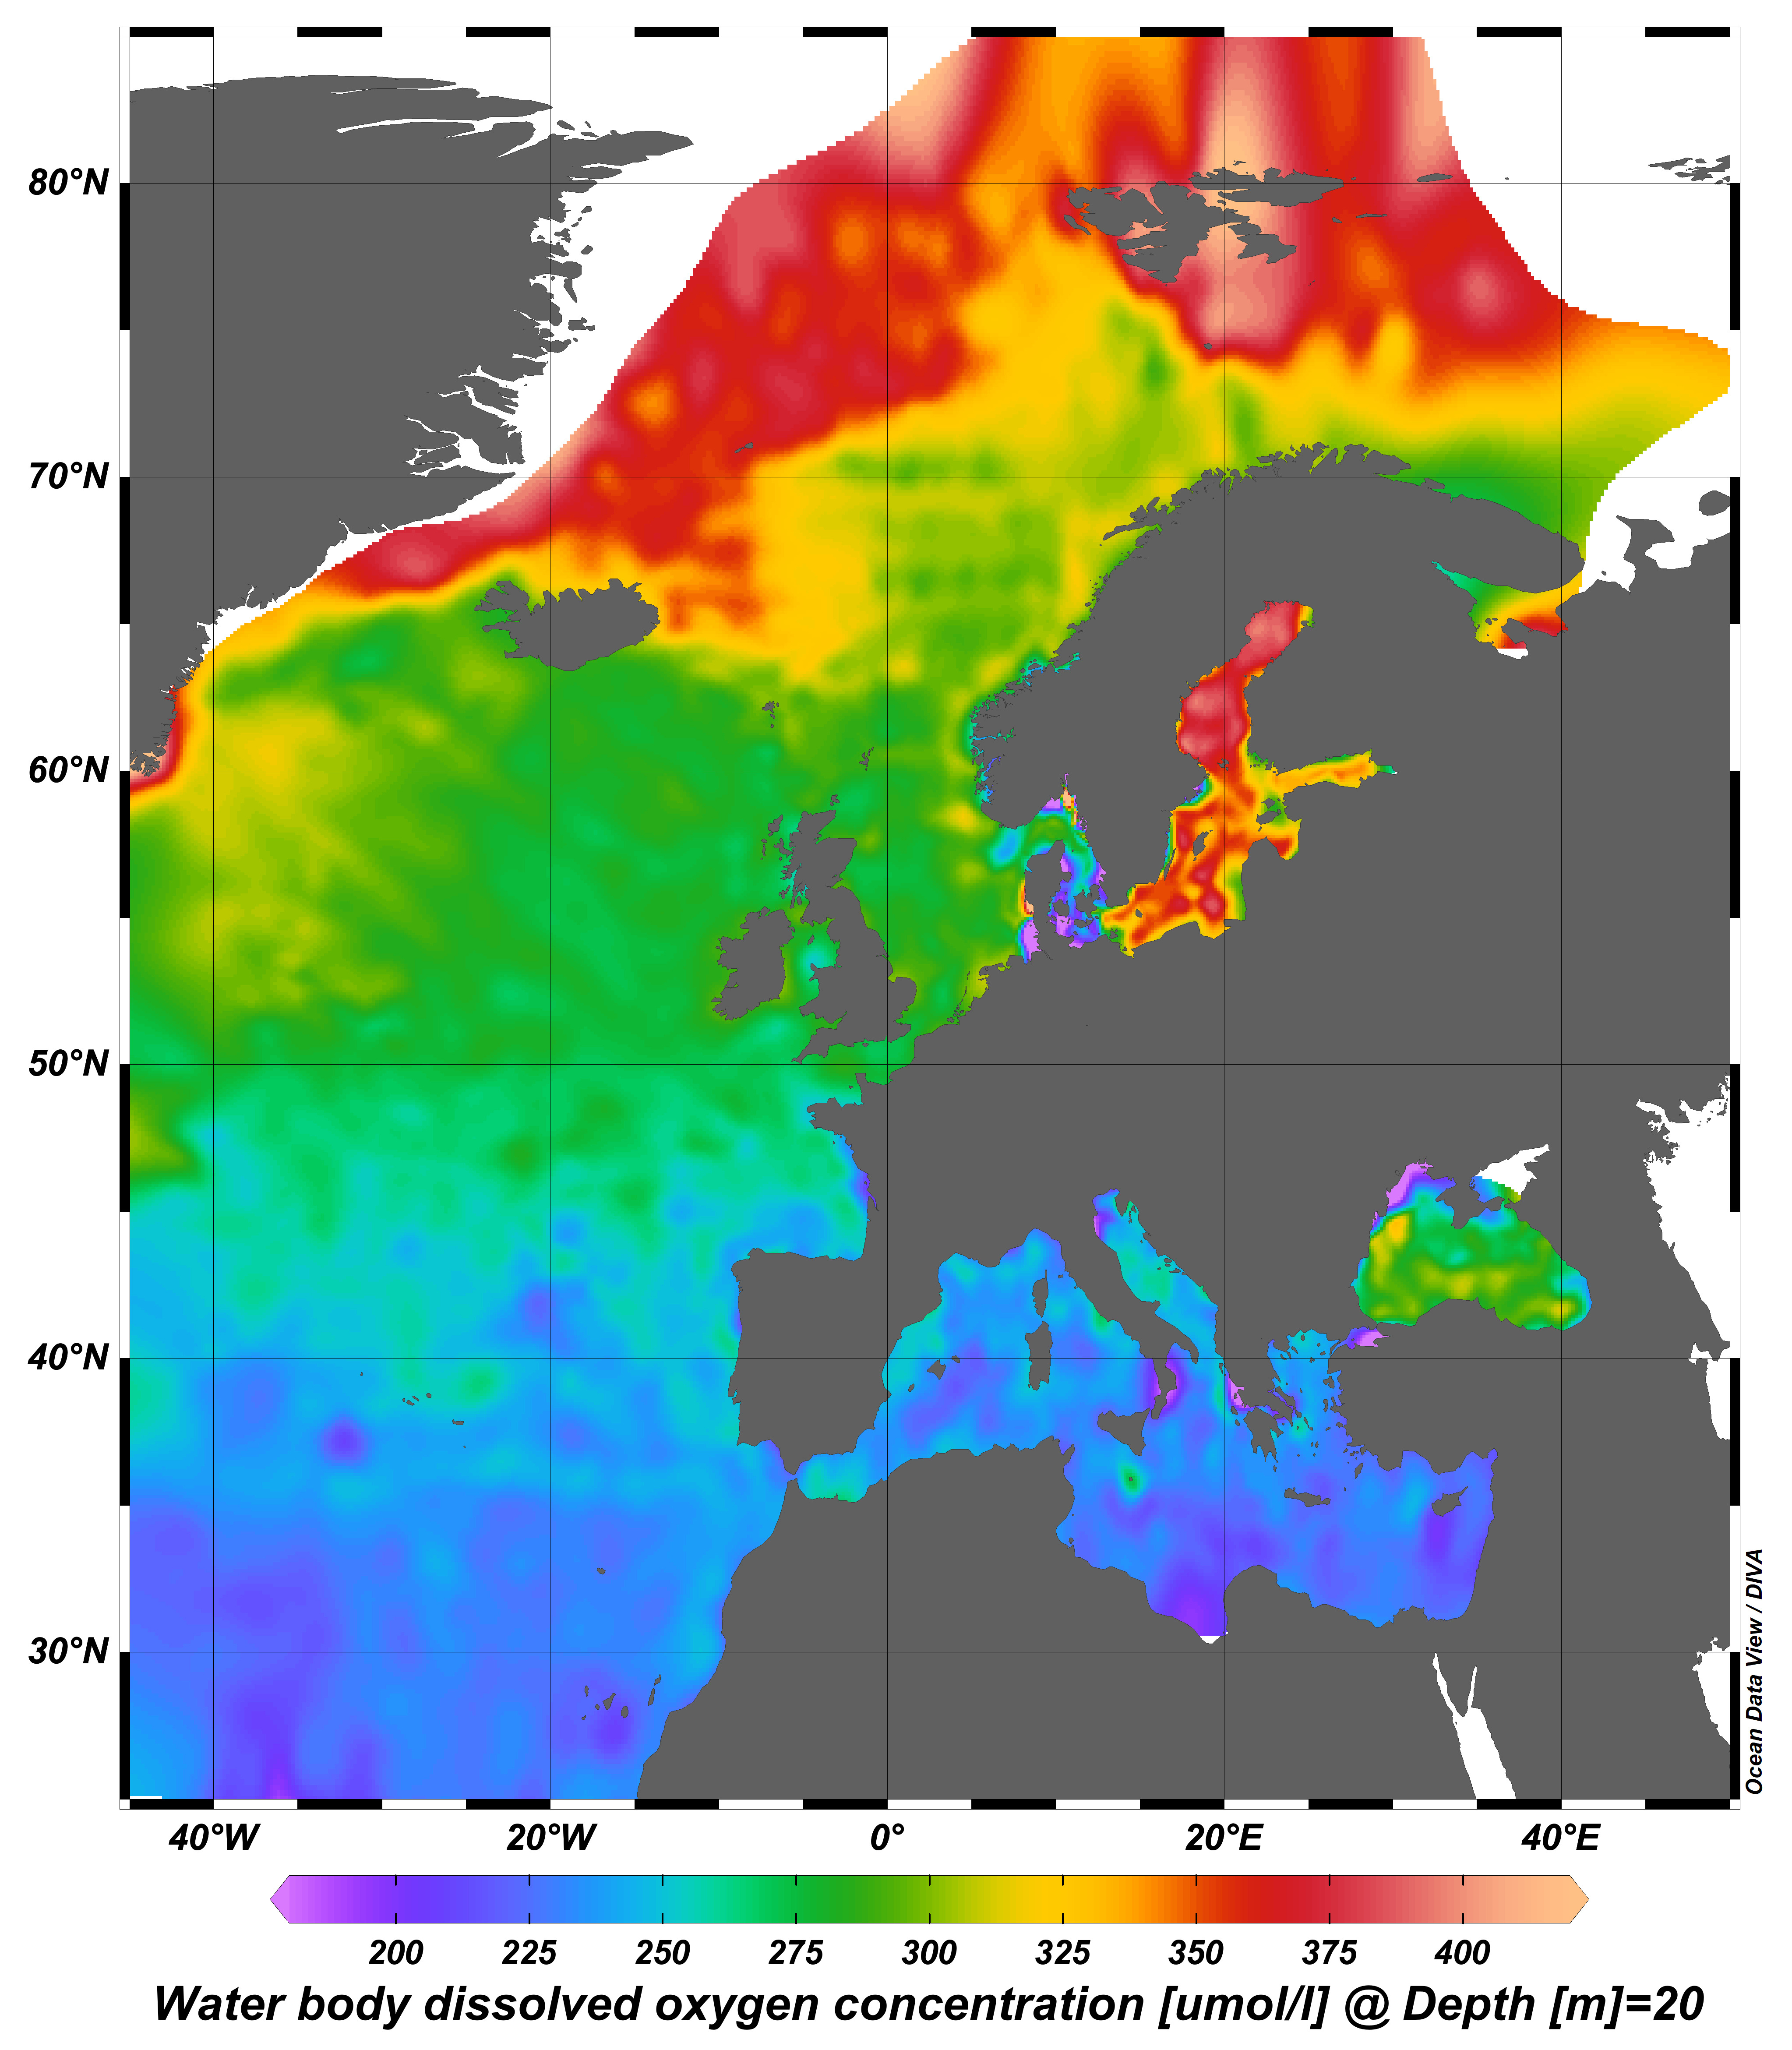
webODV visualisations via WMS from the harmonized, standardized, validated data collections that EMODnet Chemistry is regularly producing and publishing for all European sea basins for eutrophication and contaminants. You can analyze, visualize, subset and download EMODnet Chemistry data using interactive webODV services. More information at: https://emodnet.ec.europa.eu/en/chemistry#chemistry-services
-
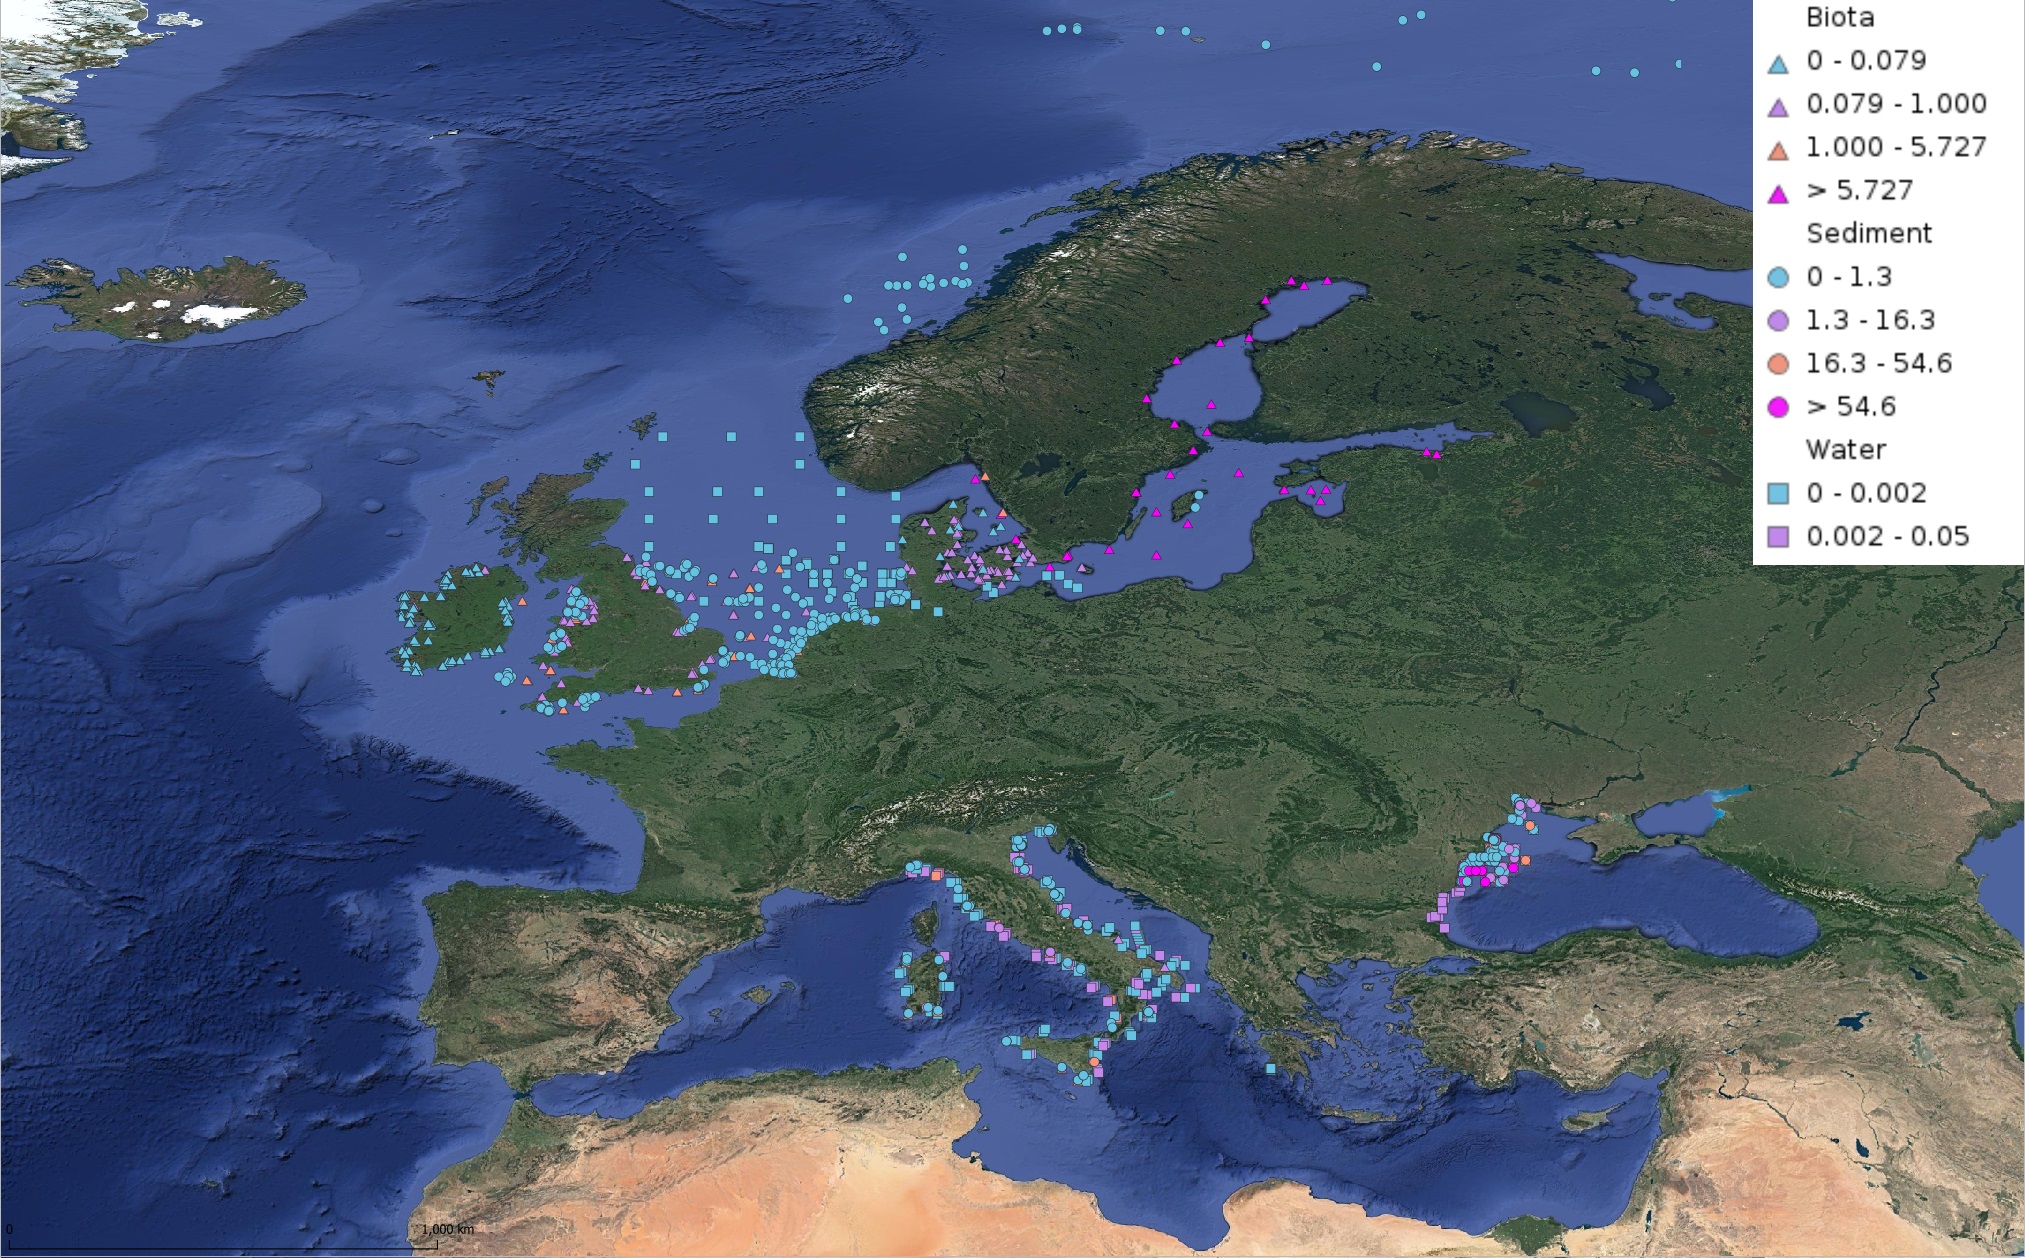
This product displays for Hexachlorobenzene, median values of the last 6 available years that have been measured per matrix and are present in EMODnet validated datasets. The median values ranges are derived from the following percentiles: 0-25%, 25-75%, 75-90%, >90%. Only "good data" are used, namely data with Quality Flag=1, 2, 6, Q (SeaDataNet Quality Flag schema). For water, only surface values are used (0-15 m), for sediment and biota data at all depths are used.
-
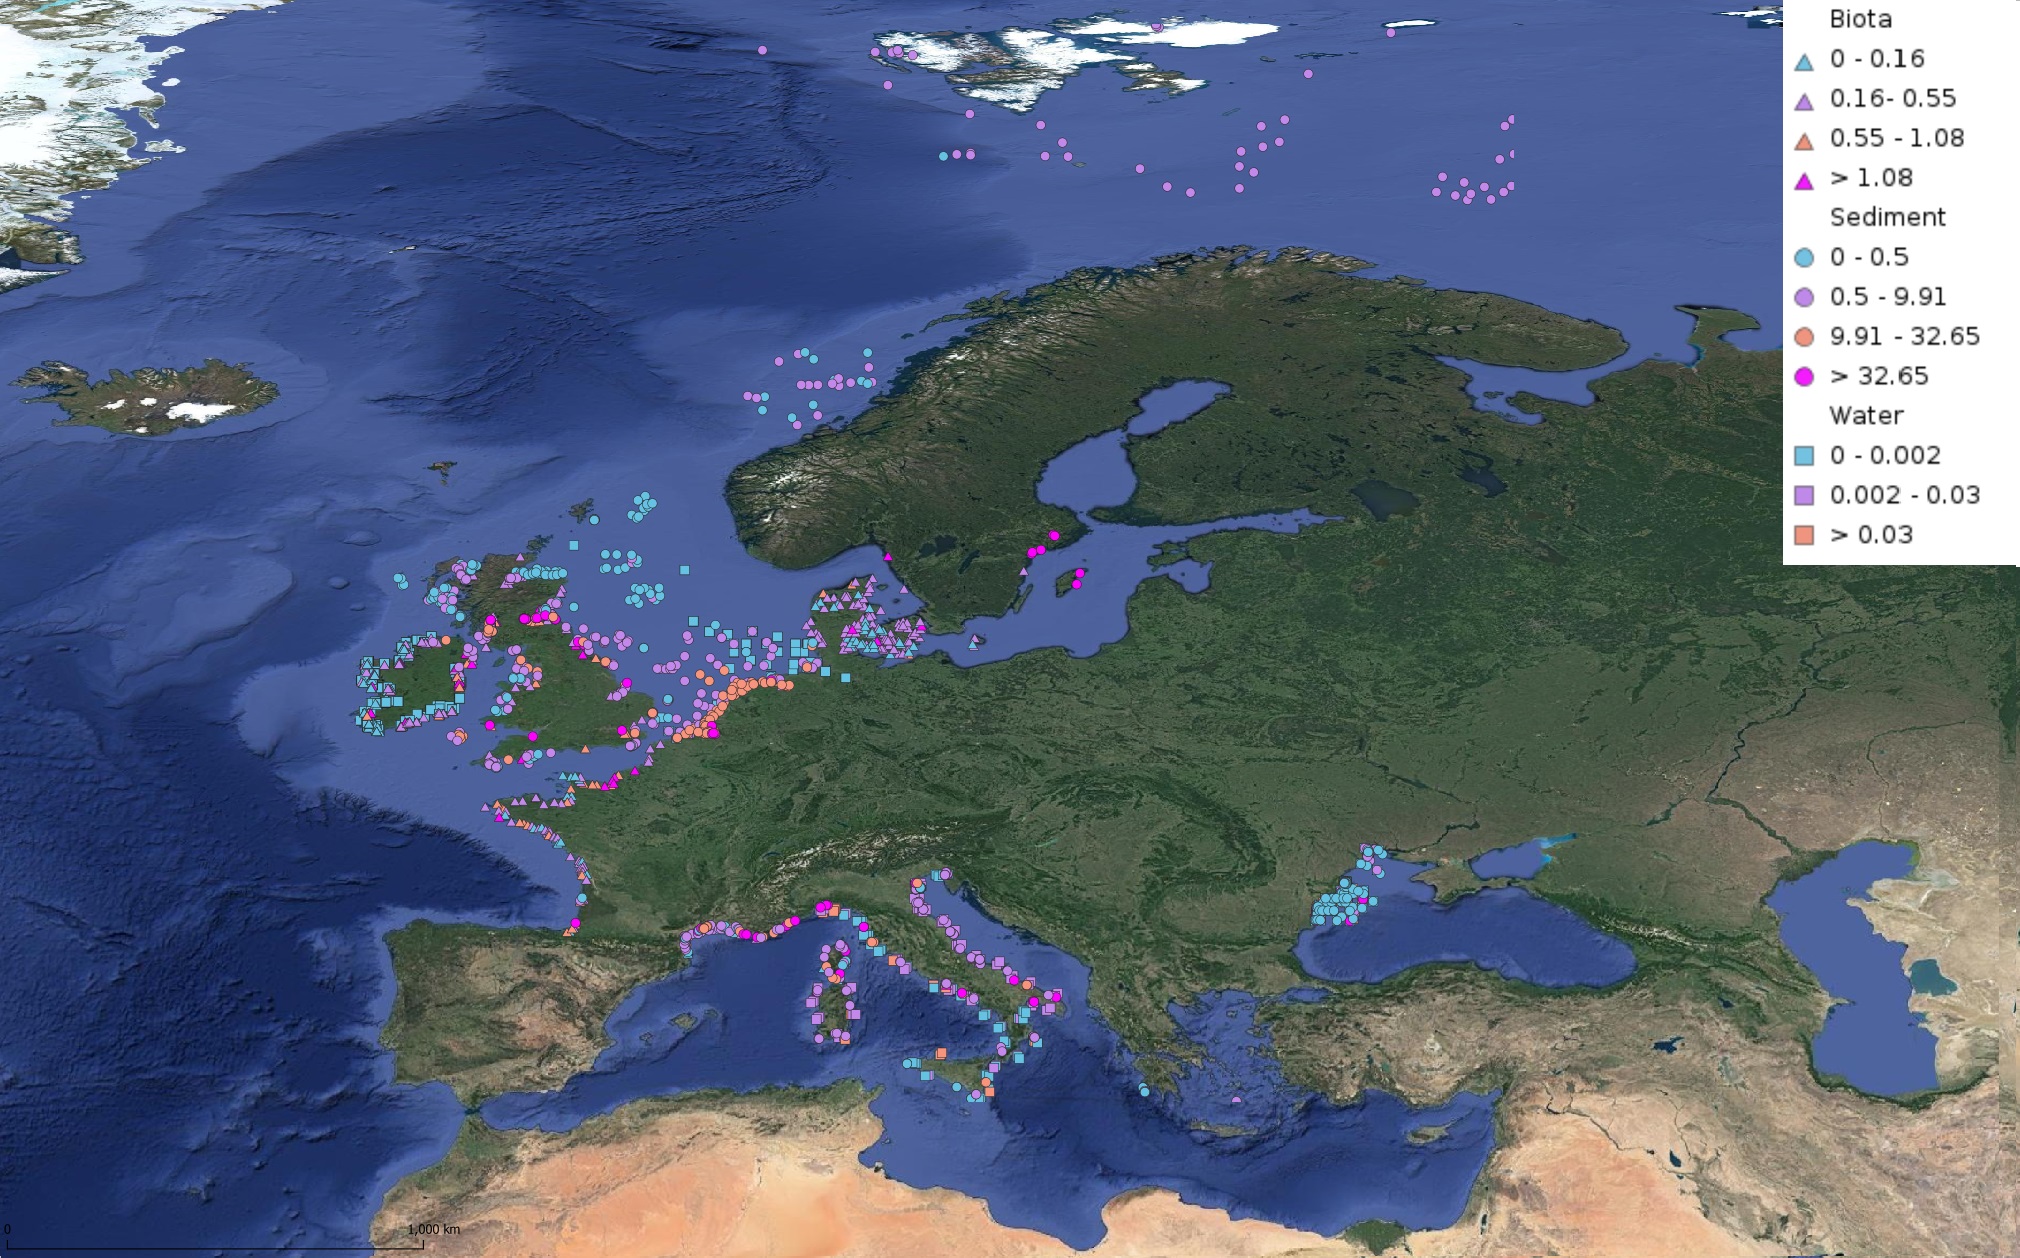
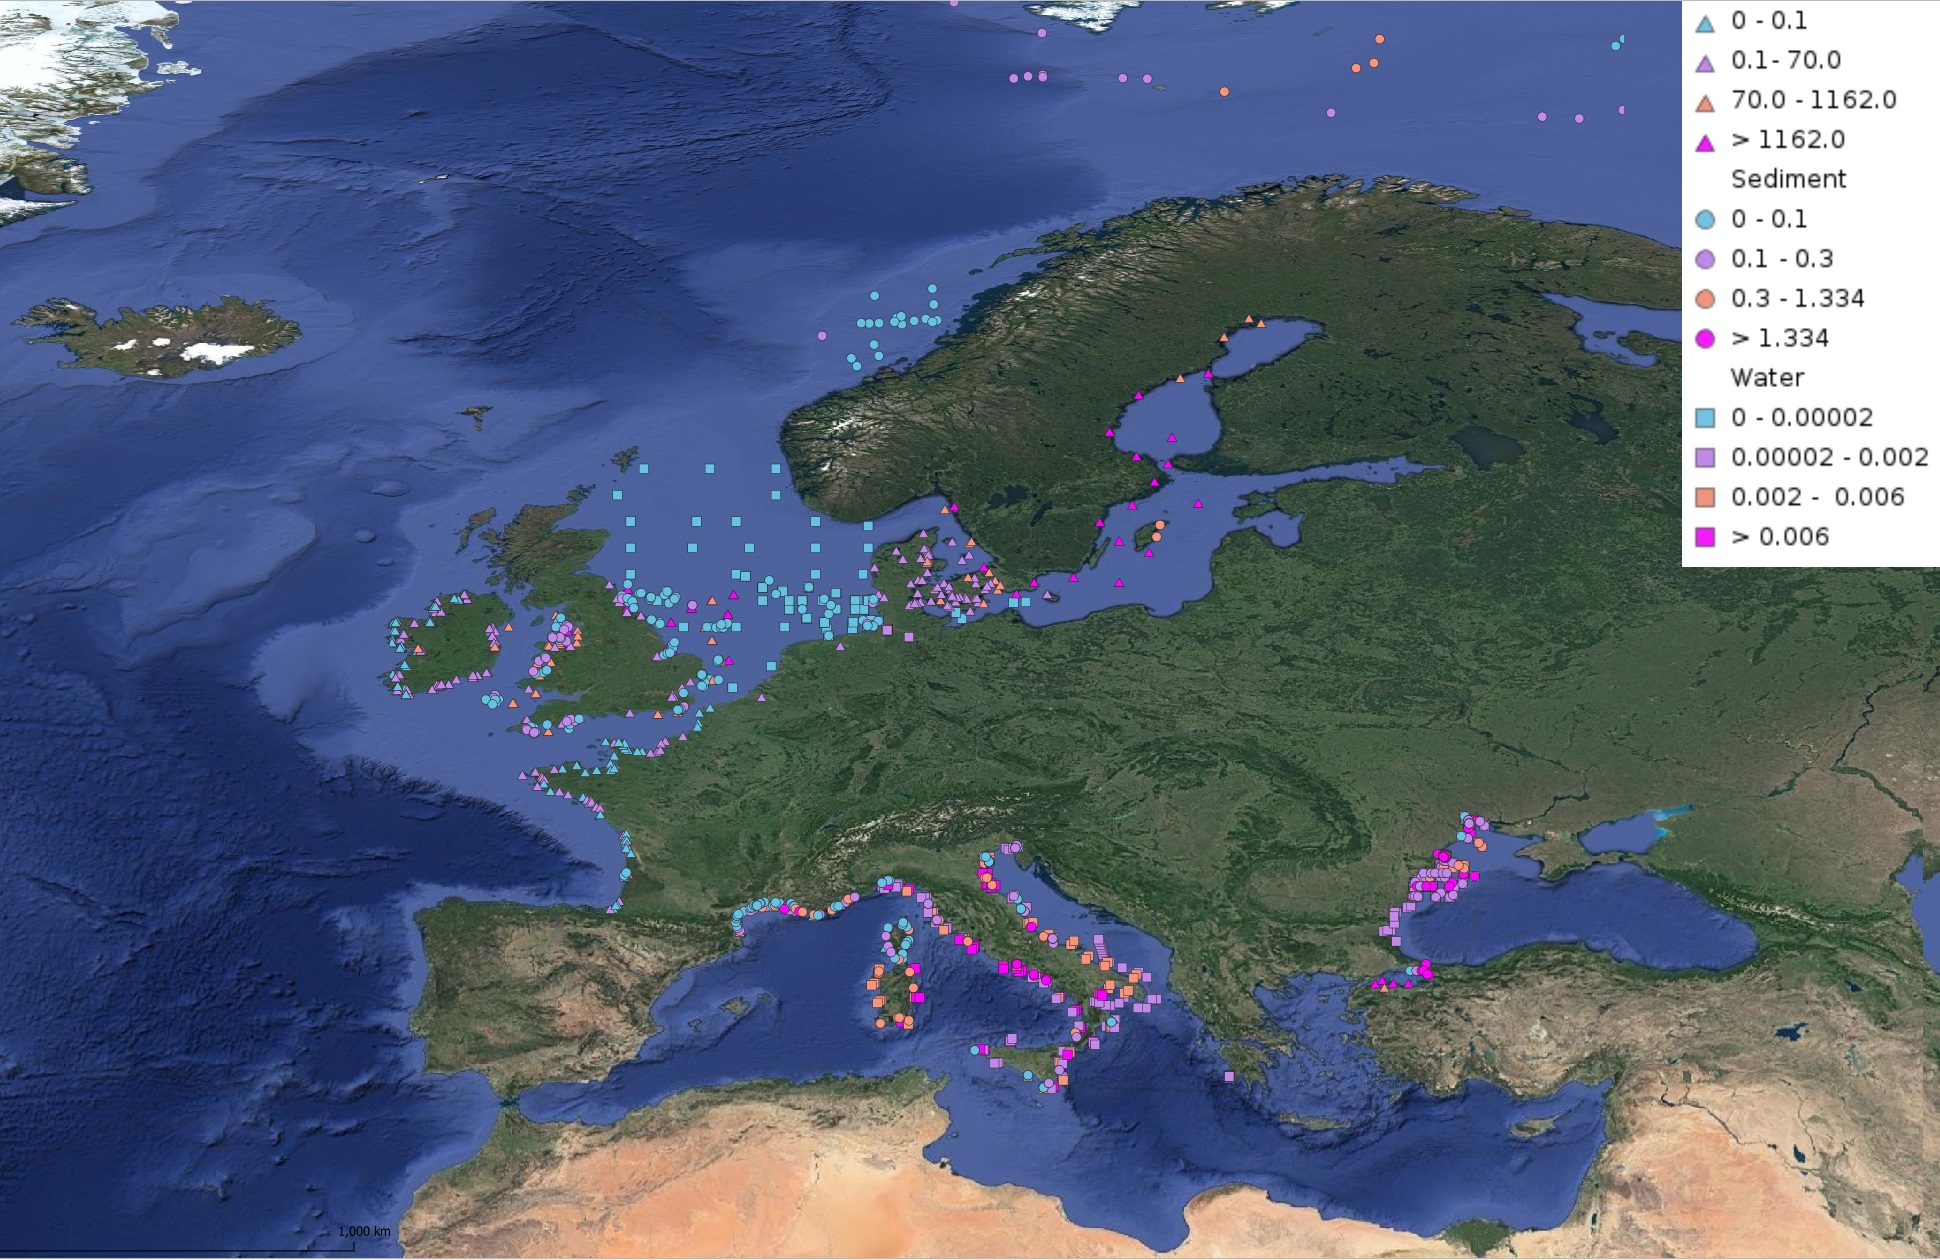
This product displays for Anthracene, median values of the last 6 available years that have been measured per matrix and are present in EMODnet validated datasets. The median values ranges are derived from the following percentiles: 0-25%, 25-75%, 75-90%, >90%. Only "good data" are used, namely data with Quality Flag=1, 2, 6, Q (SeaDataNet Quality Flag schema). For water, only surface values are used (0-15 m), for sediment and biota data at all depths are used.
-
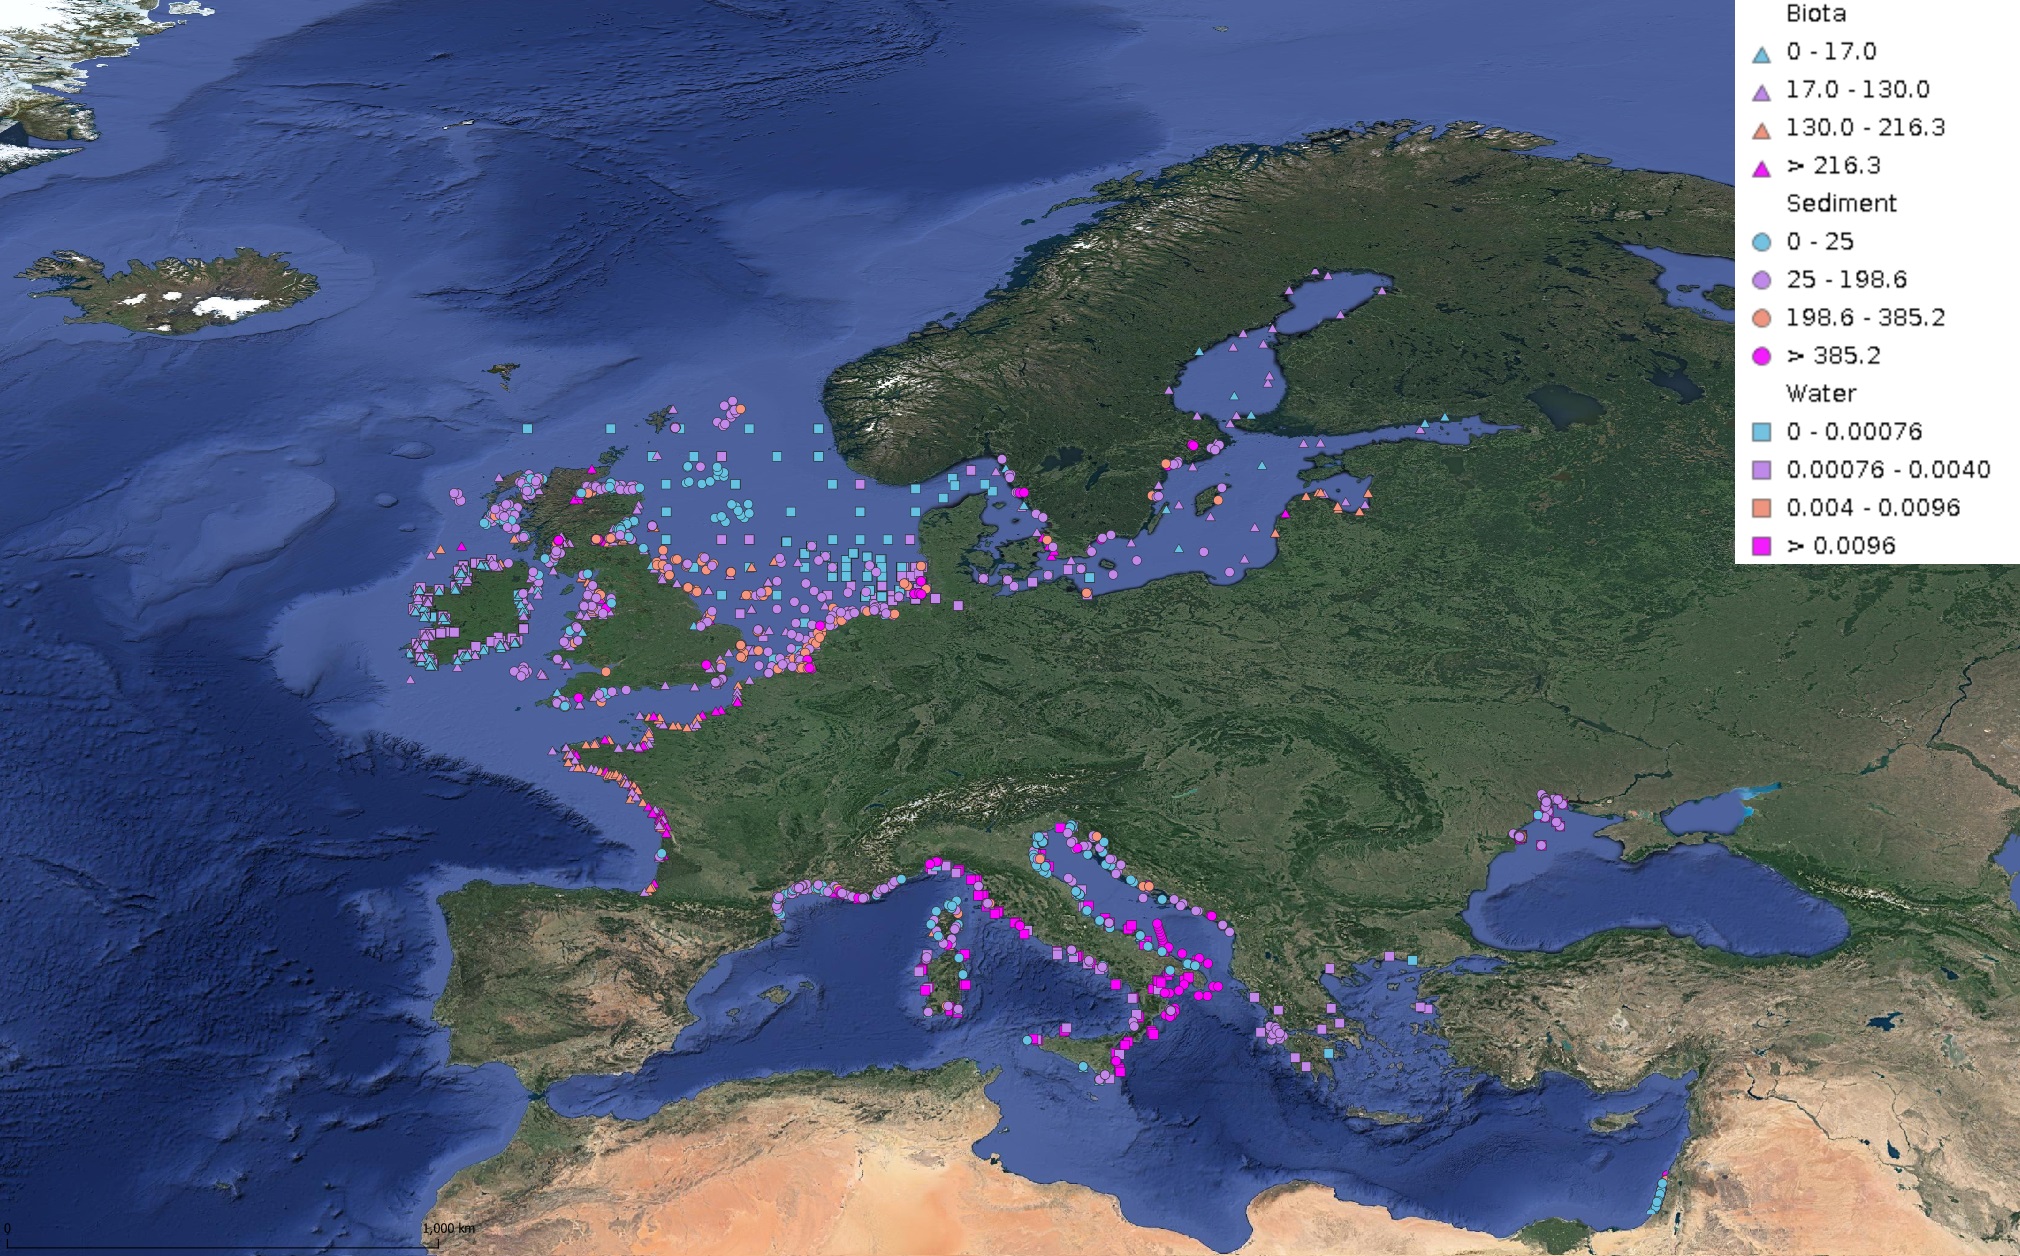
This product displays for Fluoranthene, median values of the last 6 available years that have been measured per matrix and are present in EMODnet validated datasets. The median values ranges are derived from the following percentiles: 0-25%, 25-75%, 75-90%, >90%. Only "good data" are used, namely data with Quality Flag=1, 2, 6, Q (SeaDataNet Quality Flag schema). For water, only surface values are used (0-15 m), for sediment and biota data at all depths are used.
-
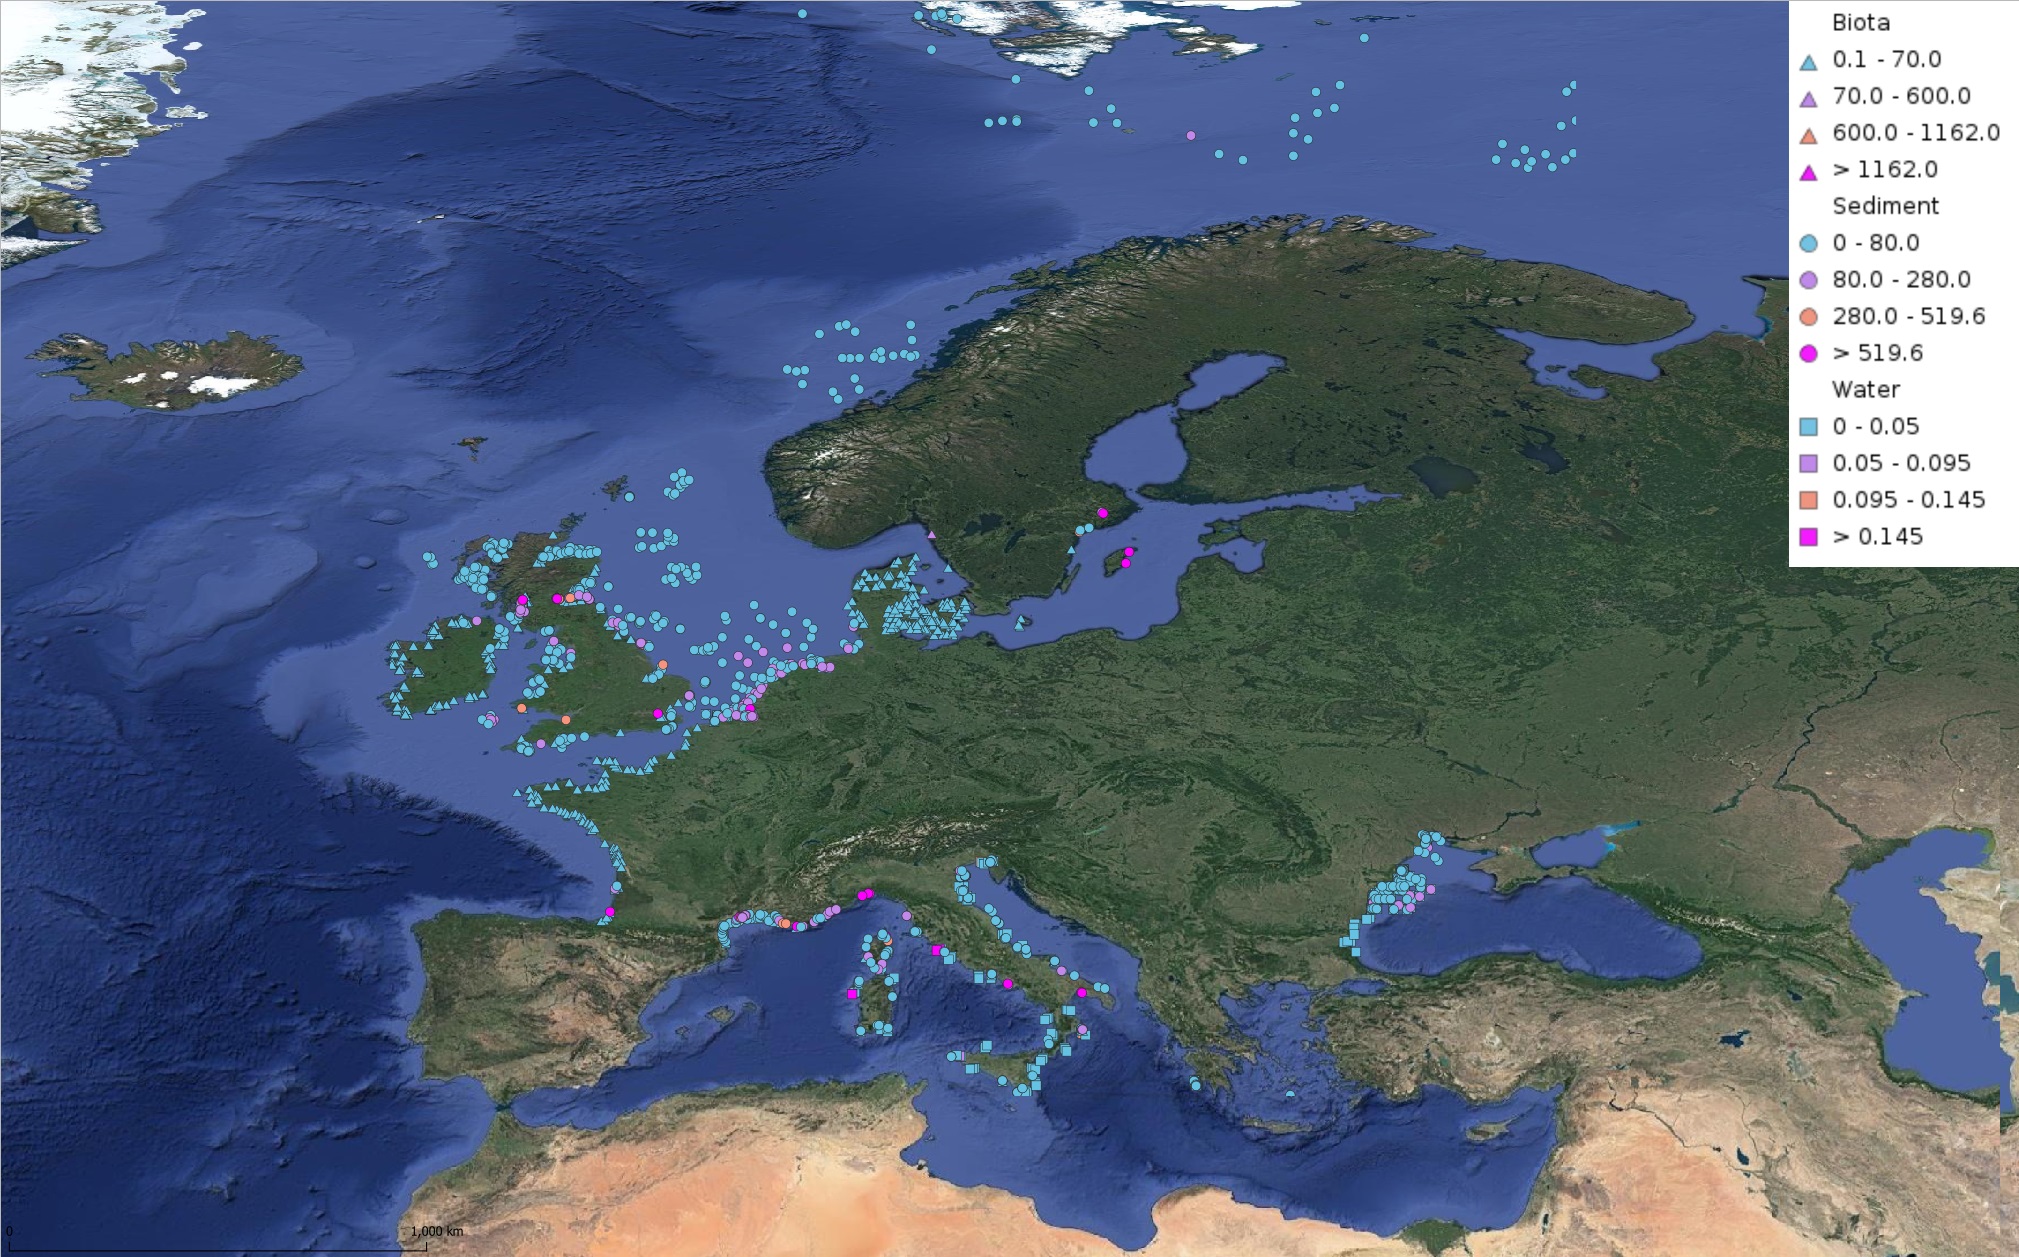
This product displays for Mercury, median values of the last 6 available years that have been measured per matrix and are present in EMODnet validated datasets. The median values ranges are derived from the following percentiles: 0-25%, 25-75%, 75-90%, >90%. Only "good data" are used, namely data with Quality Flag=1, 2, 6, Q (SeaDataNet Quality Flag schema). For water, only surface values are used (0-15 m), for sediment and biota data at all depths are used.
-
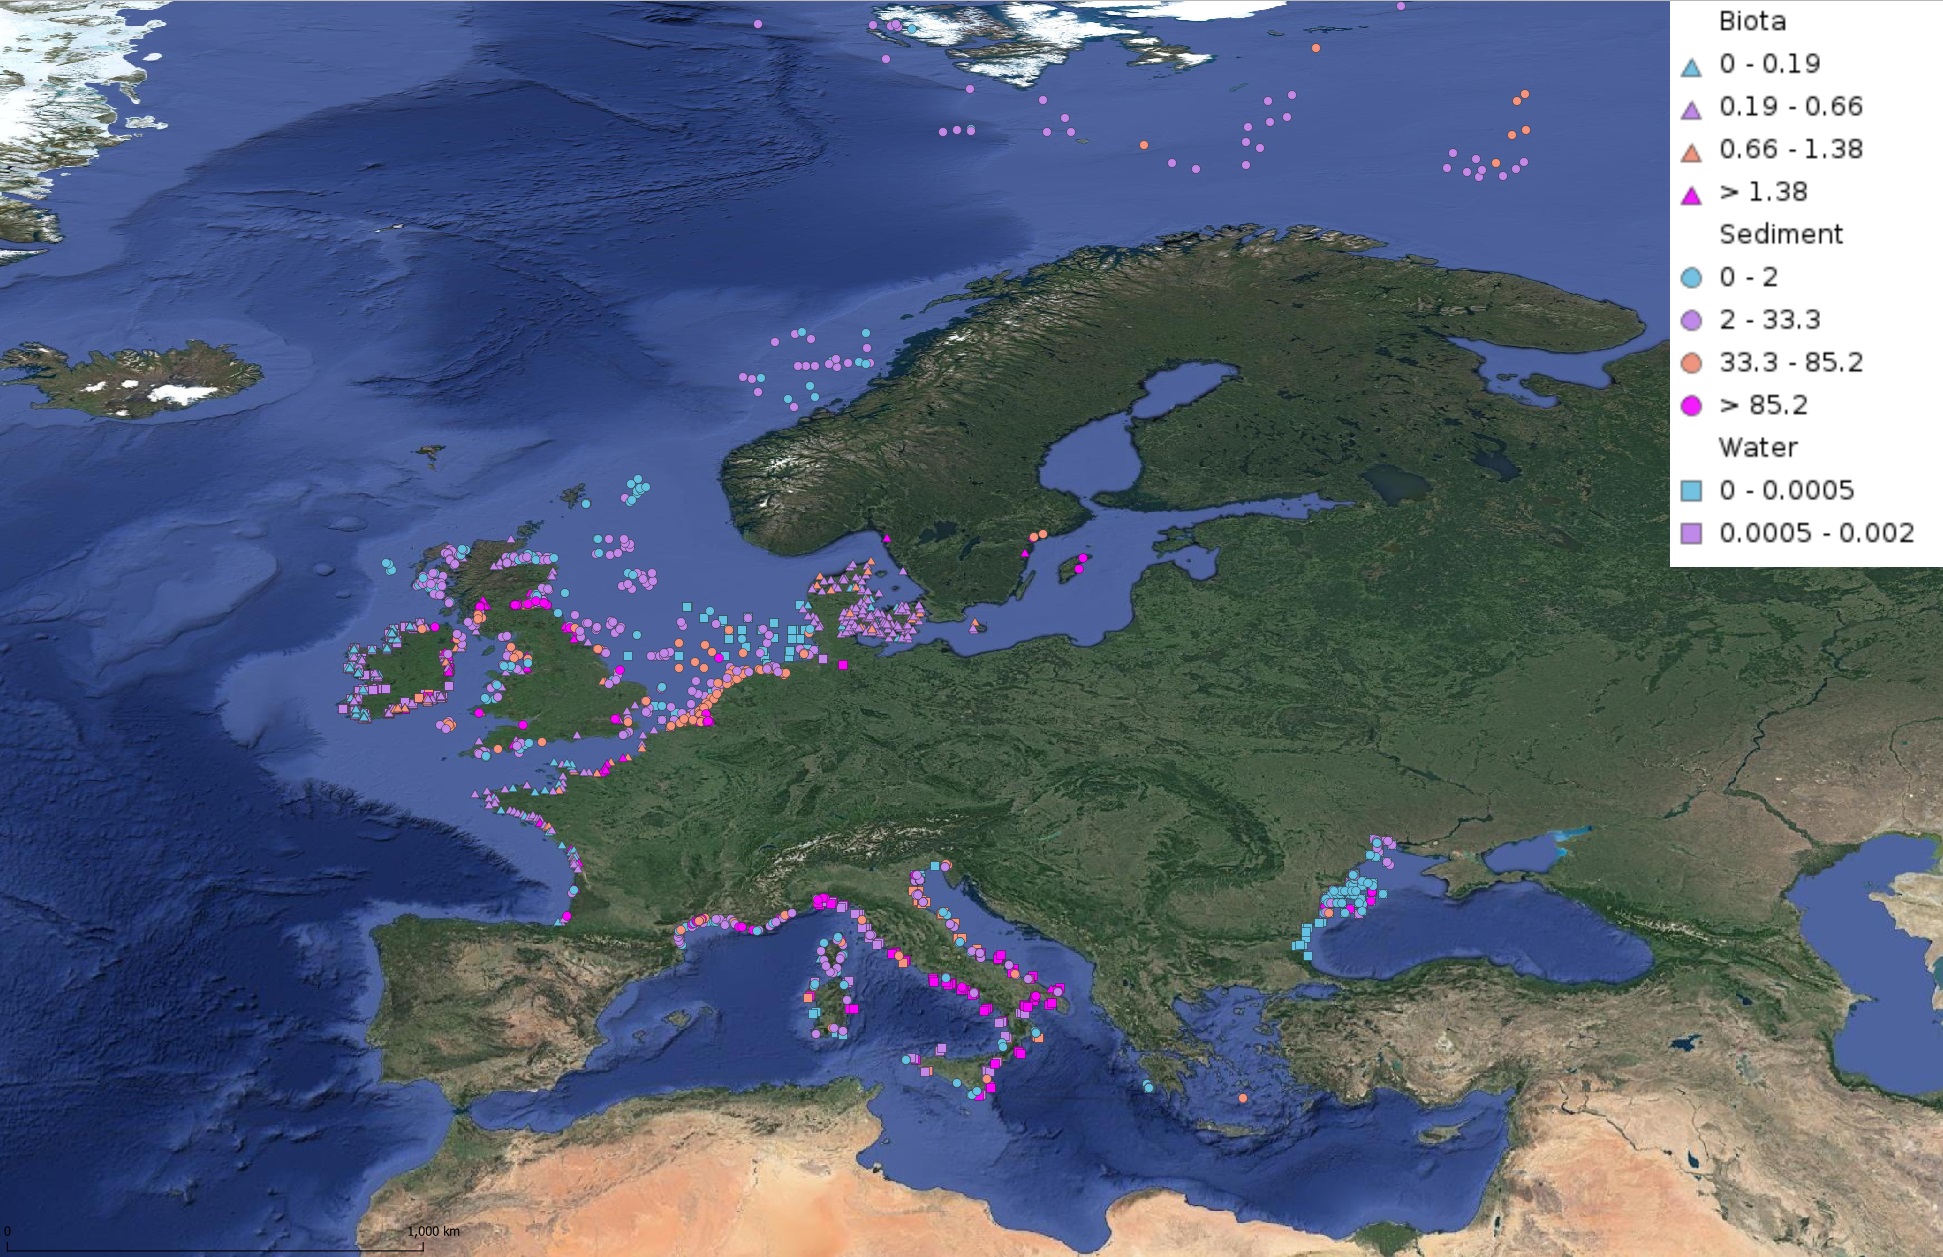
This product displays for Benzo(a)pyrene, median values of the last 6 available years that have been measured per matrix and are present in EMODnet validated datasets. The median values ranges are derived from the following percentiles: 0-25%, 25-75%, 75-90%, >90%. Only "good data" are used, namely data with Quality Flag=1, 2, 6, Q (SeaDataNet Quality Flag schema). For water, only surface values are used (0-15 m), for sediment and biota data at all depths are used.
-
This product displays for DDT, DDE, and DDD, median values of the last 6 available years that have been measured per matrix and are present in EMODnet validated datasets. The median values ranges are derived from the following percentiles: 0-25%, 25-75%, 75-90%, >90%. Only "good data" are used, namely data with Quality Flag=1, 2, 6, Q (SeaDataNet Quality Flag schema). For water, only surface values are used (0-15 m), for sediment and biota data at all depths are used.
-
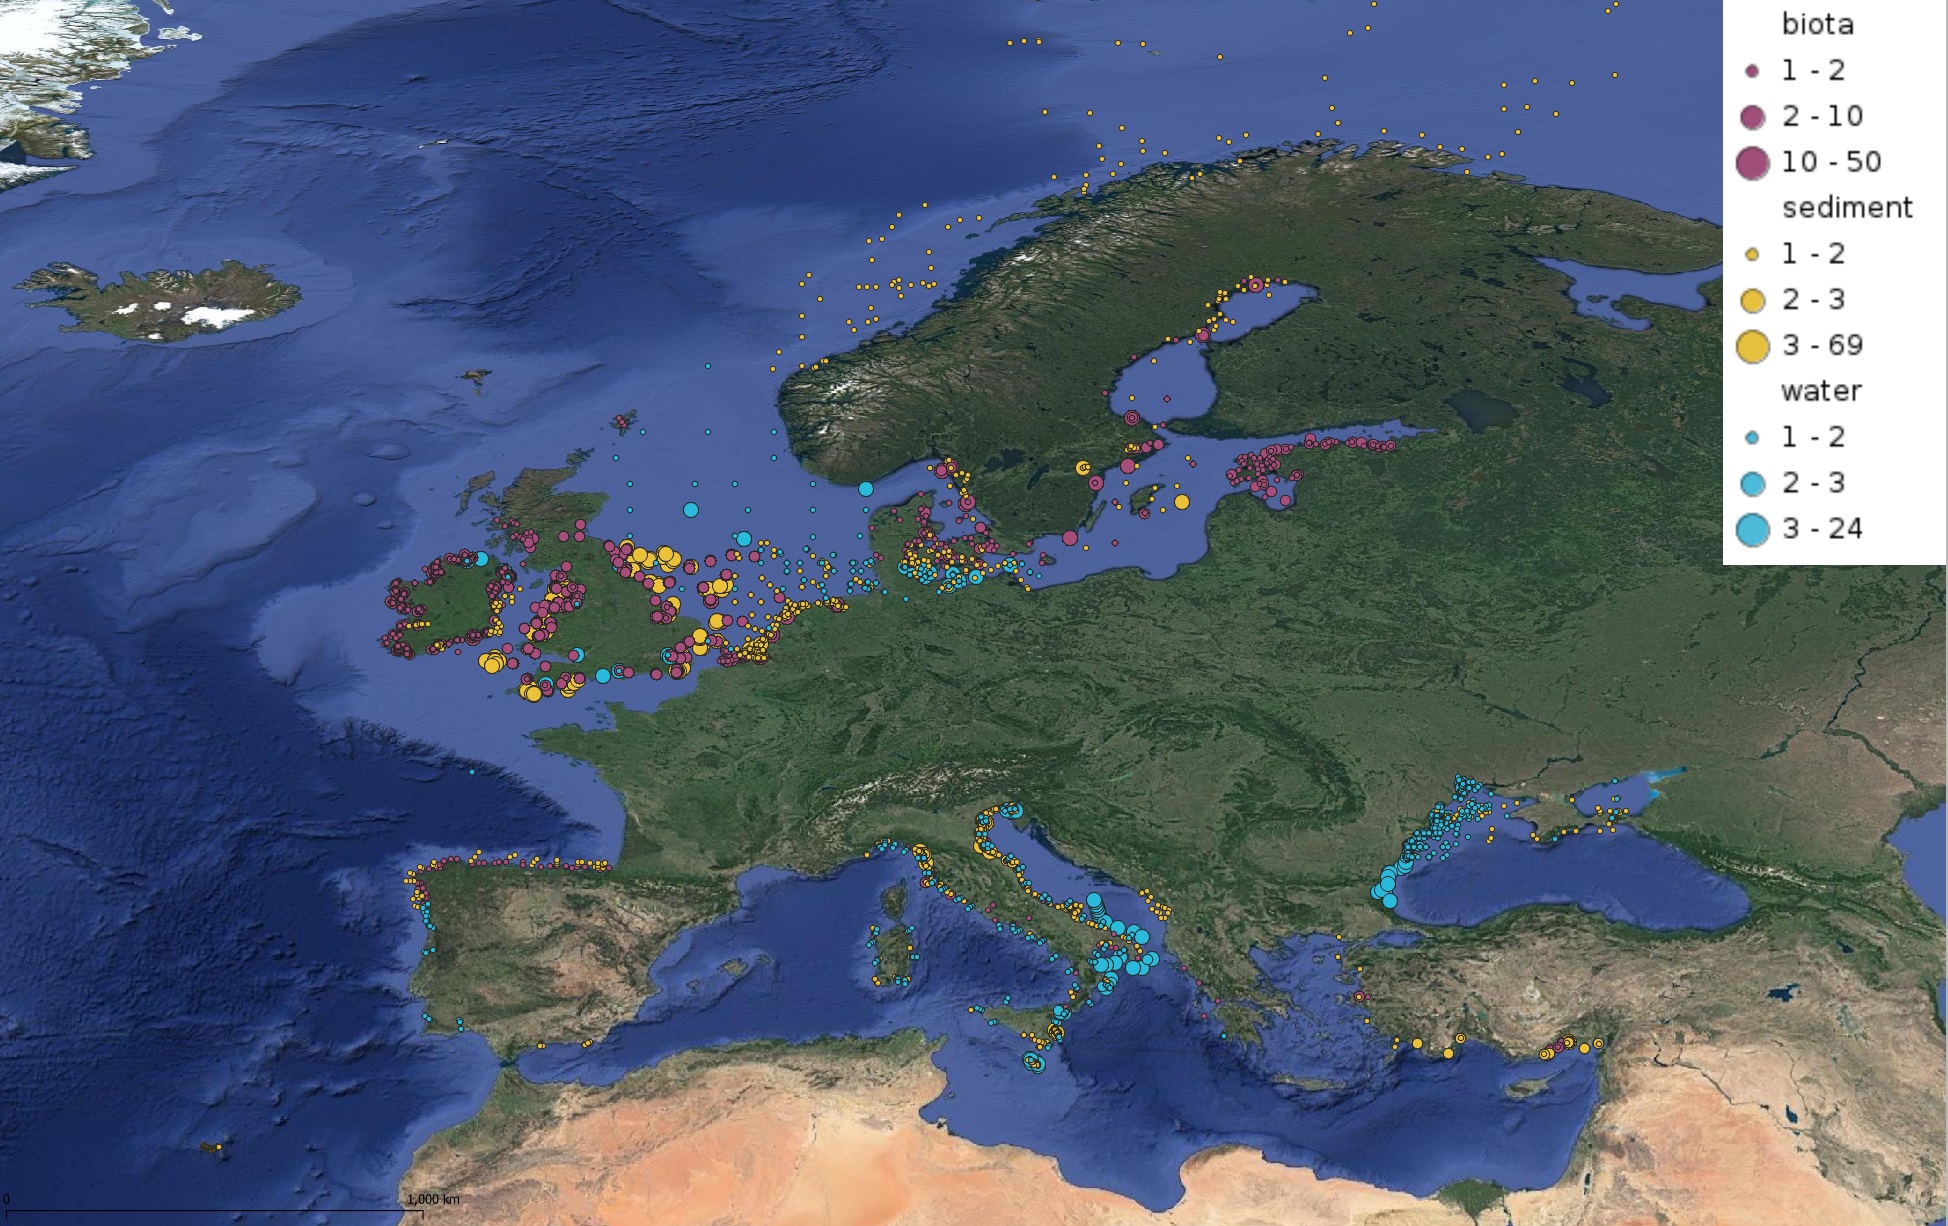
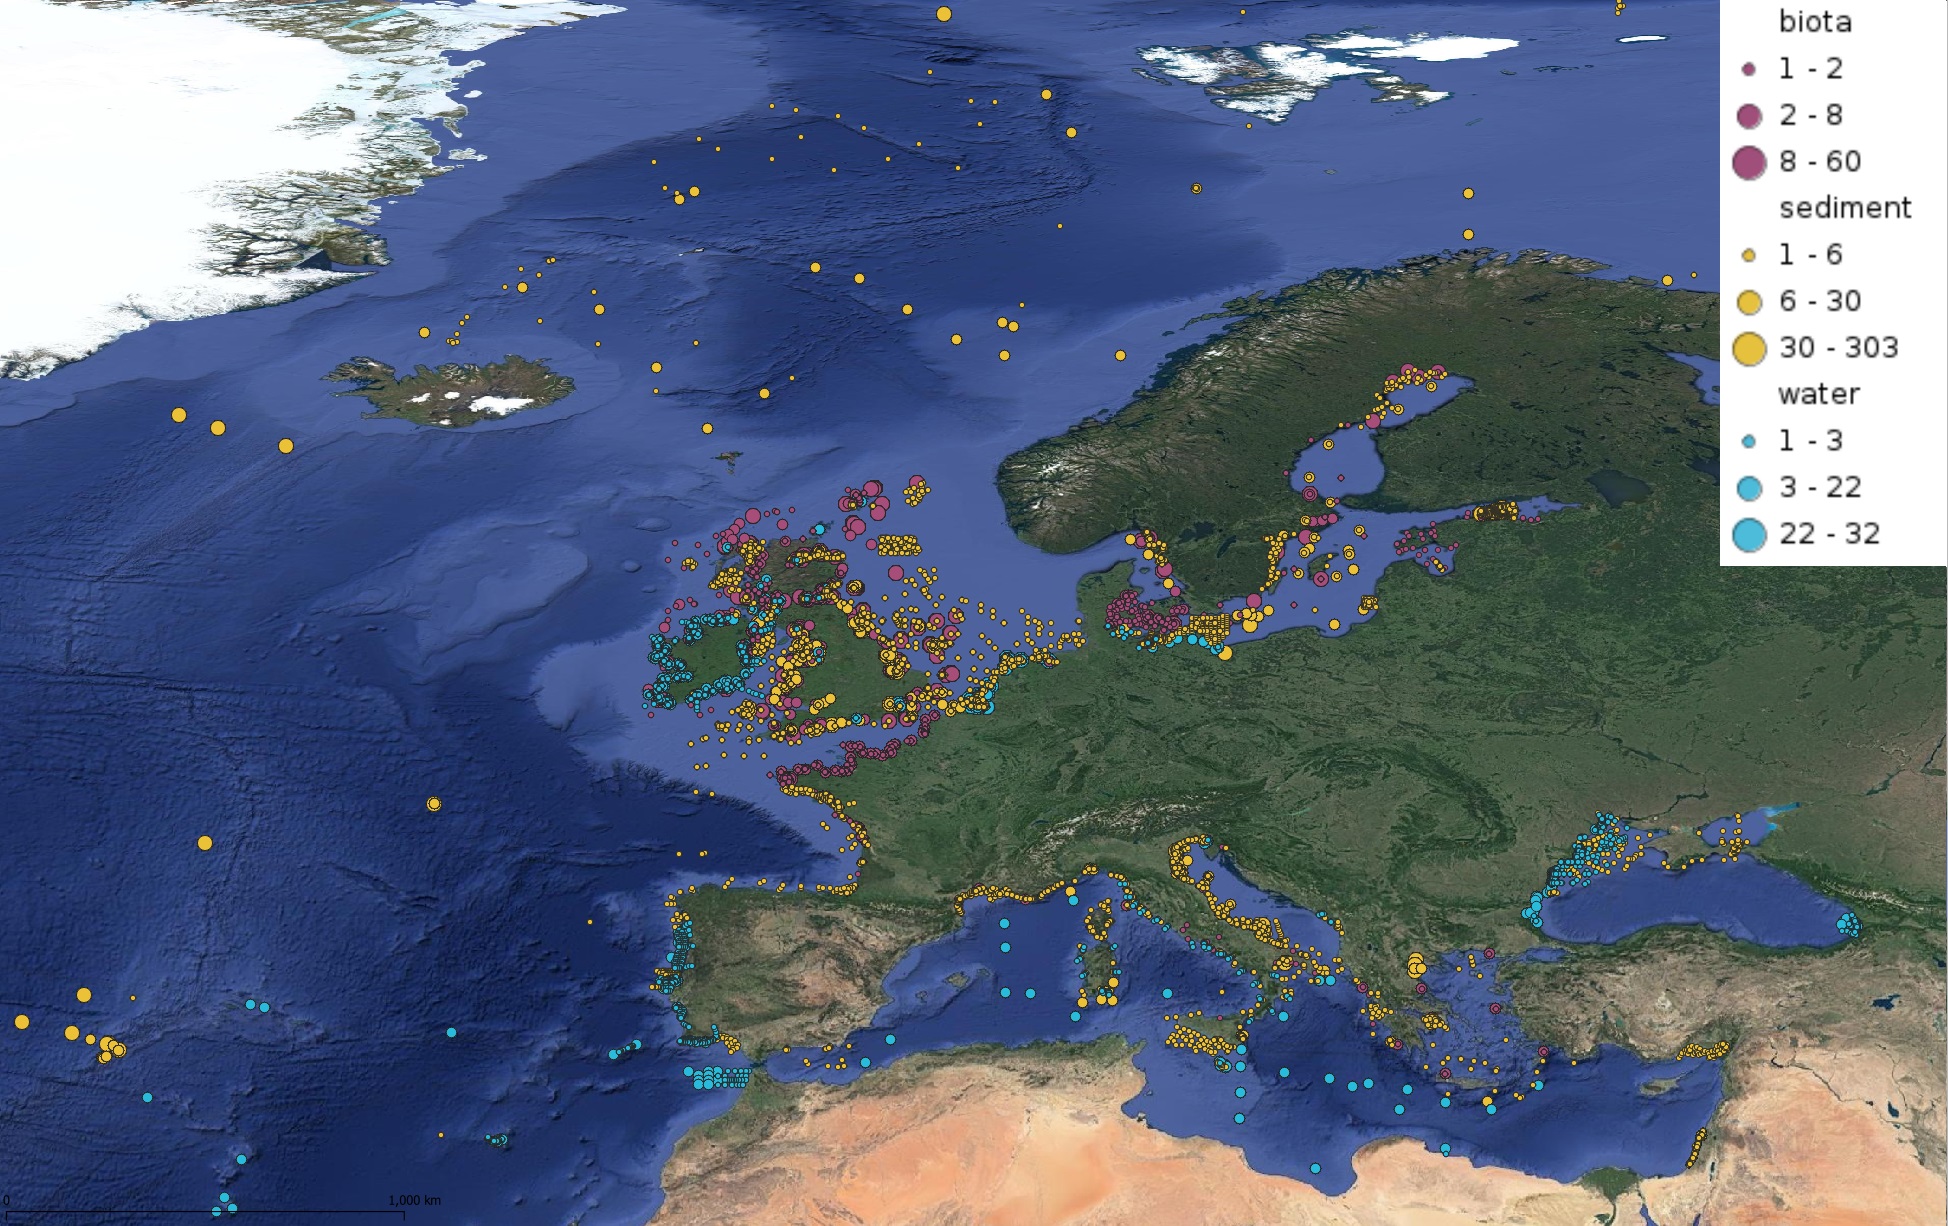
This product displays for Hexachlorobenzene, positions with values counts that have been measured per matrix and are present in EMODnet validated datasets. The product displays positions for all available years and per year.
-
This product displays for Nickel, positions with values counts that have been measured per matrix and are present in EMODnet validated datasets. The product displays positions for all available years and per year.