 EMODnet Product Catalogue
/Concepción
Type of resources
Available actions
Topics
Keywords
Contact for the resource
Provided by
Years
Formats
Representation types
status
Resolution
-
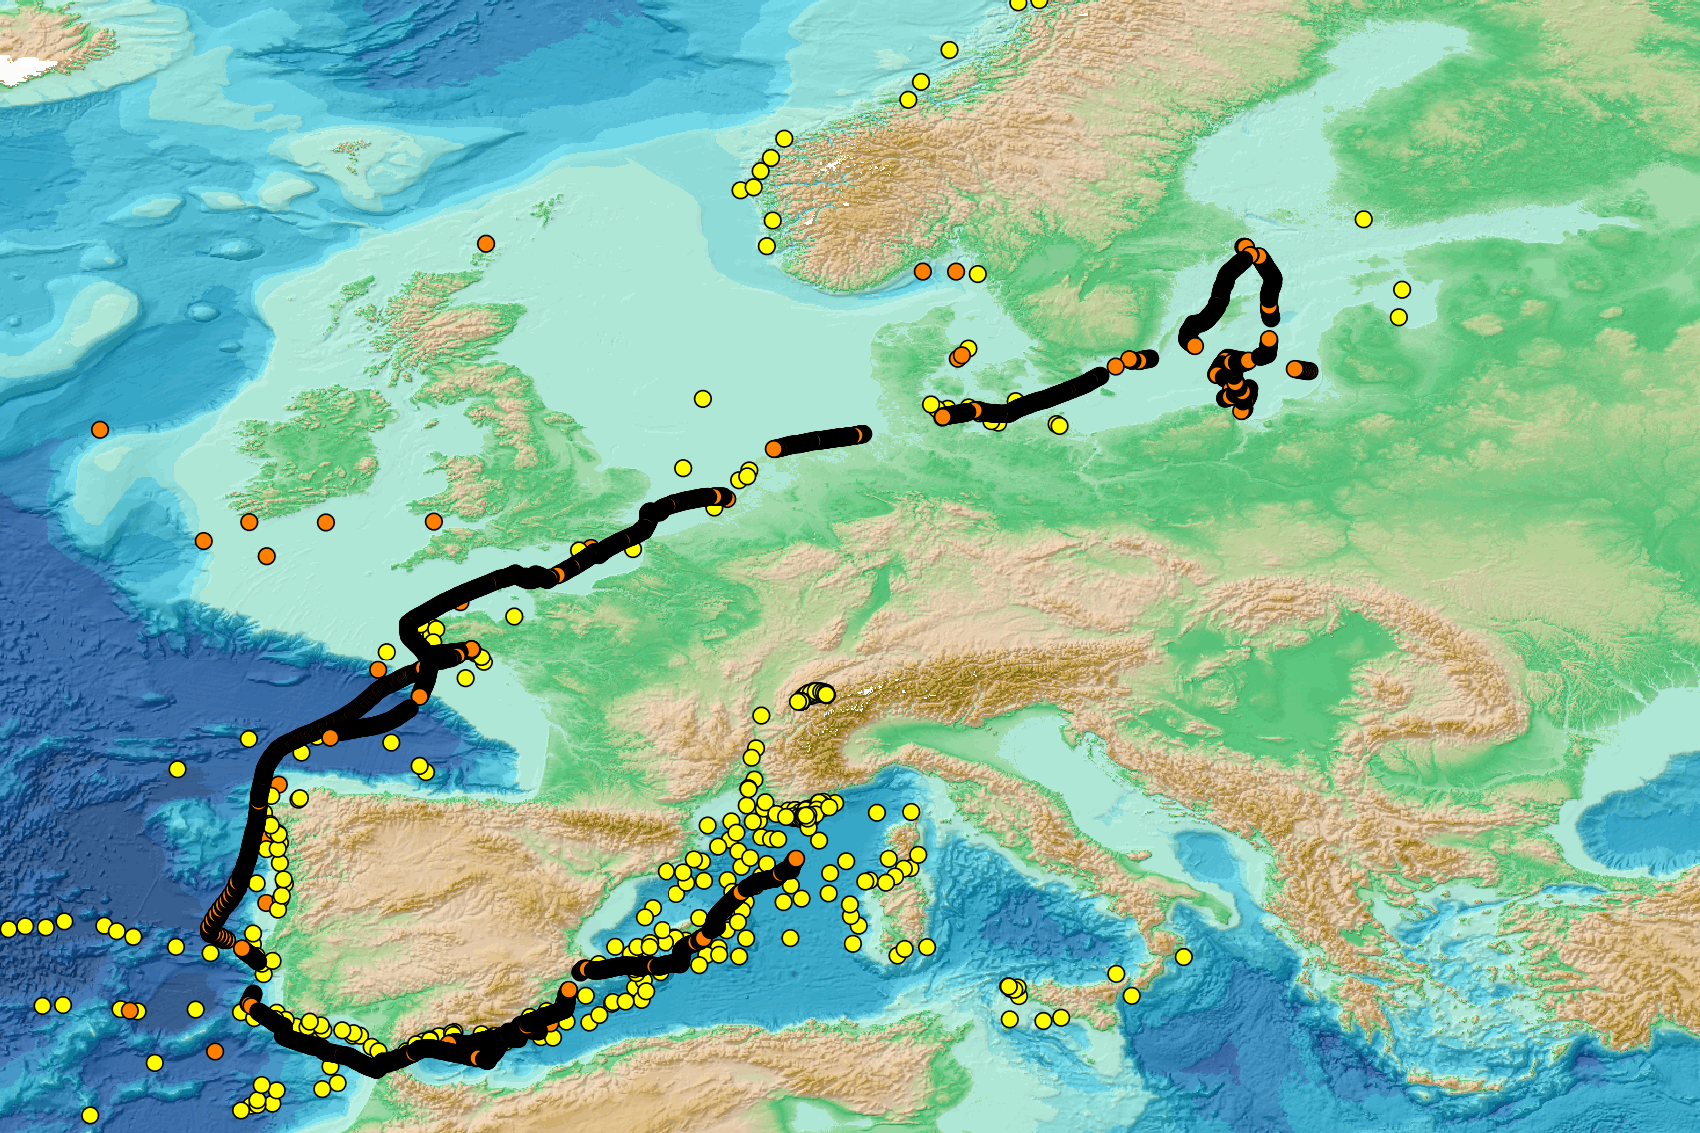
This visualization product displays nets locations where specific protocols have been applied to collate data on microlitter. Mesh size used with these protocols have been indicated with different colors in the map. EMODnet Chemistry included the collection of marine litter in its 3rd phase. Before 2021, there was no coordinated effort at the regional or European scale for micro-litter. Given this situation, EMODnet Chemistry proposed to adopt the data gathering and data management approach as generally applied for marine data, i.e., populating metadata and data in the CDI Data Discovery and Access service using dedicated SeaDataNet data transport formats. EMODnet Chemistry is currently the official EU collector of micro-litter data from Marine Strategy Framework Directive (MSFD) National Monitoring activities (descriptor 10). A series of specific standard vocabularies or standard terms related to micro-litter have been added to SeaDataNet NVS (NERC Vocabulary Server) Common Vocabularies to describe the micro-litter. European micro-litter data are collected by the National Oceanographic Data Centres (NODCs). Micro-litter map products are generated from NODCs data after a test of the aggregated collection including data and data format checks and data harmonization. A filter is applied to represent only micro-litter sampled according to a very specific protocol such as the Volvo Ocean Race (VOR) or Oceaneye. Warning: the absence of data on the map doesn't necessarily mean that they don't exist, but that no information has been entered in the National Oceanographic Data Centre (NODC) for this area.
-
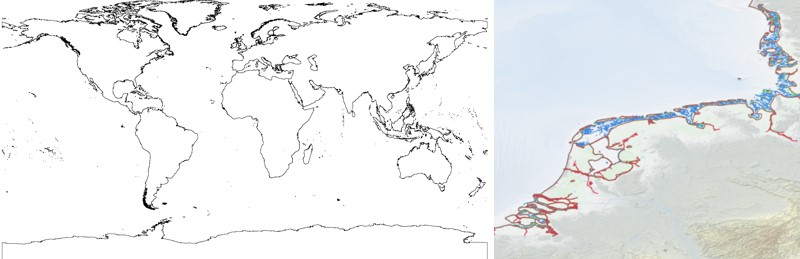
The EMODnet Bathymetry World Coastline is available as a WFS service from EMODnet Bathymetry. The service URL is: https://ows.emodnet-bathymetry.eu/wfs. The layer contains vector lines derived from land polygons available from OpenStreetMap. The original source url is https://osmdata.openstreetmap.de/. Parts of these polygons have been modified for use in EMODnet Bathymetry. In addition to the OSM EMODnet default coastline, three sub-layers are available as part of the EMODnet world coastline service. These sub-layers contain the best-estimate coastlines for Europe determined by Dutch research institute Deltares from satellite data (typically Sentinel-2 and Landsat-8) and in combination with the Global Tide Surge Model (GTSM) processed into digital coastlines for the European seas at LAT (Lowest Astronomical Tide), MSL (Mean-Sea-Level), and MHW (Mean-High-Water). The level of detail is bound to the resolution of the satellite sensor (e.g. 10m for Sentinel-2). The latest December 2022 version covers the entire coastline of Europe and now also part of the Caribbean. A detailed paper is available describing the methodology used to determine the three versions of the satellite derived coastline: https://emodnet.ec.europa.eu/sites/emodnet.ec.europa.eu/files/public/EMODnet-Bathymetry_2022_satellite_derived_coastlines_Deltares-Feb2023.pdf
-
The GEBCO_2020 Grid was released in May 2020 and is the second global bathymetric product released by the General Bathymetric Chart of the Oceans (GEBCO) and has been developed through the Nippon Foundation-GEBCO Seabed 2030 Project. The GEBCO_2020 Grid provides global coverage of elevation data in meters on a 15 arc-second grid of 43200 rows x 86400 columns, giving 3,732,480,000 data points. Grid Development The GEBCO_2020 Grid is a continuous, global terrain model for ocean and land with a spatial resolution of 15 arc seconds. The grid uses as a ‘base’ Version 2 of the SRTM15+ data set (Tozer et al, 2019). This data set is a fusion of land topography with measured and estimated seafloor topography. It is augmented with the gridded bathymetric data sets developed by the four Seabed 2030 Regional Centers. The Regional Centers have compiled gridded bathymetric data sets, largely based on multibeam data, for their areas of responsibility. These regional grids were then provided to the Global Center. For areas outside of the polar regions (primarily south of 60°N and north of 50°S), these data sets are in the form of 'sparse grids', i.e. only grid cells that contain data were populated. For the polar regions, complete grids were provided due to the complexities of incorporating data held in polar coordinates. The compilation of the GEBCO_2020 Grid from these regional data grids was carried out at the Global Center, with the aim of producing a seamless global terrain model. In contrast to the development of the previous GEBCO grid, GEBCO_2019, the data sets provided as sparse grids by the Regional Centers were included on to the base grid without any blending, i.e. grid cells in the base grid were replaced with data from the sparse grids. This was with aim of avoiding creating edge effects, 'ridges and ripples', at the boundaries between the sparse grids and base grid during the blending process used previously. In addition, this allows a clear identification of the data source within the grid, with no cells being 'blended' values. Routines from Generic Mapping Tools (GMT) system were used to do the merging of the data sets. For the polar data sets, and the adjoining North Sea area, supplied in the form of complete grids these data sets were included using feather blending techniques from GlobalMapper software version 11.0, made available by Blue Marble Geographic. The GEBCO_2020 Grid includes data sets from a number of international and national data repositories and regional mapping initiatives. For information on the data sets included in the GEBCO_2020 Grid, please see the list of contributions included in this release of the grid (https://www.gebco.net/data_and_products/gridded_bathymetry_data/gebco_2020/#compilations).