 EMODnet Product Catalogue
National Institute of Biology, Marine Biology Station
Type of resources
Available actions
Topics
Keywords
Contact for the resource
Provided by
Years
Formats
Resolution
-
The dataset contains the results of the monitoring activity in distinct years in Slovenian coastal waters related to contaminants in Sea water, sediments and biota.
-
The dataset contains circalitoral habita types in the Slovenian coastal area. It contains the description of habitat types, EUNIS codes, areas of the habitat and the key species described.
-
The dataset contains the results of the monitoring activity in distinct years in Slovenian coastal waters related to contaminants in sediments and biota.
-
The dataset contains the results of the monitoring activity in distinct years in Slovenian coastal waters related to contaminants in biota.
-
The dataset contains the results of the monitoring activity in 2022 in Slovenian coastal waters related to contaminants in sea water.
-
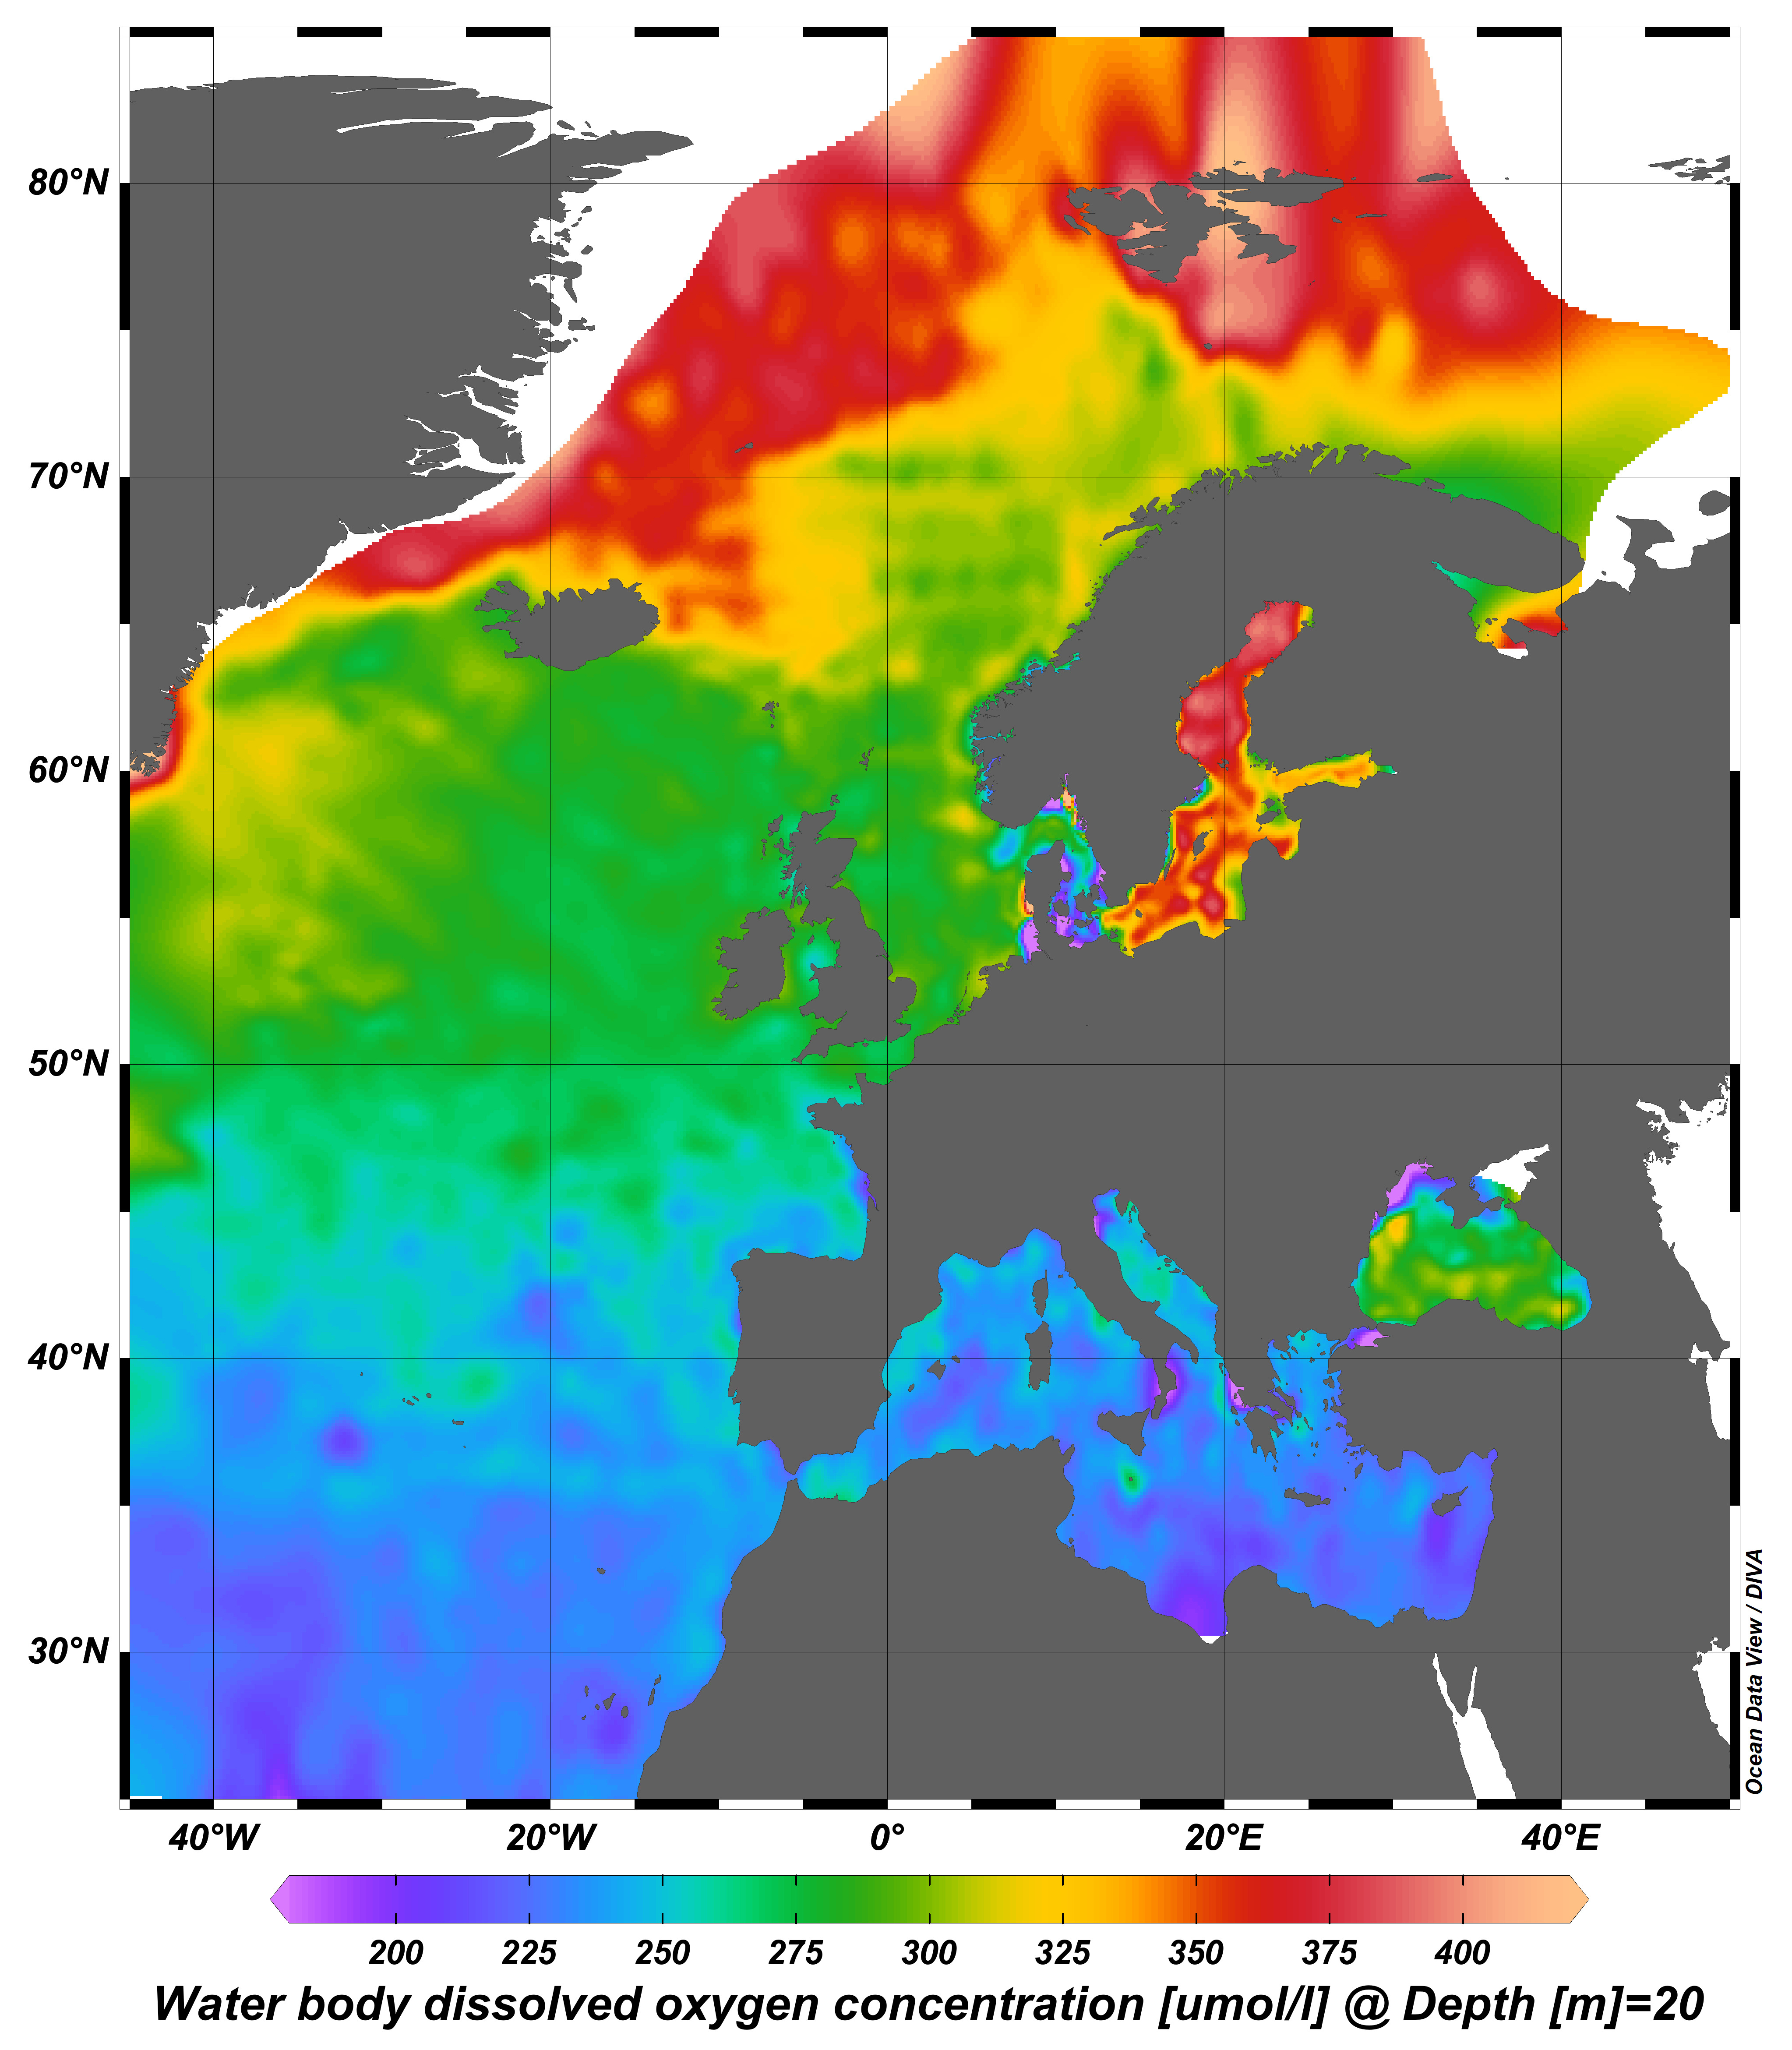
webODV visualisations via WMS from the harmonized, standardized, validated data collections that EMODnet Chemistry is regularly producing and publishing for all European sea basins for eutrophication and contaminants. You can analyze, visualize, subset and download EMODnet Chemistry data using interactive webODV services. More information at: https://emodnet.ec.europa.eu/en/chemistry#chemistry-services
-
The regulation published in the Official Gazette of the Republic of Slovenia determines the areas dedicated to aquaculture of specific marine organisms. The areas planned for aquaculture of shellfish are separated from the areas dedicated to the fish aquaculture.
-
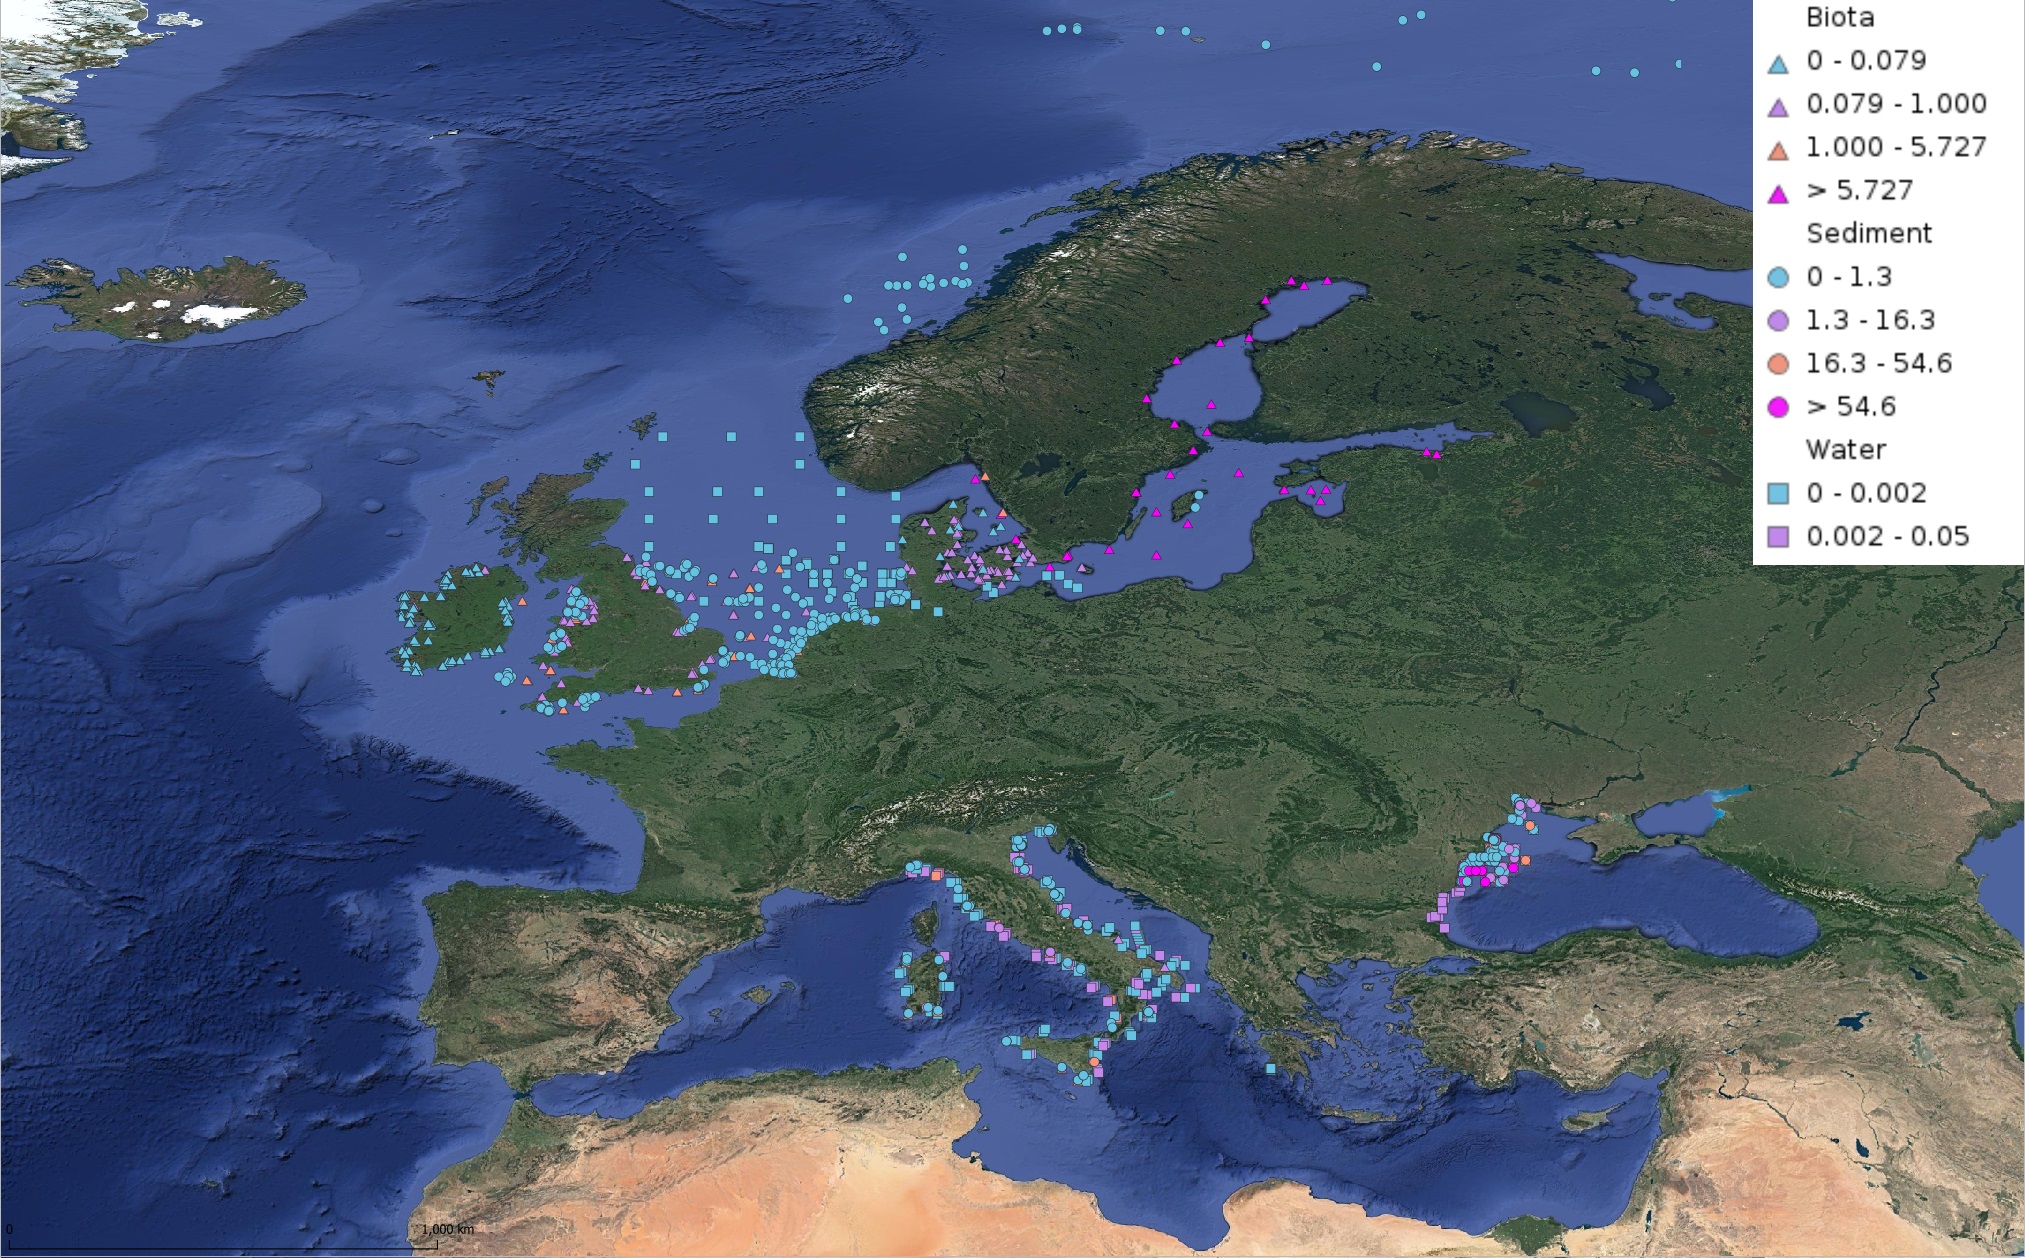
This product displays for Hexachlorobenzene, median values of the last 6 available years that have been measured per matrix and are present in EMODnet validated datasets. The median values ranges are derived from the following percentiles: 0-25%, 25-75%, 75-90%, >90%. Only "good data" are used, namely data with Quality Flag=1, 2, 6, Q (SeaDataNet Quality Flag schema). For water, only surface values are used (0-15 m), for sediment and biota data at all depths are used.
-
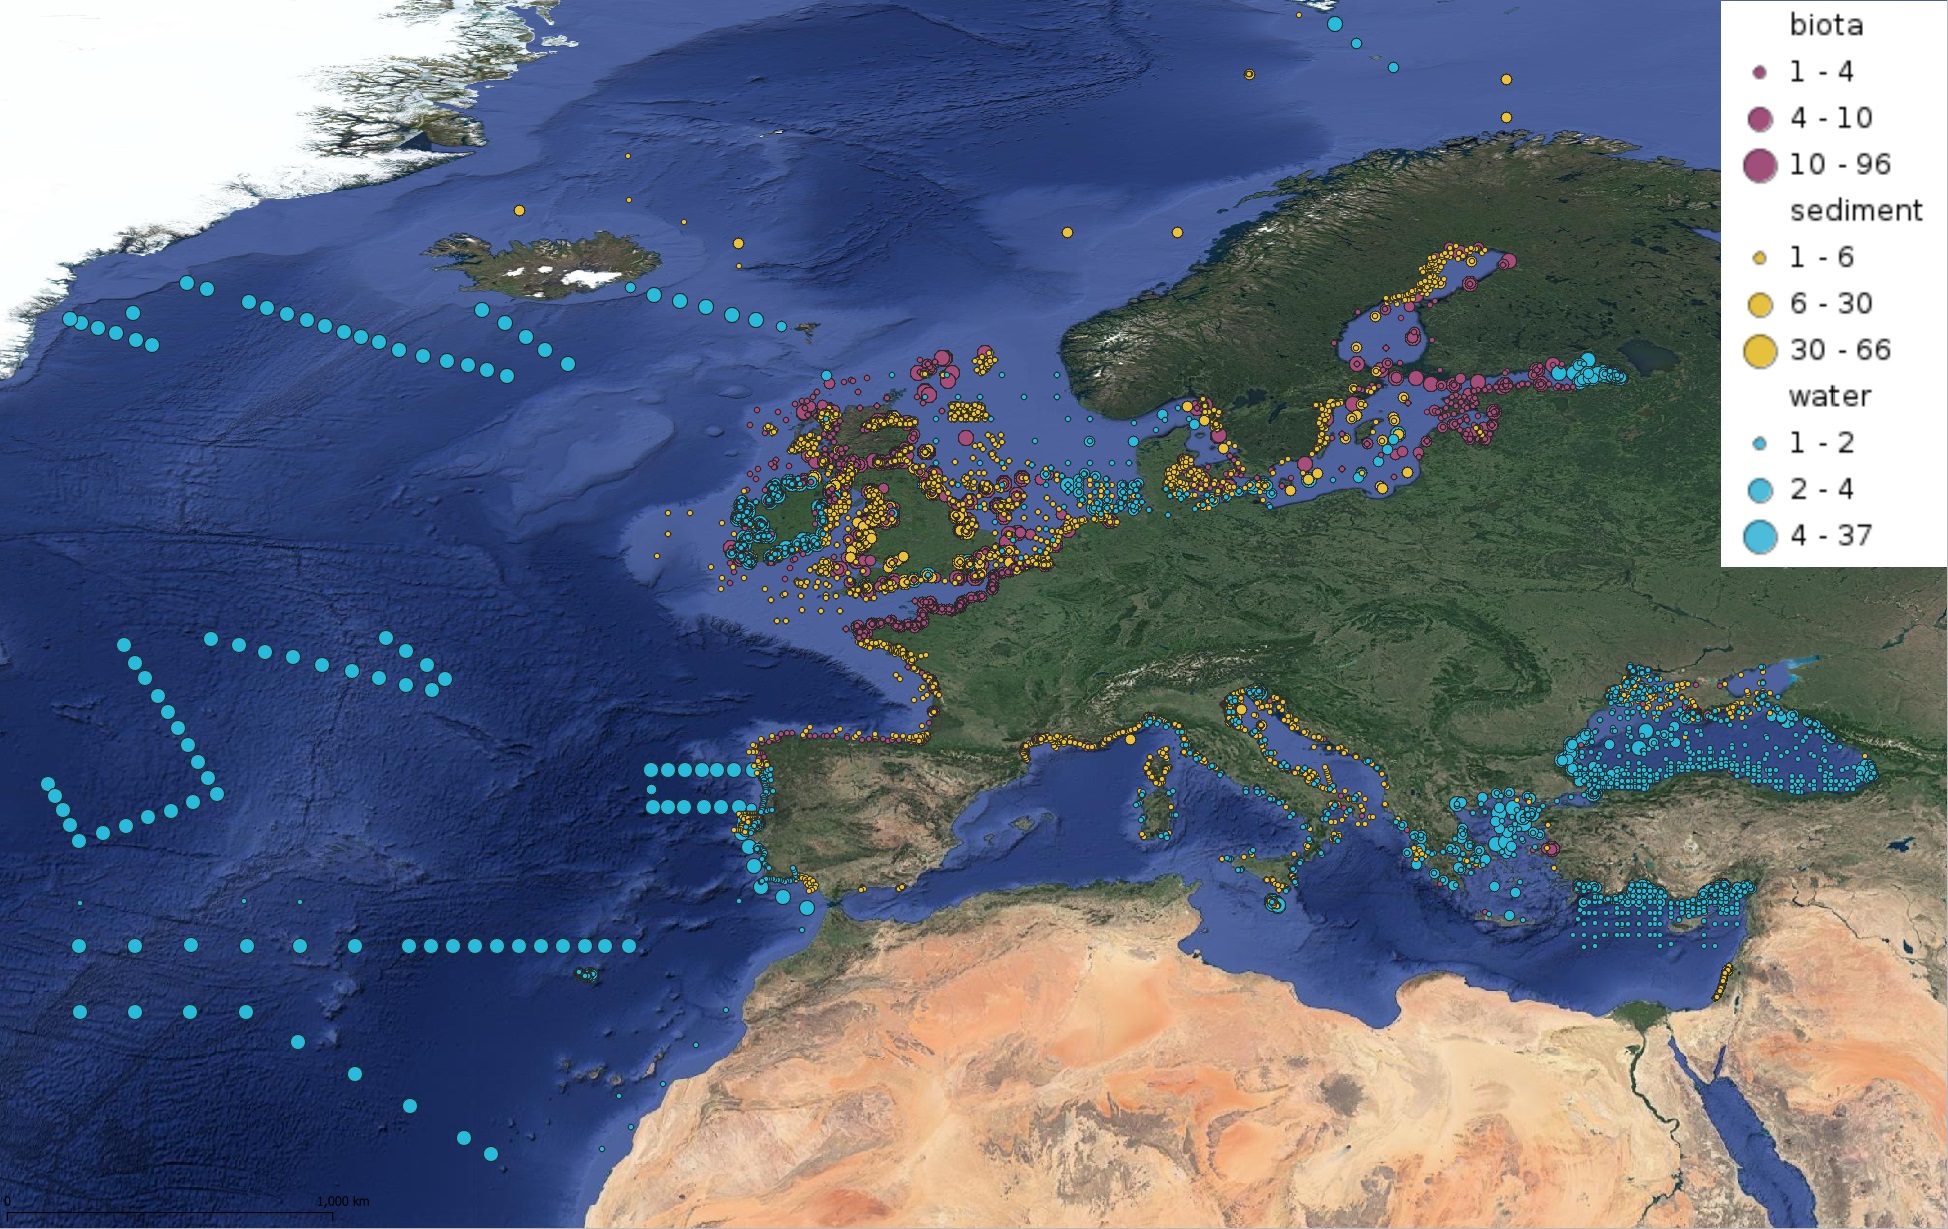
This product displays for Mercury, positions with values counts that have been measured per matrix and are present in EMODnet validated datasets. The product displays positions for all available years and per year.
-
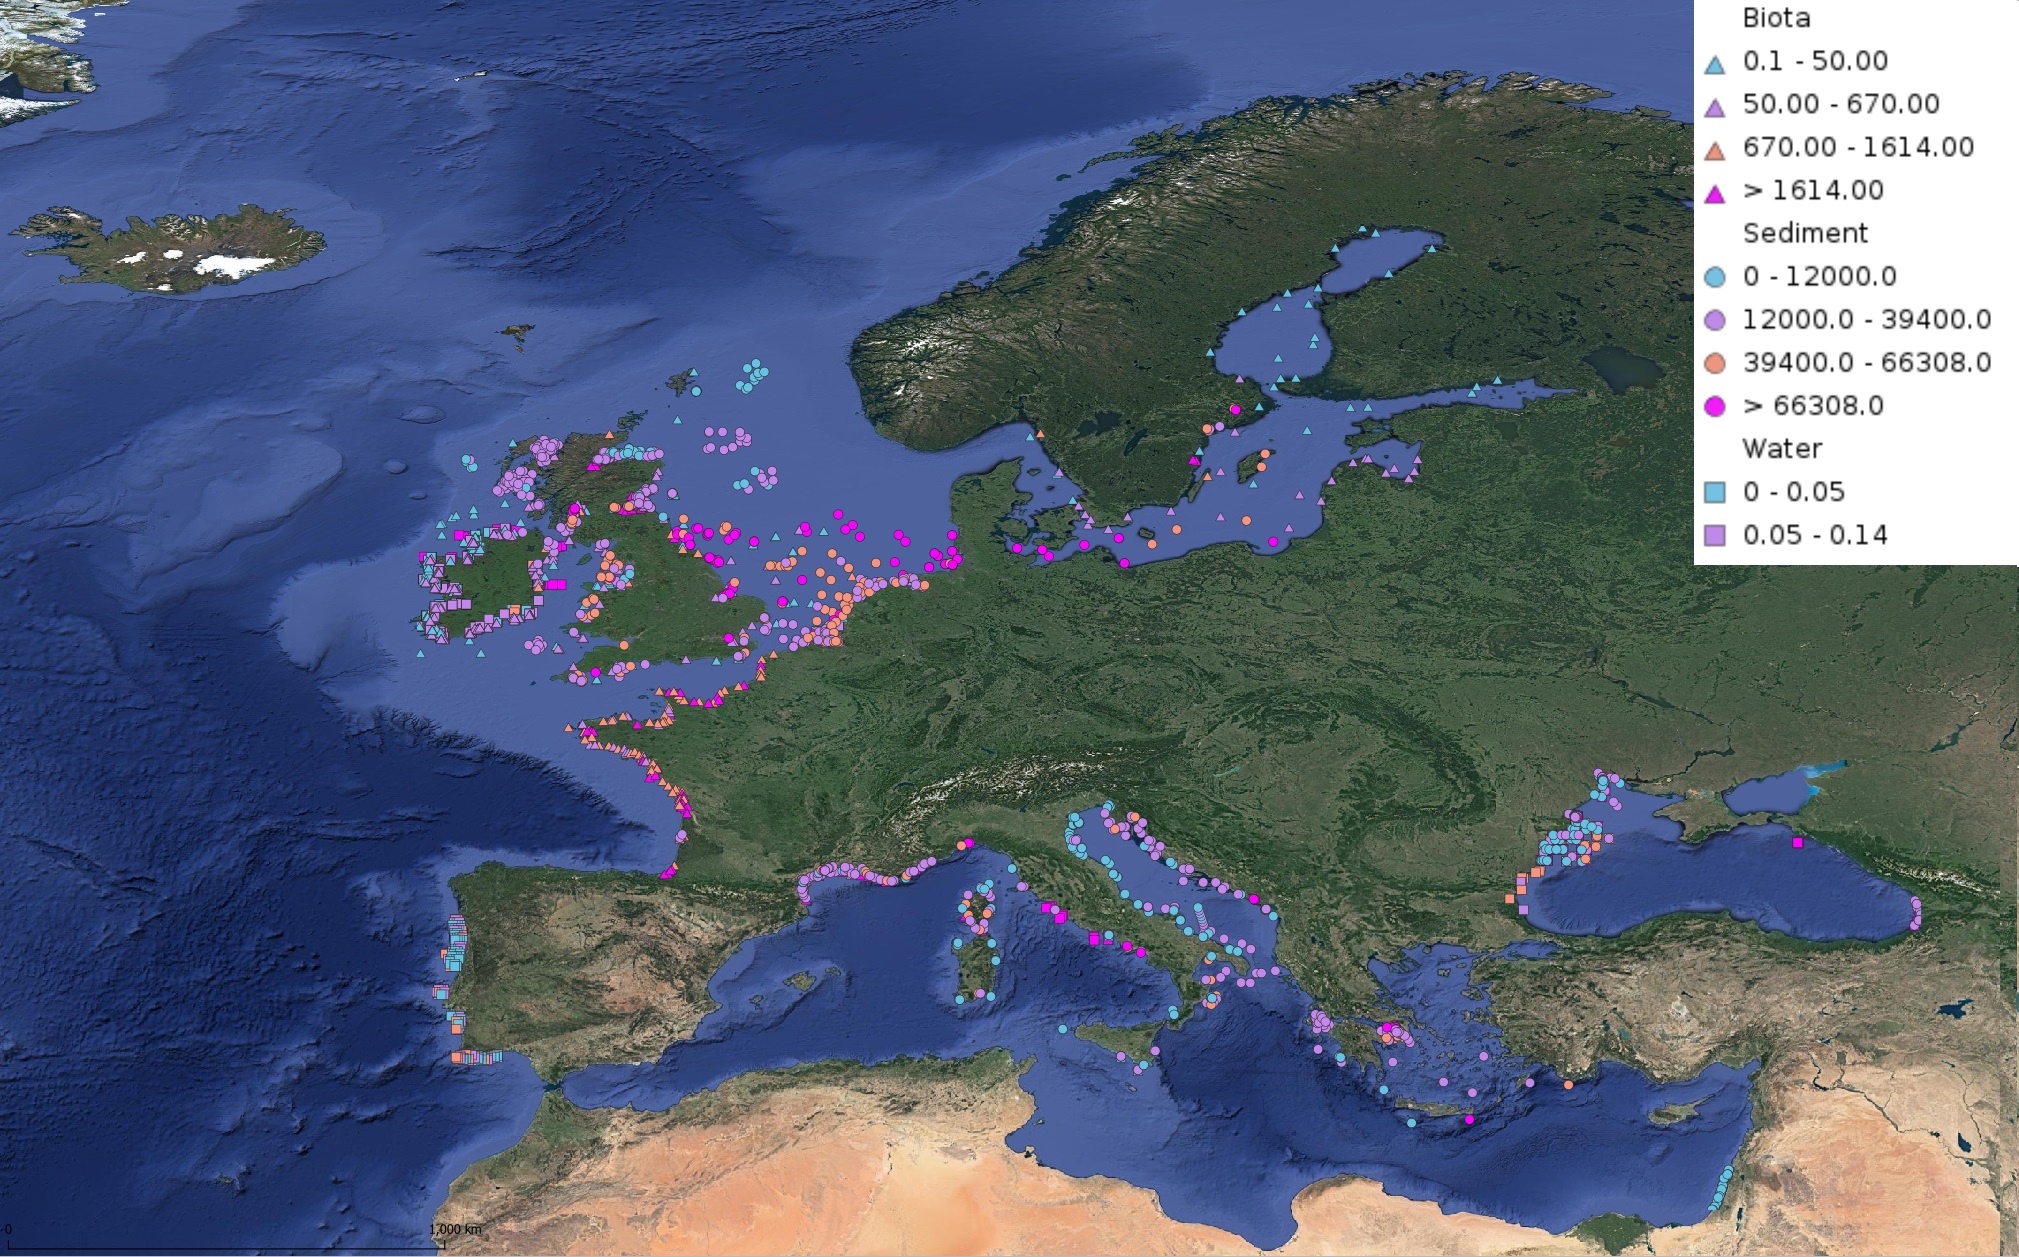
This product displays for Lead, median values of the last 6 available years that have been measured per matrix and are present in EMODnet validated datasets. The median values ranges are derived from the following percentiles: 0-25%, 25-75%, 75-90%, >90%. Only "good data" are used, namely data with Quality Flag=1, 2, 6, Q (SeaDataNet Quality Flag schema). For water, only surface values are used (0-15 m), for sediment and biota data at all depths are used.