 EMODnet Product Catalogue
oceans
Type of resources
Available actions
Topics
Keywords
Contact for the resource
Provided by
Years
Formats
Representation types
Update frequencies
status
Service types
Scale 1:
Resolution
-
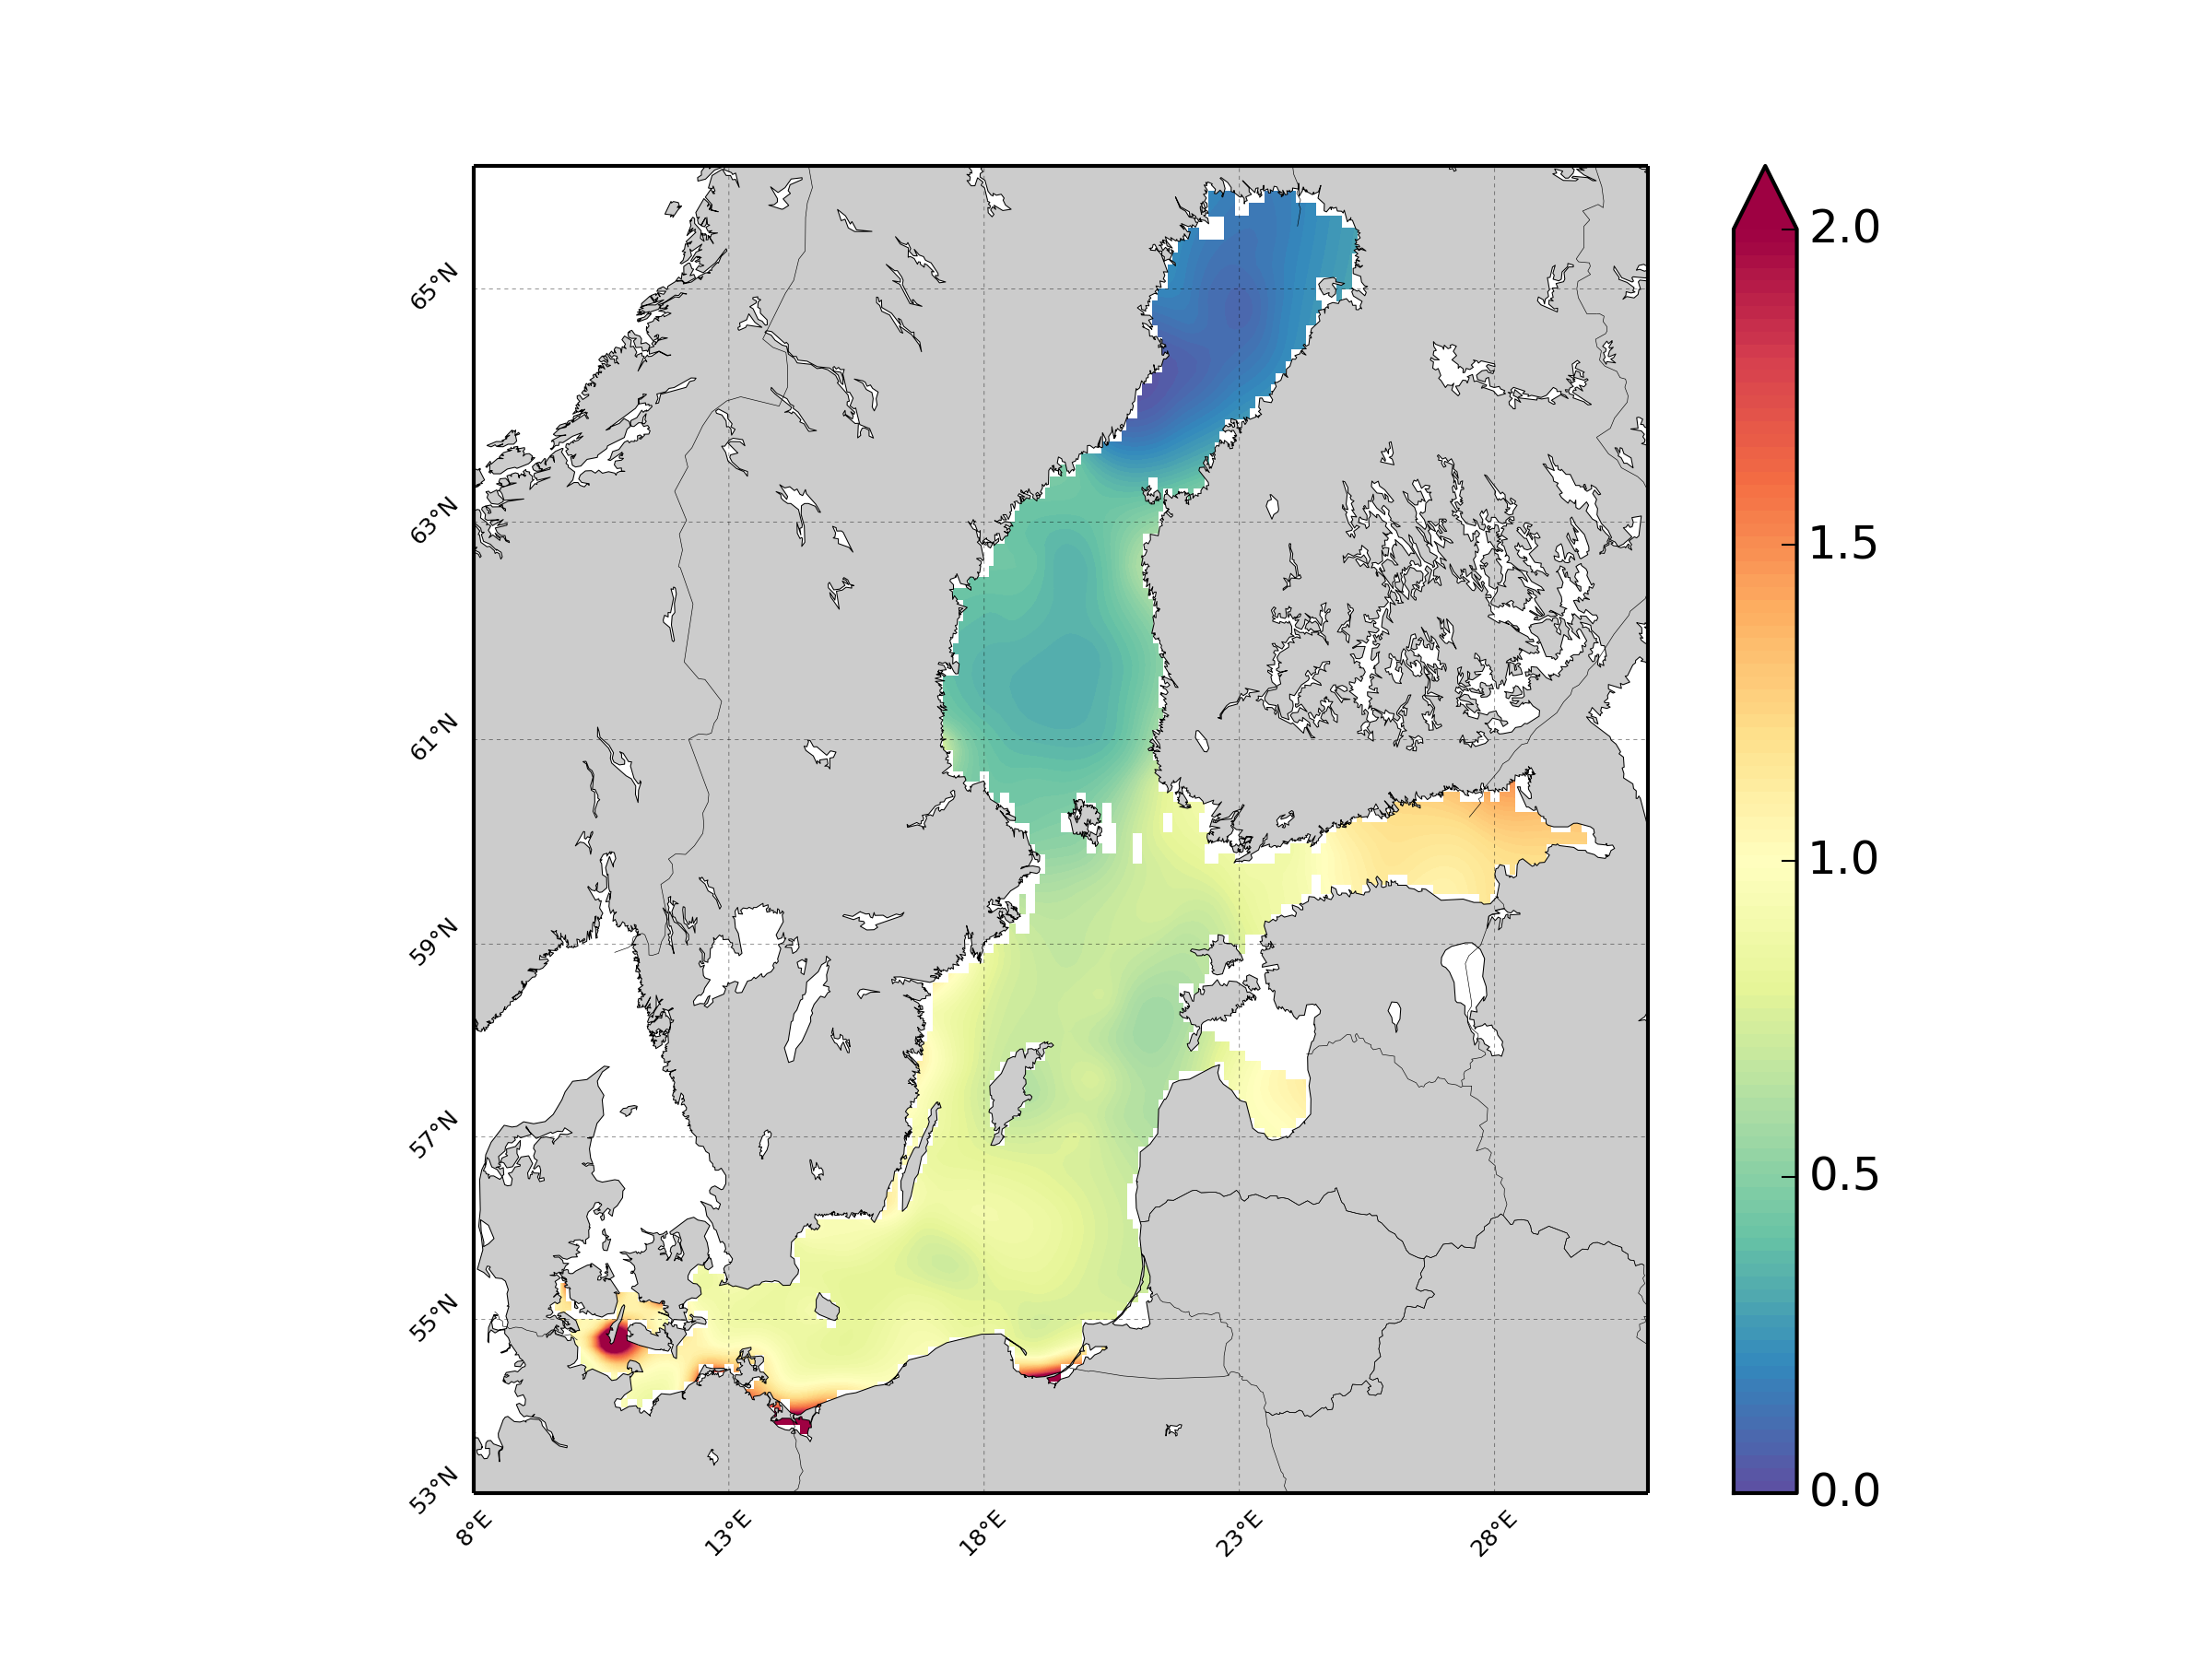
Units: umol/l. Method: spatial interpolation produced with DIVA (Data-Interpolating Variational Analysis). URL: http://modb.oce.ulg.ac.be/DIVA. Comment: Every year of the time dimension corresponds to a 10-year centred average for each season : - winter season (December-February), - spring (March-May), - summer (June-August), - autumn (September-November). Diva settings: Snr=1.0, CL=0.7.
-
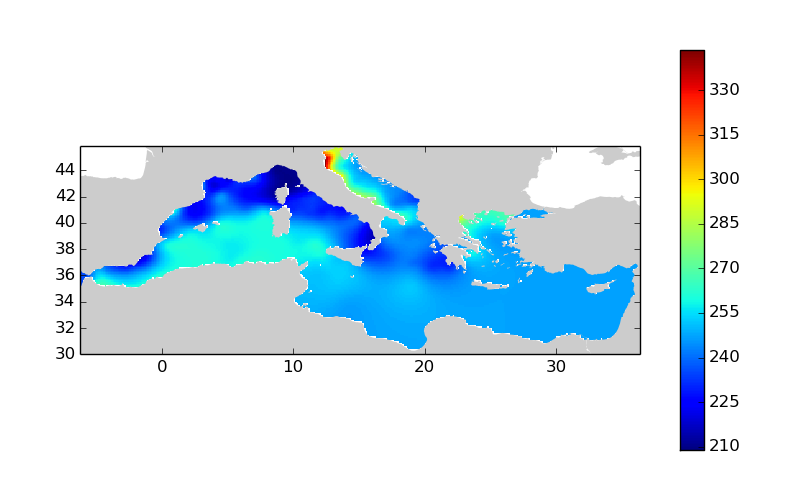
Moving 10-years analysis of dissolved_oxygen_concentration at Mediterranean Sea for each season : - winter (January-March), - spring (April-June), - summer (July-September), - autumn (October-December). Every year of the time dimension corresponds to the 10-year centered average of each season. Decades span from 1971-1980 until 2006-2015. Observational data span from 1911 to 2015. Depth range (IODE standard depths):-3000.0, -2500.0, -2000.0, -1750.0, -1500.0, -1400.0, -1300.0, -1200.0, -1100.0, -1000.0, -900.0, -800.0, -700.0, -600.0, -500.0, -400.0, -300.0, -250.0, -200.0, -150.0, -125.0, -100.0, -75.0, -50.0, -30.0, -20.0, -10.0, -5.0, -0.0. Data Sources: observational data from SeaDataNet/EMODNet Chemistry Data Network. Description of DIVA analysis: Geostatistical data analysis by DIVA (Data-Interpolating Variational Analysis) tool. Profiles were interpolated at standard depths using weighted parabolic interpolation algorithm (Reiniger and Ross, 1968). GEBCO 1min topography is used for the contouring preparation. Analyzed filed masked using relative error threshold 0.3 and 0.5. DIVA settings: A constant value for signal-to-noise ratio was used equal to 1. Correlation length was optimized and filtered vertically and a seasonally-averaged profile was used. Logarithmic transformation applied to the data prior to the analysis. Background field: the data mean value is subtracted from the data. Detrending of data: no. Advection constraint applied: no. Originators of Italian data sets-List of contributors: o Brunetti Fabio (OGS) o Cardin Vanessa, Bensi Manuel doi:10.6092/36728450-4296-4e6a-967d-d5b6da55f306 o Cardin Vanessa, Bensi Manuel, Ursella Laura, Siena Giuseppe doi:10.6092/f8e6d18e-f877-4aa5-a983-a03b06ccb987 o Cataletto Bruno (OGS) o Cinzia Comici Cinzia (OGS) o Civitarese Giuseppe (OGS) o DeVittor Cinzia (OGS) o Giani Michele (OGS) o Kovacevic Vedrana (OGS) o Mosetti Renzo (OGS) o Solidoro C.,Beran A.,Cataletto B.,Celussi M.,Cibic T.,Comici C.,Del Negro P.,De Vittor C.,Minocci M.,Monti M.,Fabbro C.,Falconi C.,Franzo A.,Libralato S.,Lipizer M.,Negussanti J.S.,Russel H.,Valli G., doi:10.6092/e5518899-b914-43b0-8139-023718aa63f5 o Celio Massimo (ARPA FVG) o Malaguti Antonella (ENEA) o Fonda Umani Serena (UNITS) o Bignami Francesco (ISAC/CNR) o Boldrini Alfredo (ISMAR/CNR) o Marini Mauro (ISMAR/CNR) o Miserocchi Stefano (ISMAR/CNR) o Zaccone Renata (IAMC/CNR) o Lavezza, R., Dubroca, L. F. C., Ludicone, D., Kress, N., Herut, B., Civitarese, G., Cruzado, A., Lefèvre, D., Souvermezoglou, E., Yilmaz, A., Tugrul, S., and Ribera d'Alcala, M.: Compilation of quality controlled nutrient profiles from the Mediterranean Sea, doi:10.1594/PANGAEA.771907, 2011. Units: umol/l
-
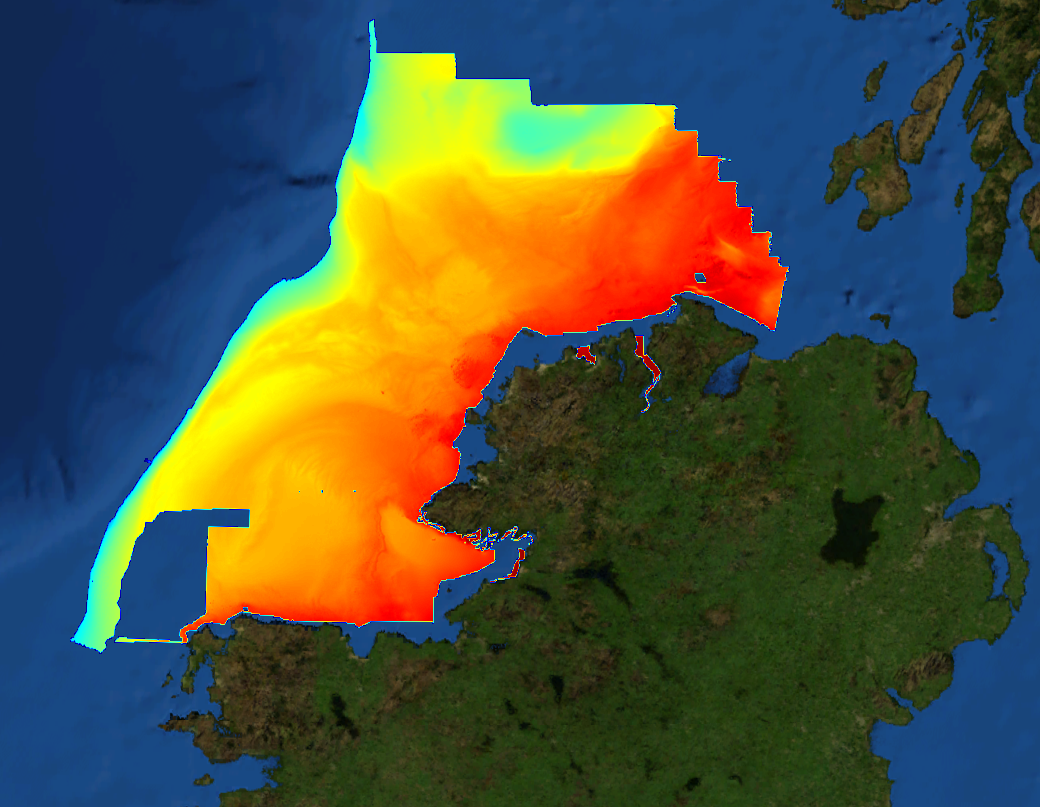
This composite Digital Terrain Model (cDTM) is a high resolution bathymetry dataset highlighting measurement of depth of water in the ocean. This cDTM covers the North Atlantic Ocean off the coast of County Donegal in Ireland. The EMODnet high resolution DTM covers bathymetry surveys completed between 2002 and 2016. Bathymetric data collected on board research vessels using multi-beam and single-beam echosounder instrumentation. Raw bathymetry processed within CARIS software to produce bathymetry products subsequently converted to NetCDF cDTM for EMODnet. Acquisition, processing and product delivery follows IHO standard s44 Edition 5. cDTM is composed of eighteen (18) images “merged simply” using GLOBE software. INFOMAR (Integrated Mapping for the Sustainable Development of Ireland’s Marine Resource) is a twenty year programme to map the physical, chemical and biological features of Ireland’s seabed established in 2006. INFOMAR is funded by the Department of Communications, Climate Action and Environment (DCCAE), and delivered by joint management partners Geological Survey Ireland and the Marine Institute. The programme is the successor to the Irish National Seabed Survey (INSS) which ran between 1999 and 2005. INFOMAR concentrates on creating integrated mapping products related to the seabed.
-
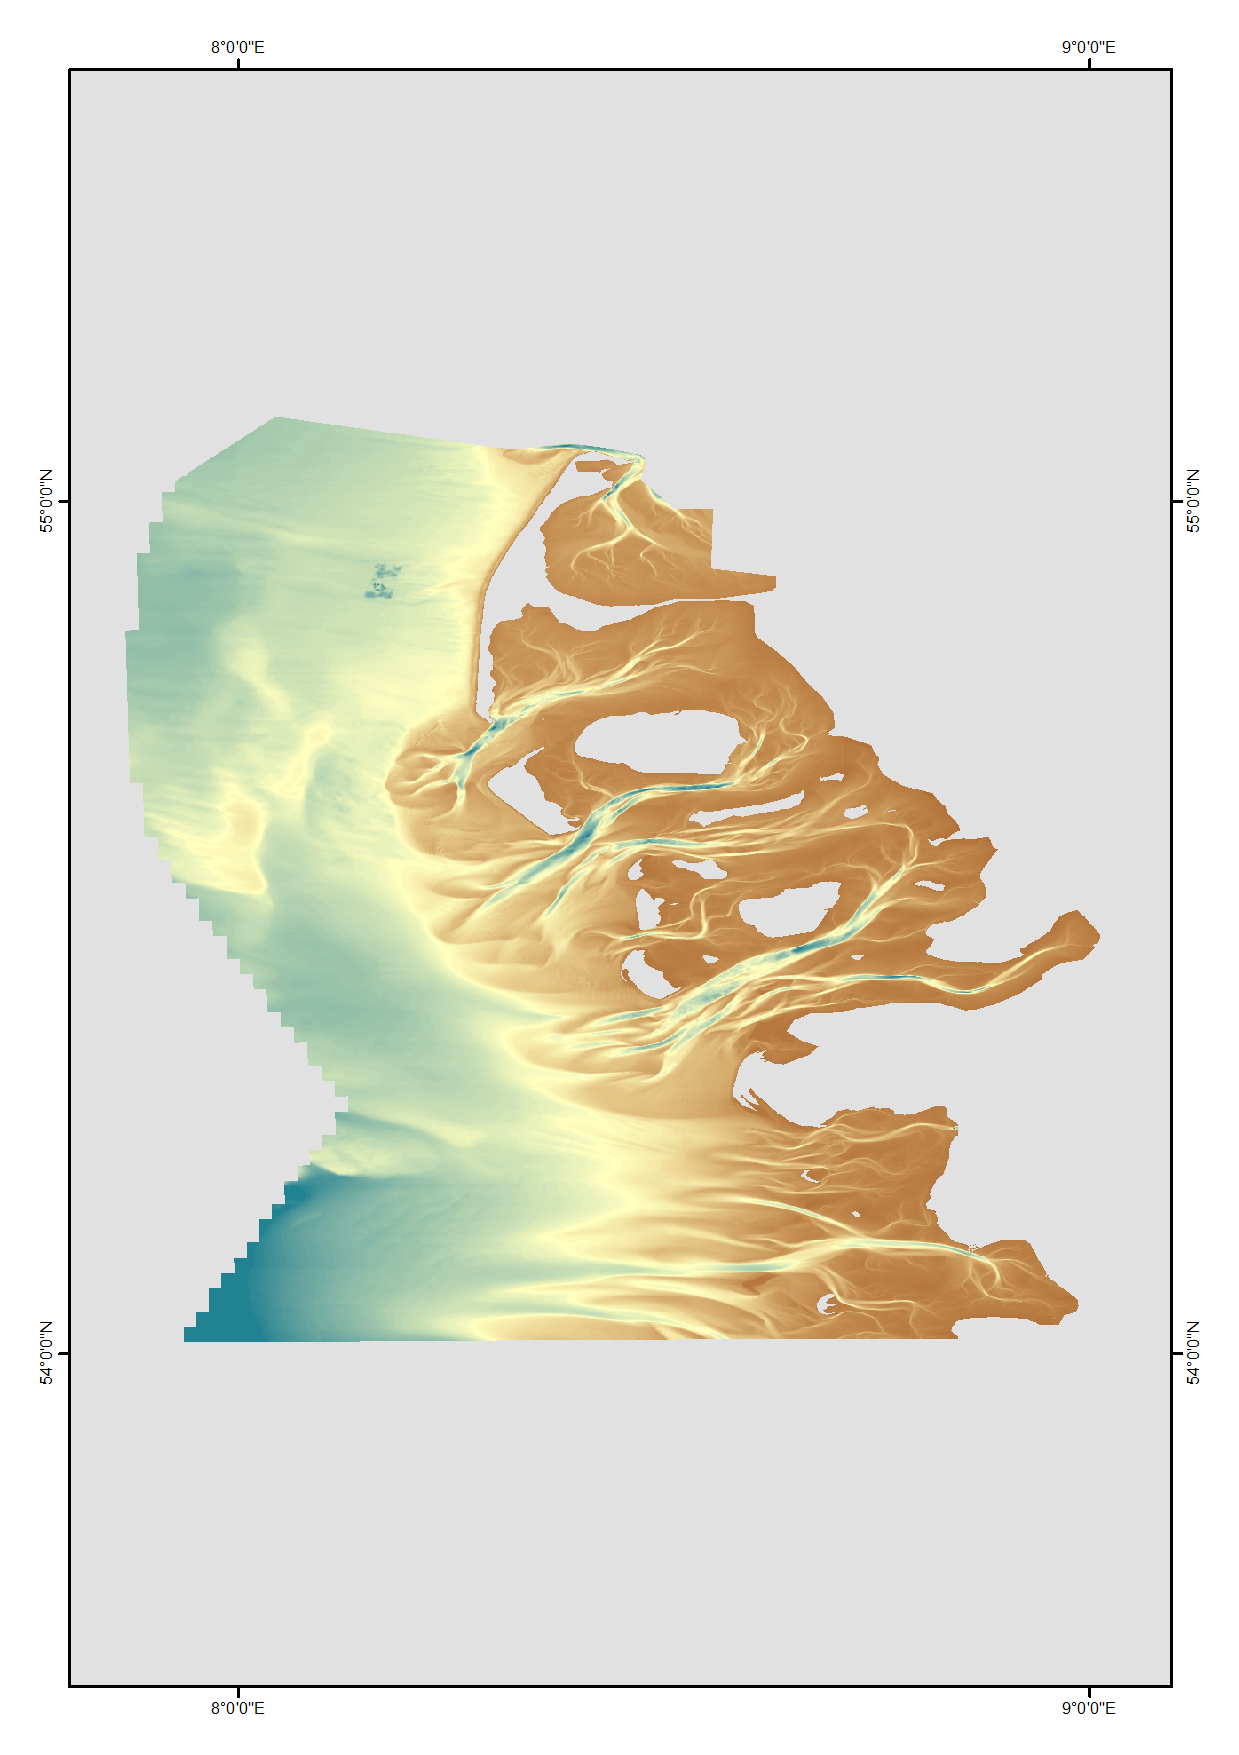
High resolution digital terrain model of the North Frisian waters based on survey data from various sources such as single-beam, multi-beam and Lidar.
-
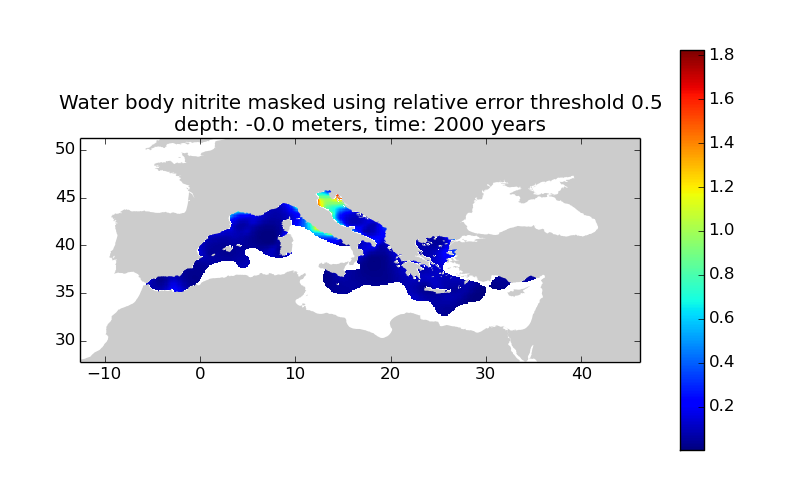
Moving 10-years analysis of nitrite at Mediterranean Sea for each season : - winter (January-March), - spring (April-June), - summer (July-September), - autumn (October-December). Every year of the time dimension corresponds to the 10-year centered average of each season. Decades span from 1965-1974 until 2004-2013. Observational data span from 1961 to 2013. Depth range (IODE standard depths): -1500.0, -1400.0, -1300.0, -1200.0, -1100.0, -1000.0, -900.0, -800.0, -700.0, -600.0, -500.0, -400.0, -300.0, -250.0, -200.0, -150.0, -125.0, -100.0, -75.0, -50.0, -30.0, -20.0, -10.0, -5.0, -0.0. Data Sources: observational data from SeaDataNet/EMODNet Chemistry Data Network. Description of DIVA analysis: Geostatistical data analysis by DIVA (Data-Interpolating Variational Analysis) tool. Profiles were interpolated at standard depths using weighted parabolic interpolation algorithm (Reiniger and Ross, 1968). GEBCO 1min topography is used for the contouring preparation. Analyzed filed masked using relative error threshold 0.3 and 0.5. DIVA settings: A constant value for signal-to-noise ratio was used equal to 3. Correlation length was optimized and filtered vertically and a seasonally-averaged profile was used. Logarithmic transformation applied to the data prior to the analysis. Background field: the data mean value is subtracted from the data. Detrending of data: no. Advection constraint applied: no. Originators of Italian data sets-List of contributors: o Brunetti Fabio (OGS) o Cardin Vanessa, Bensi Manuel doi:10.6092/36728450-4296-4e6a-967d-d5b6da55f306 o Cardin Vanessa, Bensi Manuel, Ursella Laura, Siena Giuseppe doi:10.6092/f8e6d18e-f877-4aa5-a983-a03b06ccb987 o Cataletto Bruno (OGS) o Cinzia Comici Cinzia (OGS) o Civitarese Giuseppe (OGS) o DeVittor Cinzia (OGS) o Giani Michele (OGS) o Kovacevic Vedrana (OGS) o Mosetti Renzo (OGS) o Solidoro C.,Beran A.,Cataletto B.,Celussi M.,Cibic T.,Comici C.,Del Negro P.,De Vittor C.,Minocci M.,Monti M.,Fabbro C.,Falconi C.,Franzo A.,Libralato S.,Lipizer M.,Negussanti J.S.,Russel H.,Valli G., doi:10.6092/e5518899-b914-43b0-8139-023718aa63f5 o Celio Massimo (ARPA FVG) o Malaguti Antonella (ENEA) o Fonda Umani Serena (UNITS) o Bignami Francesco (ISAC/CNR) o Boldrini Alfredo (ISMAR/CNR) o Marini Mauro (ISMAR/CNR) o Miserocchi Stefano (ISMAR/CNR) o Zaccone Renata (IAMC/CNR) o Lavezza, R., Dubroca, L. F. C., Ludicone, D., Kress, N., Herut, B., Civitarese, G., Cruzado, A., Lefèvre, D., Souvermezoglou, E., Yilmaz, A., Tugrul, S., and Ribera d'Alcala, M.: Compilation of quality controlled nutrient profiles from the Mediterranean Sea, doi:10.1594/PANGAEA.771907, 2011.
-
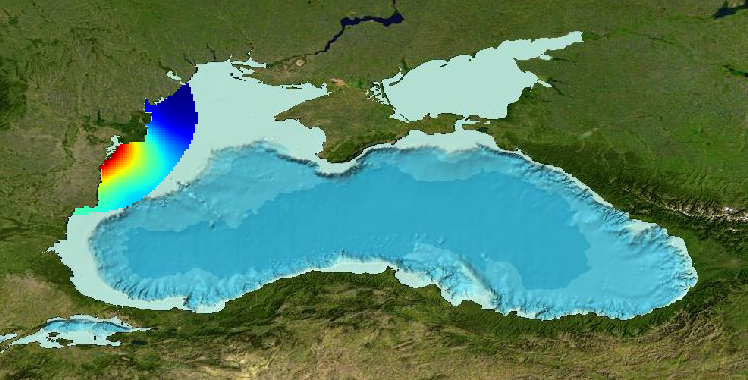
Gridded product for visualization of Water body chlorophyll-a in the Western part of Black Sea generated by DIVA 4.6.11 using all EMODNET Chemistry data from 2000 to 2014. Depth range (IODE standard depths): 0, -5, -10, –20m. DIVA settings: signal-to-noise ratio and correlation length were estimated using data mean distance as a minimum (for L), and both parameters vertically filtered. Background field: the data mean value is subtracted from the data. Detrending of data: no. Advection constraint applied: no. Analysis: logaritmic transformation. Every year of the time dimension corresponds to a 10-year centred average for each season: - winter: December - February, - spring: March - May, - summer: June - August, - autumn: September - November Units: mg/m^3
-
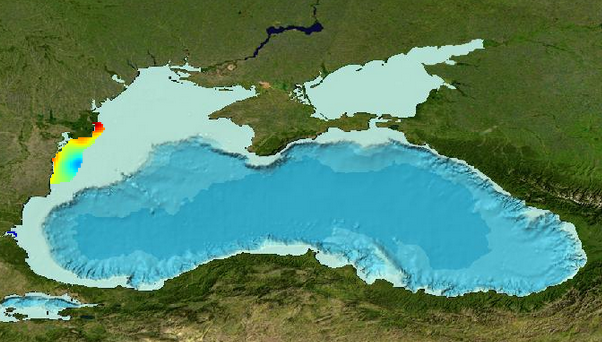
Gridded product for visualization of Water body ammonium in the Black Sea - West Slope generated by DIVA 4.6.9 using all EMODNET Chemistry data from 1980 to 2013. Depth range (IODE standard depths): 0 – 75m. DIVA settings: signal-to-noise ratio and correlation length were estimated using data mean distance as a minimum (for L), and both parameters vertically filtered. Background field: the data mean value is subtracted from the data. Detrending of data: no. Advection constraint applied: no. Every year of the time dimension corresponds to a 10-year centred average for each season: - winter: December - February, - spring: March - May, - summer: June - August, - autumn: September – November Units: umol/l
-
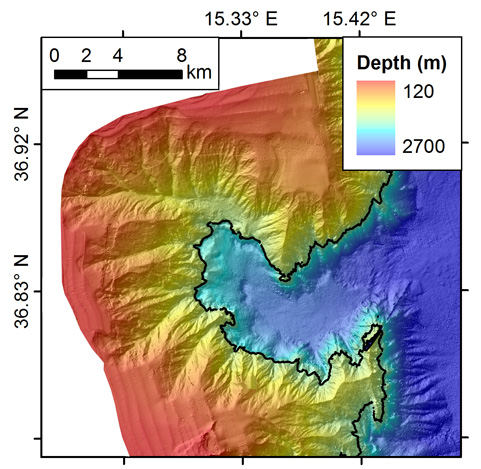
The data were acquired with Reson SeaBat 7150 and 8111 multibeam echosounder systems on board the R/V OGS Explora in order to cover the Malta Escarpment for a geological survey in the framework of EU FP7 project SCARP.
-
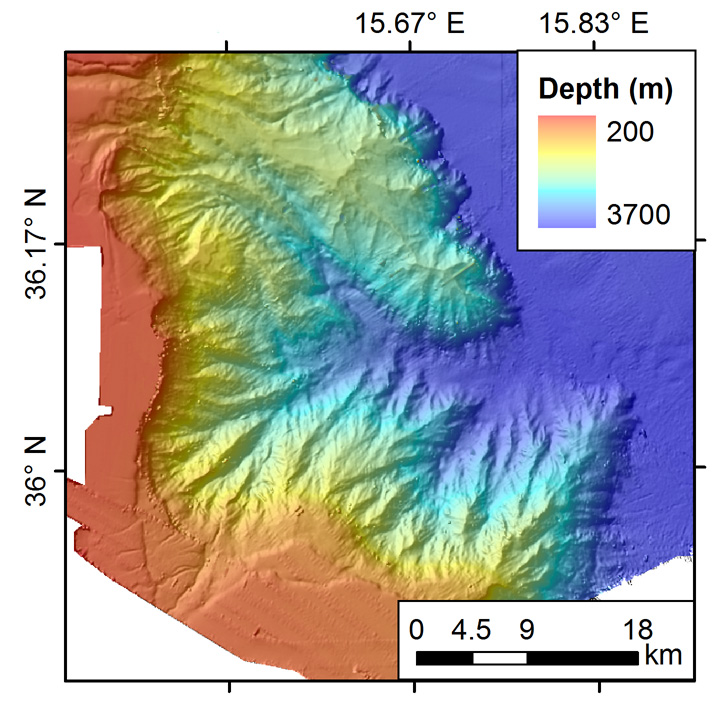
The data were acquired with Reson SeaBat 7150 and 8111 multibeam echosounder systems on board the R/V OGS Explora in order to cover the Malta Escarpment for a geological survey in the framework of EU FP7 project SCARP.
-
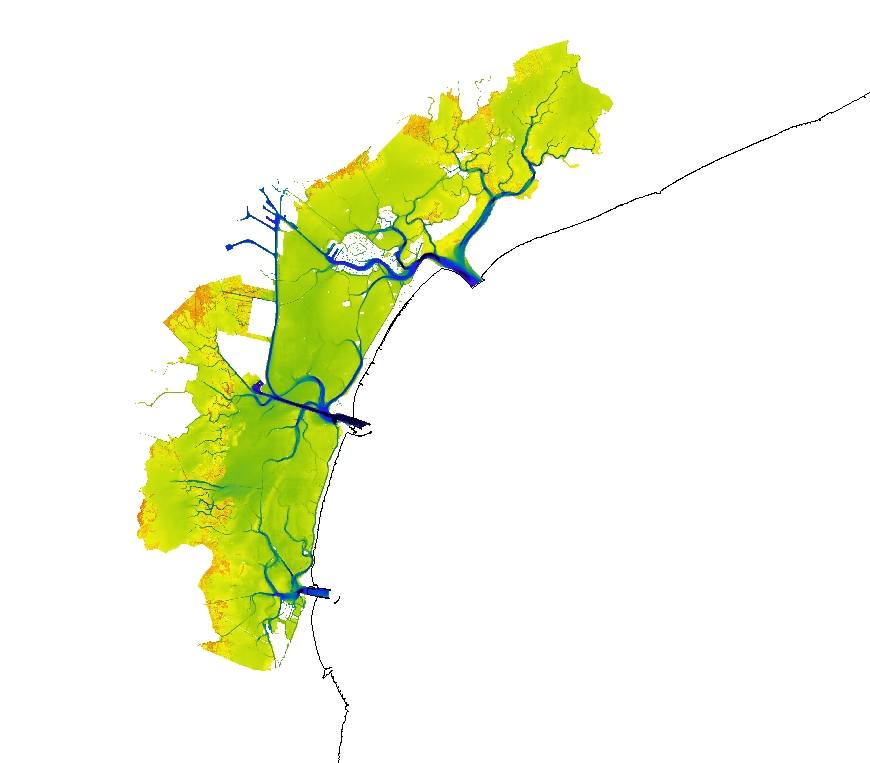
Satellite-derived bathymetry for the Venice Lagoon