 EMODnet Product Catalogue
infralittoral
Type of resources
Available actions
Topics
Keywords
Contact for the resource
Provided by
Formats
Representation types
Update frequencies
status
Scale 1:
-
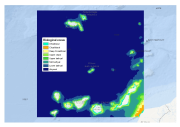
This layer is a model of the biological zones of the Canary Islands and Madeira archipelago. It was performed within the framework of EMODnet Phase 2 Thematic Lot n┬░ 3 (aka EUSeaMap2). It is a preliminary version which will be refined during the course of the project. This layer was modelled with the use of base layers that were the bathymetry (Gebco_08) and the kdpar (bespoke computed layer) The biological zones boundaries were defined in the following way. - Infralittoral lower limit: limit at which the percentage of light reaching the seabed is 1%. The percentage of light layer was calculated by intersecting the kdpar and the bathymetry layers. For more details about this calculation see e.g. Cameron and Askew (2011). - Circalittoral lower limit: depth 80m - Deep circalittoral lower limit: depth 200m - Upper slope lower limit: depth 750m - Upper bathyal lower limit: depth 1100m - Mid bathyal lower limit: depth 1800m - Lower bathyal lower limit: depth 2700m Deep biological zones (from upper slope to abyssal) were chosen according to the classification proposed by Howell (2010). For more details about the current layer see EUSeaMap first year report (EMODnet Thematic Lot n┬░ 3, 2014) Cameron, A., Askew, N. (eds.), 2011. EUSeaMap - Preparatory Action for development and assessment of a European broad-scale seabed habitat map final report. URL: http://jncc.gov.uk/euseamap EMODnet Thematic Lot n┬░ 3, 2014. EMODnet Phase 2 - Annual (interim) report. Reporting Period: Sept. 2013 to Aug. 2014. URL: http://www.emodnet-seabedhabitats.eu/pdf/20140909_euseamap2_year1_report.pdf Howell, K.L., 2010. A benthic classification system to aid in the implementation of marine protected area networks in the deep/high seas of the NE Atlantic. Biological Conservation 143, 1041ÔÇô1056.
-
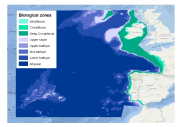
This layer is a model of the biological zones of the EU's 'Atlantic Area 2007-2013'. It was performed within the framework of MeshAtlantic project (INTERREG ÔÇÿAtlantic Area 2007-2013ÔÇÖ program). This layer was modelled with the use of bespoke base layers that were the bathymetry, wave wavelength and the kdpar The biological zones boundaries were defined in the following way. - Infralittoral lower limit: limit at which the percentage of light reaching the seabed is 1%. The percentage of light layer was calculated by intersecting the kdpar and the bathymetry layers. For more details about this calculation see e.g. Vasquez et al. (in press). - Circalittoral lower limit: limit at which the ratio wave wave length over the depth equals 2.53 - Deep circalittoral lower limit: break of slope due to the entrance into the continental slope. This limit was digitalized with the use of the bathymetry layer - Upper slope lower limit: depth 750m - Upper bathyal lower limit: depth 1100m - Mid bathyal lower limit: depth 1800m - Lower bathyal lower limit: break of slope due to the entrance into the abyssal plain. This limit was digitalized with the use of the bathymetry layer Deep biological zones (from upper slope to abyssal) were chosen according to the classification proposed by Howell (2010). For more detail see Vasquez et al. (in press) Howell, K.L., 2010. A benthic classification system to aid in the implementation of marine protected area networks in the deep/high seas of the NE Atlantic. Biological Conservation 143, 1041ÔÇô1056. Vasquez, M., Mata Chac├│n, D., Tempera, F., OÔÇÖKeeffe, E., Galparsoro, I., Sanz Alonso, J. L., Gon├ºalves, J.M.S., Bentes, L., Amorim, P., Henriques, V., McGrath, F., Monteiro, P., Mendes, B., Freitas, R., Martins, R., Populus, J., In press. Broad-scale mapping of seafloor habitats in the north-east Atlantic using existing environmental data.