 EMODnet Product Catalogue
Black Sea
Type of resources
Available actions
Topics
Keywords
Contact for the resource
Provided by
Years
Formats
Representation types
Scale 1:
Resolution
-
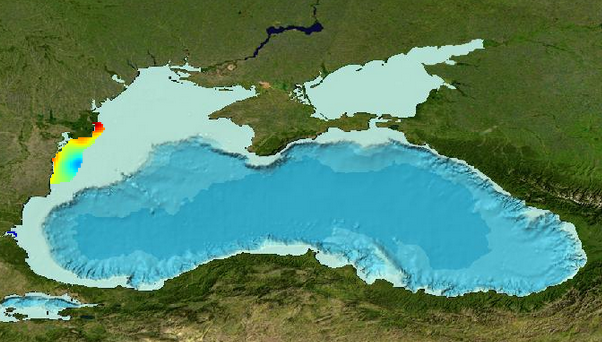
Gridded product for visualization of Water body ammonium in the Black Sea - West Slope generated by DIVA 4.6.9 using all EMODNET Chemistry data from 1980 to 2013. Depth range (IODE standard depths): 0 – 75m. DIVA settings: signal-to-noise ratio and correlation length were estimated using data mean distance as a minimum (for L), and both parameters vertically filtered. Background field: the data mean value is subtracted from the data. Detrending of data: no. Advection constraint applied: no. Every year of the time dimension corresponds to a 10-year centred average for each season: - winter: December - February, - spring: March - May, - summer: June - August, - autumn: September – November Units: umol/l
-
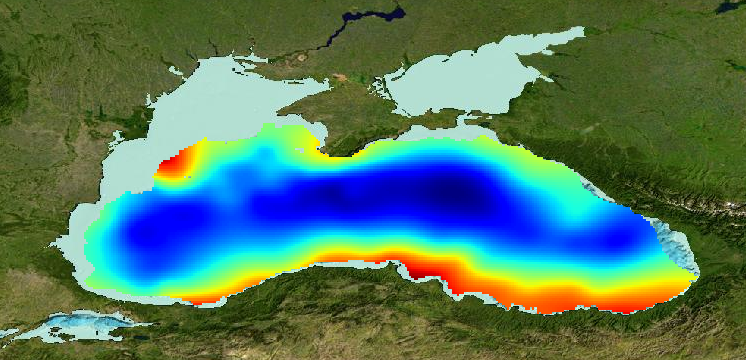
Gridded product for visualization of Water body dissolved oxygen concentration in the Black Sea generated by DIVA 4.6.11 using all EMODNET Chemistry data from 1970 to 2014. Depth range (IODE standard depths): 0 – 250m. DIVA settings: signal-to-noise ratio and correlation length were estimated using data mean distance as a minimum (for L), and both parameters vertically filtered. Background field: the data mean value is subtracted from the data. Detrending of data: no. Advection constraint applied: no. Every year of the time dimension corresponds to a 10-year centred average for each season: - winter: December - February, - spring: March - May, - summer: June - August, - autumn: September – November Units: umol/l
-
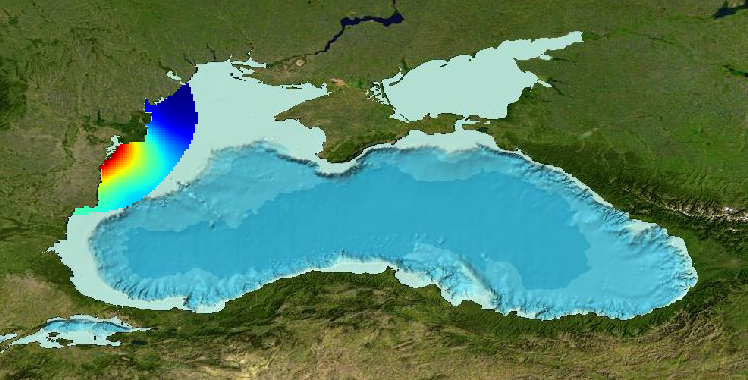
Gridded product for visualization of Water body chlorophyll-a in the Western part of Black Sea generated by DIVA 4.6.11 using all EMODNET Chemistry data from 2000 to 2014. Depth range (IODE standard depths): 0, -5, -10, –20m. DIVA settings: signal-to-noise ratio and correlation length were estimated using data mean distance as a minimum (for L), and both parameters vertically filtered. Background field: the data mean value is subtracted from the data. Detrending of data: no. Advection constraint applied: no. Analysis: logaritmic transformation. Every year of the time dimension corresponds to a 10-year centred average for each season: - winter: December - February, - spring: March - May, - summer: June - August, - autumn: September - November Units: mg/m^3
-
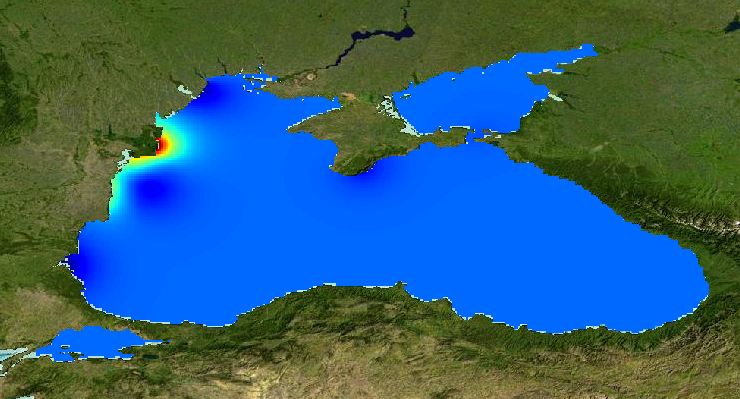
Gridded product for visualization of Water body nitrate plus nitrite in the Black Sea generated by DIVA 4.6.9 using all EMODNET Chemistry data from 1976 to 2013. Depth range (IODE standard depths): 0 – 150m. DIVA settings: signal-to-noise ratio and correlation length were estimated using data mean distance as a minimum (for L), and both parameters vertically filtered. Background field: the data mean value is subtracted from the data. Detrending of data: no. Advection constraint applied: no. Every year of the time dimension corresponds to a 10-year centred average for each season: - winter: December - February, - spring: March - May, - summer: June - August, - autumn: September – November Units: umol/l
-
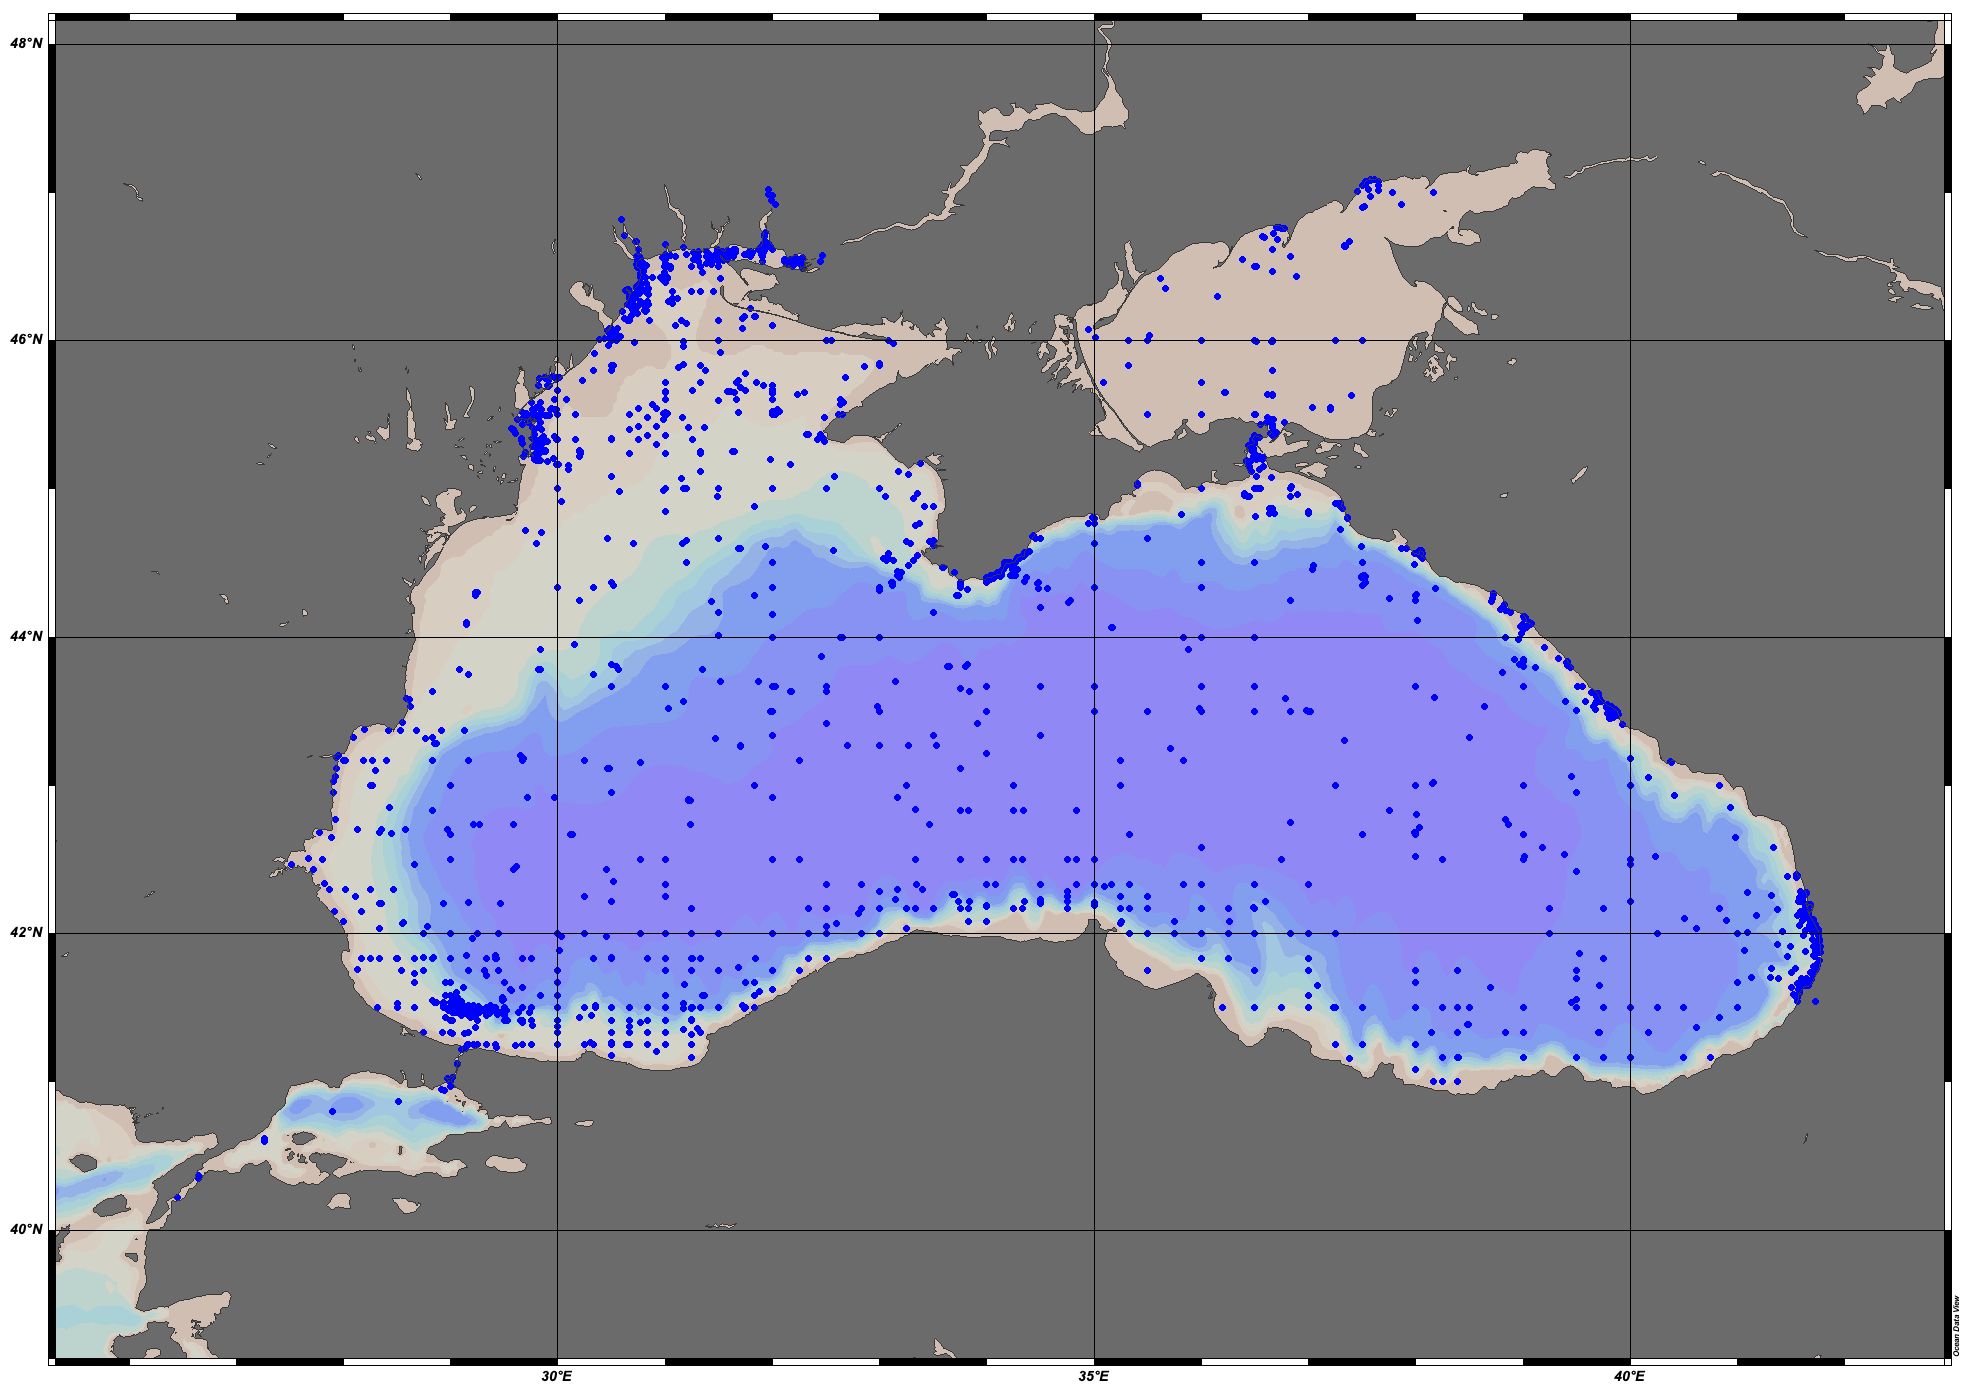
EMODnet Chemistry aims to provide access to marine chemistry datasets and derived data products concerning eutrophication, acidity and contaminants. The importance of the selected substances and other parameters relates to the Marine Strategy Framework Directive (MSFD). This aggregated dataset contains all unrestricted EMODnet Chemistry data on potential hazardous substances, despite the fact that some data might not be related to pollution (e.g. collected by deep corer). Temperature, salinity and additional parameters are included when available. It covers the Black Sea. Data were harmonised and validated by the ‘National Institute for Marine Research and Development "Grigore Antipa" in Romania. The dataset contains water, sediment and biota profiles. The temporal coverage is 1974–2021 for water measurements, 1990–2023 for sediment measurements and 2008–2019 for biota measurements. Regional datasets concerning contaminants are automatically harvested and the resulting collections are harmonised and validated using ODV Software and following a common methodology for all sea regions ( https://doi.org/10.6092/8b52e8d7-dc92-4305-9337-7634a5cae3f4). Parameter names are based on P01 vocabulary, which relates to BODC Parameter Usage Vocabulary and is available at: https://vocab.nerc.ac.uk/search_nvs/P01/. The harmonised dataset can be downloaded as as an ODV spreadsheet, which is composed of a metadata header followed by tab separated values. This spreadsheet can be imported into ODV Software for visualisation (more information can be found at: https://www.seadatanet.org/Software/ODV). In addition, the same dataset is offered also as a txt file in a long/vertical format, in which each P01 measurement is a record line. Additionally, there are a series of columns that split P01 terms into subcomponents (substance, CAS number, matrix...).This transposed format is more adapted to worksheet applications (e.g. LibreOffice Calc).
-
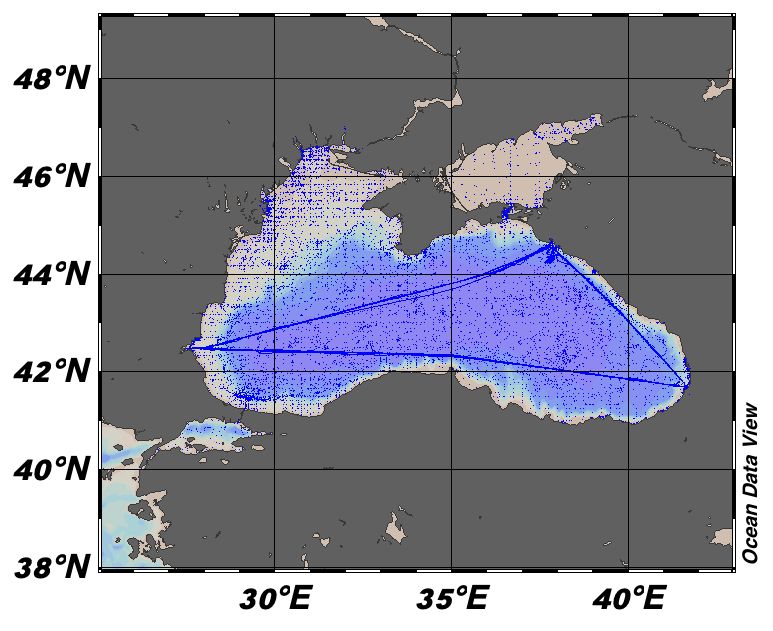
EMODnet Chemistry aims to provide access to marine chemistry datasets and derived data products concerning eutrophication, acidity and contaminants. The importance of the selected substances and other parameters relates to the Marine Strategy Framework Directive (MSFD). This aggregated dataset contains all unrestricted EMODnet Chemistry data on eutrophication and acidity, and covers the Black Sea, Marmara Sea and Sea of Azov. Data were aggregated and quality controlled by 'National Institute for Marine Research and Development 'Grigore Antipa' in Romania. ITS-90 water temperature and water body salinity variables have also been included ('as are') to complete the eutrophication and acidity data. If you use these variables for calculations, please refer to SeaDataNet for the quality flags: https://www.seadatanet.org/Products/Aggregated-datasets. Regional datasets concerning eutrophication and acidity are automatically harvested, and the resulting collections are aggregated and quality controlled using ODV Software and following a common methodology for all sea regions ( https://doi.org/10.13120/8xm0-5m67). Parameter names are based on P35 vocabulary, which relates to EMODnet Chemistry aggregated parameter names and is available at: https://vocab.nerc.ac.uk/search_nvs/P35/. When not present in original data, water body nitrate plus nitrite was calculated by summing all nitrate and nitrite parameters. The same procedure was applied for water body dissolved inorganic nitrogen (DIN), which was calculated by summing all nitrate, nitrite, and ammonium parameters. Concentrations per unit mass were converted to a unit volume using a constant density of 1.25 kg/L. The aggregated dataset can also be downloaded as an ODV collection and spreadsheet, which is composed of a metadata header followed by tab separated values. This spreadsheet can be imported to ODV Software for visualisation (more information can be found at: https://www.seadatanet.org/Software/ODV).
-
Purpose, debit and coordinates of points from where seawater is extracted
-
Annual sea surface water monitoring (chemical, bacteriological analysis)
-
Annual sea surface water monitoring (chemical, bacteriological analysis)
-
Annual sea surface water monitoring (chemical, bacteriological analysis)