 EMODnet Product Catalogue
Hellenic Centre for Marine Research, Institute of Oceanography
Type of resources
Available actions
Topics
Keywords
Contact for the resource
Provided by
Years
Formats
Representation types
Resolution
-
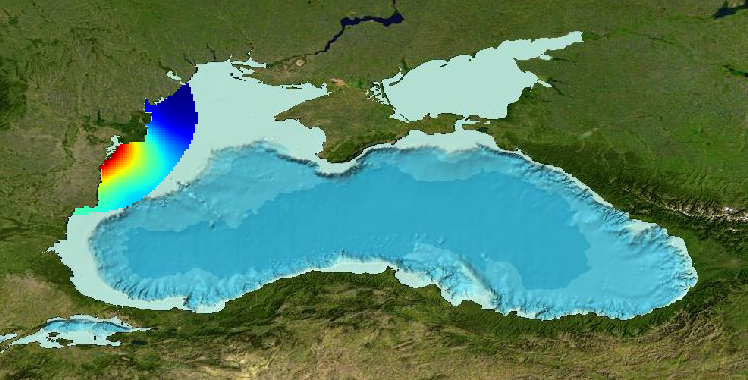
Gridded product for visualization of Water body chlorophyll-a in the Western part of Black Sea generated by DIVA 4.6.11 using all EMODNET Chemistry data from 2000 to 2014. Depth range (IODE standard depths): 0, -5, -10, –20m. DIVA settings: signal-to-noise ratio and correlation length were estimated using data mean distance as a minimum (for L), and both parameters vertically filtered. Background field: the data mean value is subtracted from the data. Detrending of data: no. Advection constraint applied: no. Analysis: logaritmic transformation. Every year of the time dimension corresponds to a 10-year centred average for each season: - winter: December - February, - spring: March - May, - summer: June - August, - autumn: September - November Units: mg/m^3
-
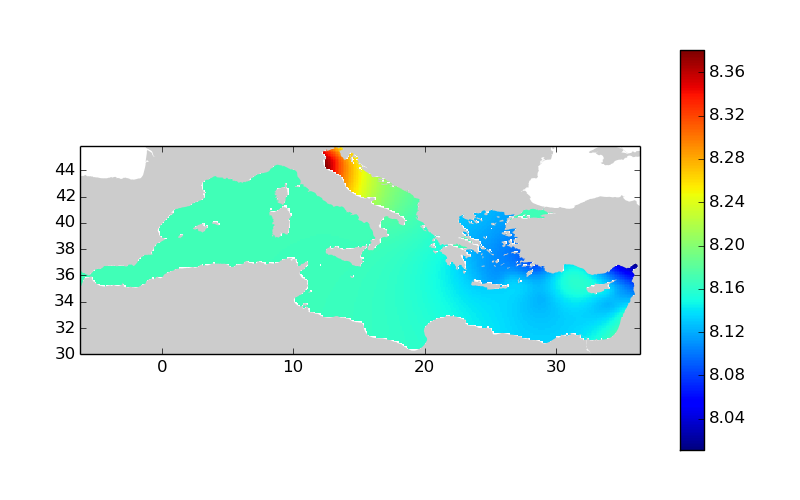
Moving 10-years analysis of pH at Mediterranean Sea for each season : - winter (January-March), - spring (April-June), - summer (July-September), - autumn (October-December). Every year of the time dimension corresponds to the 10-year centered average of each season. Decades span from 1959-1968 until 2005-2014. Observational data span from 1930 to 2014. Depth range (IODE standard depths): -1500.0, -1400.0, -1300.0, -1200.0, -1100.0, -1000.0, -900.0, -800.0, -700.0, -600.0, -500.0, -400.0, -300.0, -250.0, -200.0, -150.0, -125.0, -100.0, -75.0, -50.0, -30.0, -20.0, -10.0, -5.0, -0.0. Data Sources: observational data from SeaDataNet/EMODNet Chemistry Data Network. Description of DIVA analysis: Geostatistical data analysis by DIVA (Data-Interpolating Variational Analysis) tool. Profiles were interpolated at standard depths using weighted parabolic interpolation algorithm (Reiniger and Ross, 1968). GEBCO 1min topography is used for the contouring preparation. Analyzed filed masked using relative error threshold 0.3 and 0.5. DIVA settings: A constant value for signal-to-noise ratio was used equal to 1. Correlation length was optimized and filtered vertically and a seasonally-averaged profile was used. Logarithmic transformation applied to the data prior to the analysis. Background field: the data mean value is subtracted from the data. Detrending of data: no. Advection constraint applied: no. Originators of Italian data sets-List of contributors: o Brunetti Fabio (OGS) o Cardin Vanessa, Bensi Manuel doi:10.6092/36728450-4296-4e6a-967d-d5b6da55f306 o Cardin Vanessa, Bensi Manuel, Ursella Laura, Siena Giuseppe doi:10.6092/f8e6d18e-f877-4aa5-a983-a03b06ccb987 o Cataletto Bruno (OGS) o Cinzia Comici Cinzia (OGS) o Civitarese Giuseppe (OGS) o DeVittor Cinzia (OGS) o Giani Michele (OGS) o Kovacevic Vedrana (OGS) o Mosetti Renzo (OGS) o Solidoro C.,Beran A.,Cataletto B.,Celussi M.,Cibic T.,Comici C.,Del Negro P.,De Vittor C.,Minocci M.,Monti M.,Fabbro C.,Falconi C.,Franzo A.,Libralato S.,Lipizer M.,Negussanti J.S.,Russel H.,Valli G., doi:10.6092/e5518899-b914-43b0-8139-023718aa63f5 o Celio Massimo (ARPA FVG) o Malaguti Antonella (ENEA) o Fonda Umani Serena (UNITS) o Bignami Francesco (ISAC/CNR) o Boldrini Alfredo (ISMAR/CNR) o Marini Mauro (ISMAR/CNR) o Miserocchi Stefano (ISMAR/CNR) o Zaccone Renata (IAMC/CNR) o Lavezza, R., Dubroca, L. F. C., Ludicone, D., Kress, N., Herut, B., Civitarese, G., Cruzado, A., Lefèvre, D., Souvermezoglou, E., Yilmaz, A., Tugrul, S., and Ribera d'Alcala, M.: Compilation of quality controlled nutrient profiles from the Mediterranean Sea, doi:10.1594/PANGAEA.771907, 2011. Units: pH units
-
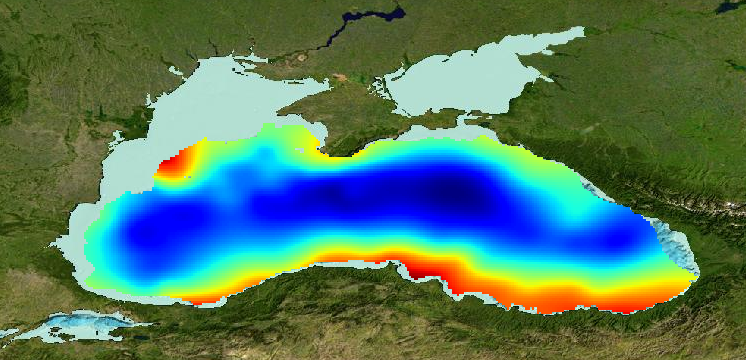
Gridded product for visualization of Water body dissolved oxygen concentration in the Black Sea generated by DIVA 4.6.11 using all EMODNET Chemistry data from 1970 to 2014. Depth range (IODE standard depths): 0 – 250m. DIVA settings: signal-to-noise ratio and correlation length were estimated using data mean distance as a minimum (for L), and both parameters vertically filtered. Background field: the data mean value is subtracted from the data. Detrending of data: no. Advection constraint applied: no. Every year of the time dimension corresponds to a 10-year centred average for each season: - winter: December - February, - spring: March - May, - summer: June - August, - autumn: September – November Units: umol/l
-

Moving 10-years analysis of chlorophyll-a at Mediterranean Sea for each season : - winter (January-March), - spring (April-June), - summer (July-September), - autumn (October-December). Every year of the time dimension corresponds to the 10-year centered average of each season. Decades span from 1972-1981 until 2006-2015. Observational data span from 1911 to 2015. Depth range (IODE standard depths): -2500.0, -2000.0, -1750.0, -1500.0, -1400.0, -1300.0, -1200.0, -1100.0, -1000.0, -900.0, -800.0, -700.0, -600.0, -500.0, -400.0, -300.0, -250.0, -200.0, -150.0, -125.0, -100.0, -75.0, -50.0, -30.0, -20.0, -10.0, -5.0, -0.0. Data Sources: observational data from SeaDataNet/EMODNet Chemistry Data Network. Description of DIVA analysis: Geostatistical data analysis by DIVA (Data-Interpolating Variational Analysis) tool. Profiles were interpolated at standard depths using weighted parabolic interpolation algorithm (Reiniger and Ross, 1968). GEBCO 1min topography is used for the contouring preparation. Analyzed filed masked using relative error threshold 0.3 and 0.5. DIVA settings: A constant value for signal-to-noise ratio was used equal to 1. Correlation length was optimized and filtered vertically and a seasonally-averaged profile was used. Logarithmic transformation applied to the data prior to the analysis. Background field: the data mean value is subtracted from the data. Detrending of data: no. Advection constraint applied: no. Originators of Italian data sets-List of contributors: o Brunetti Fabio (OGS) o Cardin Vanessa, Bensi Manuel doi:10.6092/36728450-4296-4e6a-967d-d5b6da55f306 o Cardin Vanessa, Bensi Manuel, Ursella Laura, Siena Giuseppe doi:10.6092/f8e6d18e-f877-4aa5-a983-a03b06ccb987 o Cataletto Bruno (OGS) o Cinzia Comici Cinzia (OGS) o Civitarese Giuseppe (OGS) o DeVittor Cinzia (OGS) o Giani Michele (OGS) o Kovacevic Vedrana (OGS) o Mosetti Renzo (OGS) o Solidoro C.,Beran A.,Cataletto B.,Celussi M.,Cibic T.,Comici C.,Del Negro P.,De Vittor C.,Minocci M.,Monti M.,Fabbro C.,Falconi C.,Franzo A.,Libralato S.,Lipizer M.,Negussanti J.S.,Russel H.,Valli G., doi:10.6092/e5518899-b914-43b0-8139-023718aa63f5 o Celio Massimo (ARPA FVG) o Malaguti Antonella (ENEA) o Fonda Umani Serena (UNITS) o Bignami Francesco (ISAC/CNR) o Boldrini Alfredo (ISMAR/CNR) o Marini Mauro (ISMAR/CNR) o Miserocchi Stefano (ISMAR/CNR) o Zaccone Renata (IAMC/CNR) o Lavezza, R., Dubroca, L. F. C., Ludicone, D., Kress, N., Herut, B., Civitarese, G., Cruzado, A., Lefèvre, D., Souvermezoglou, E., Yilmaz, A., Tugrul, S., and Ribera d'Alcala, M.: Compilation of quality controlled nutrient profiles from the Mediterranean Sea, doi:10.1594/PANGAEA.771907, 2011. Units: mg/m^3
-
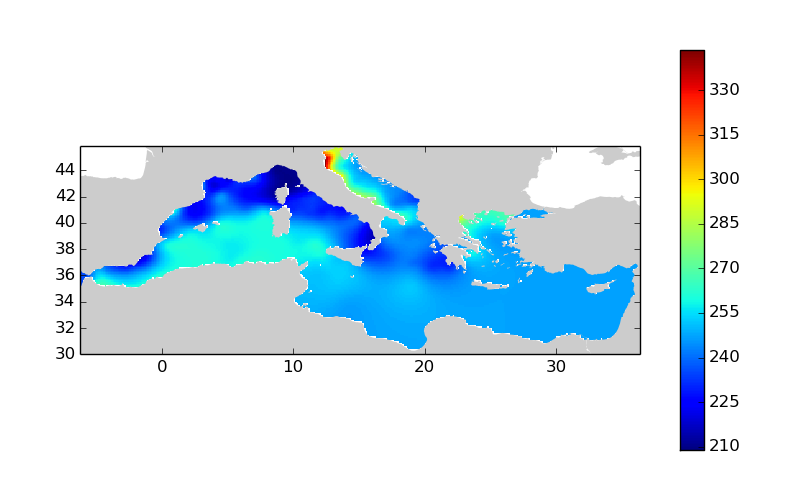
Moving 10-years analysis of dissolved_oxygen_concentration at Mediterranean Sea for each season : - winter (January-March), - spring (April-June), - summer (July-September), - autumn (October-December). Every year of the time dimension corresponds to the 10-year centered average of each season. Decades span from 1971-1980 until 2006-2015. Observational data span from 1911 to 2015. Depth range (IODE standard depths):-3000.0, -2500.0, -2000.0, -1750.0, -1500.0, -1400.0, -1300.0, -1200.0, -1100.0, -1000.0, -900.0, -800.0, -700.0, -600.0, -500.0, -400.0, -300.0, -250.0, -200.0, -150.0, -125.0, -100.0, -75.0, -50.0, -30.0, -20.0, -10.0, -5.0, -0.0. Data Sources: observational data from SeaDataNet/EMODNet Chemistry Data Network. Description of DIVA analysis: Geostatistical data analysis by DIVA (Data-Interpolating Variational Analysis) tool. Profiles were interpolated at standard depths using weighted parabolic interpolation algorithm (Reiniger and Ross, 1968). GEBCO 1min topography is used for the contouring preparation. Analyzed filed masked using relative error threshold 0.3 and 0.5. DIVA settings: A constant value for signal-to-noise ratio was used equal to 1. Correlation length was optimized and filtered vertically and a seasonally-averaged profile was used. Logarithmic transformation applied to the data prior to the analysis. Background field: the data mean value is subtracted from the data. Detrending of data: no. Advection constraint applied: no. Originators of Italian data sets-List of contributors: o Brunetti Fabio (OGS) o Cardin Vanessa, Bensi Manuel doi:10.6092/36728450-4296-4e6a-967d-d5b6da55f306 o Cardin Vanessa, Bensi Manuel, Ursella Laura, Siena Giuseppe doi:10.6092/f8e6d18e-f877-4aa5-a983-a03b06ccb987 o Cataletto Bruno (OGS) o Cinzia Comici Cinzia (OGS) o Civitarese Giuseppe (OGS) o DeVittor Cinzia (OGS) o Giani Michele (OGS) o Kovacevic Vedrana (OGS) o Mosetti Renzo (OGS) o Solidoro C.,Beran A.,Cataletto B.,Celussi M.,Cibic T.,Comici C.,Del Negro P.,De Vittor C.,Minocci M.,Monti M.,Fabbro C.,Falconi C.,Franzo A.,Libralato S.,Lipizer M.,Negussanti J.S.,Russel H.,Valli G., doi:10.6092/e5518899-b914-43b0-8139-023718aa63f5 o Celio Massimo (ARPA FVG) o Malaguti Antonella (ENEA) o Fonda Umani Serena (UNITS) o Bignami Francesco (ISAC/CNR) o Boldrini Alfredo (ISMAR/CNR) o Marini Mauro (ISMAR/CNR) o Miserocchi Stefano (ISMAR/CNR) o Zaccone Renata (IAMC/CNR) o Lavezza, R., Dubroca, L. F. C., Ludicone, D., Kress, N., Herut, B., Civitarese, G., Cruzado, A., Lefèvre, D., Souvermezoglou, E., Yilmaz, A., Tugrul, S., and Ribera d'Alcala, M.: Compilation of quality controlled nutrient profiles from the Mediterranean Sea, doi:10.1594/PANGAEA.771907, 2011. Units: umol/l
-
These data were collected during the period of 27/11/2020 and 18/11/2022 from the Heraklion Coastal Buoy station North of Crete. The dataset is comprised of samples collected and analysed under specific dates from this station while being part of the European project: "JERICO S3 (Joint European Research Infrastructure of Coastal Observatories: Science, Service, Sustainability)".
-
Coastal marine sediments receive intensive stress from urbanization and industrialization, which is manifested by increased contents of heavy metals and organic pollutants. Saronikos Gulf and the small embayment of Elefsis, stretch along the coast of the greater Athens and Pireaus port, the most urbanized and industrialized areas in Greece. Here we present the data of a 20-years geochemical record on grain-size, organic carbon, and major and trace elements contents of the Saronikos Gulf sediments. A total of 216 sediment samples were collected within the period of 1999 to 2018 from the four sub-sectors of the gulf, namely, the Elefsis Bay, the Inner, Outer, and Western (Megara and Epidavros basin) Saronikos Gulf. Additionally, at least one core was obtained from each sub-sector. Sediments deposited at pre-industrial periods were recognized by 14C and 210Pb datings, and served for establishing regionalized, background levels of metals. Factor analysis was conducted to reveal the inter-parametric relationships, thus their common sources, as well as transport and deposition pathways. Then, Enrichment Factors and the multi-elemental Modified Pollution Index (MPI) were calculated to assess the current environmental status of the sediments. Data of sampling sites with at least a five-year record, were assessed for temporal trends, to explore whether sustained, increasing or decreasing trends of the MPI are observed. The dataset and analyses presented here support the research article entitled Geochemistry of major and trace elements in surface sediments of the Saronikos Gulf (Greece): assessment of contamination between 1999 and 2018 by Karageorgis A.P., Botsou F., Kaberi H., and Iliakis S., https://doi.org/10.1016/j.scitotenv.2020.137046
-
Mean Integrated concentrations of oceanographic parameters in the water column and sediment data in the coastal zone of the Red Sea and the Arabian Gulf (Saudi Arabia) Important Note: This submission has been initially submitted to SEA scieNtific Open data Edition (SEANOE) publication service and received the recorded DOI. The metadata elements have been further processed (refined) in EMODnet Ingestion Service in order to conform with the Data Submission Service specifications.
-
KRIPIS Project Nutrients, Dissolved Oxygen and Chlorophyll-A data in Aegean and Ionian Sea, 2014-2015
-
PERSEUS Project Nutrients and DO2 Data in North Aegean Sea 2013