 EMODnet Product Catalogue
500000
Type of resources
Available actions
Topics
Keywords
Contact for the resource
Provided by
Years
Formats
Representation types
Update frequencies
status
Scale 1:
Resolution
-
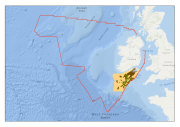
This dataset is derived from the findings of a dedicated survey by JNCC in partnership with Cefas to Wight Barfleur Reef Special Area of Conservation. The dedicated multidisciplinary survey (survey code CEND 03/13) was conducted in March 2013 aboard the RV Cefas Endeavour with the principal aim of collecting information to better delineate the extent of Annex I reef (both bedrock and stony subtypes) within the area, which will be used to assist with the development of management advice in relation to the areas and features designated for conservation. The survey was successful in acquiring multibeam, sidescan and ground-truthing data of the seabed. Although full data coverage of the whole cSAC was not possible in the time available, five areas were targeted for intensive survey, with 100% acoustic data coverage of these areas.
-
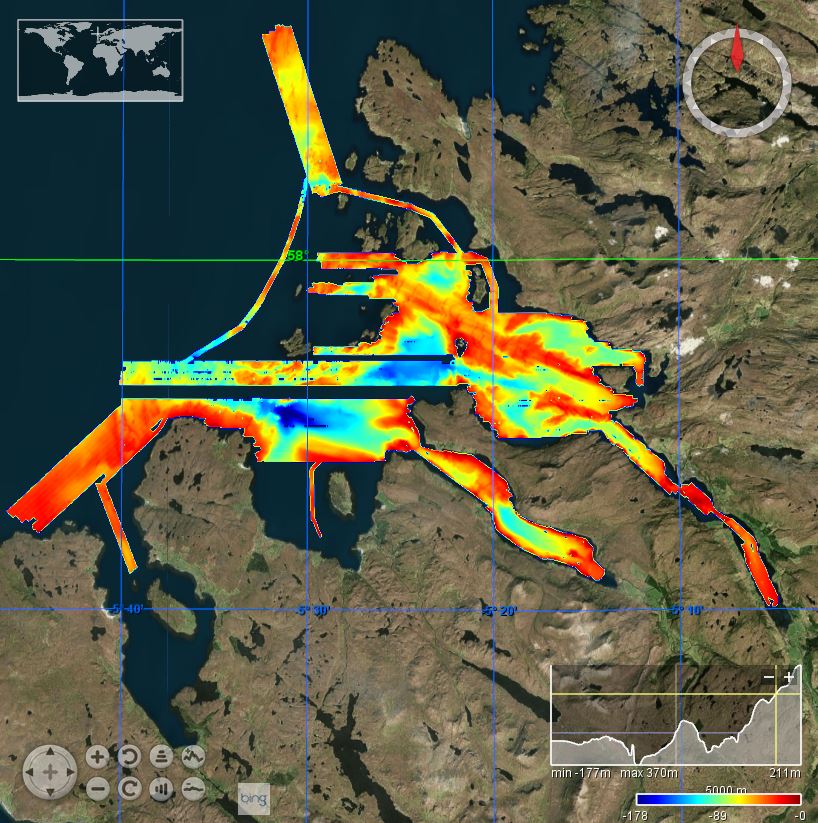
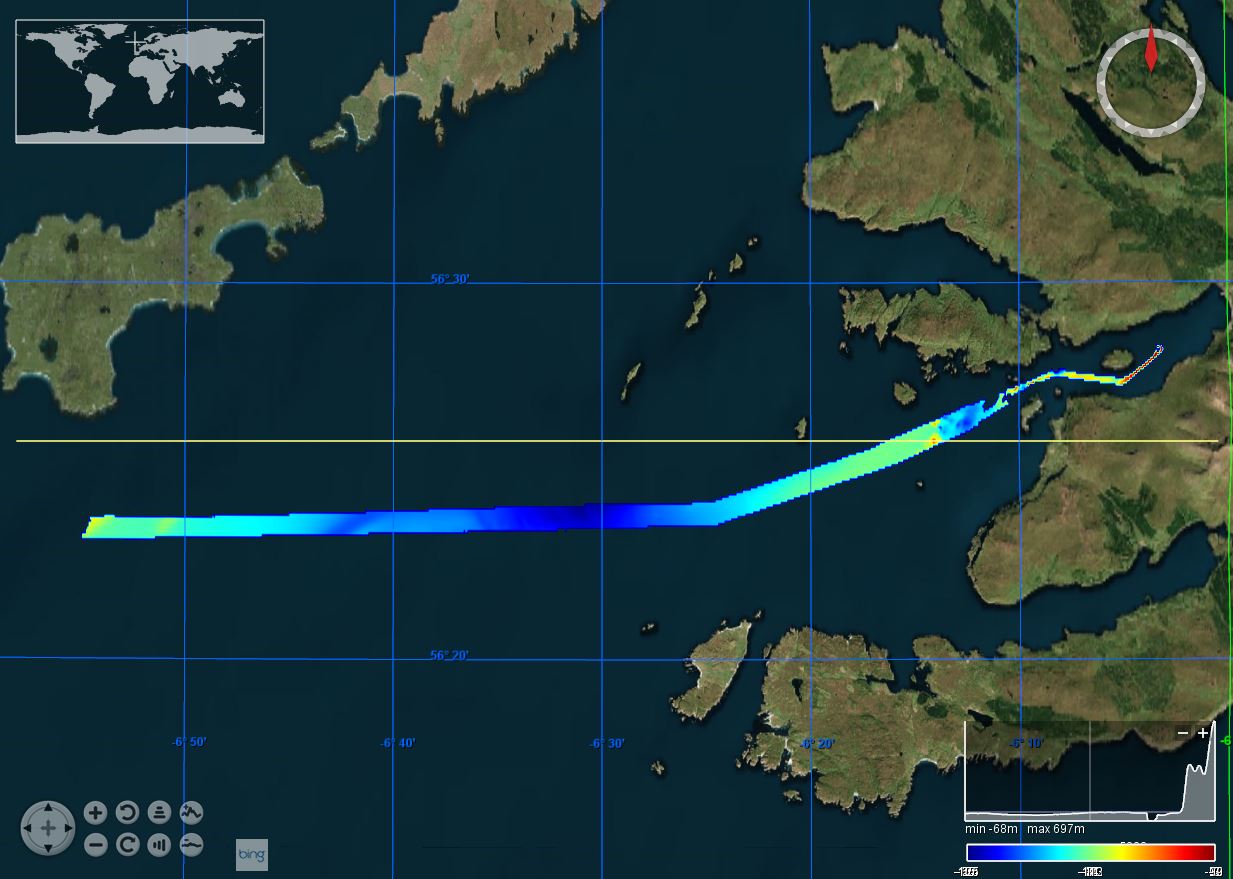
This BGS marine geophysical survey took place in July 2005 in the Summer Isles region aboard the RV Calanus. The survey was a part of the BGS Offshore Mapping and Modelling Project, North Atlantic Correlation. Subsurface data were gathered using a Surface Tow Boomer and a very detailed swath coverage of the Summer Islands region together with Loch Broom and Little Loch Broom was achieved using a Geoacoustics GeoSwath system supplied and operated by Fathoms Ltd.
-
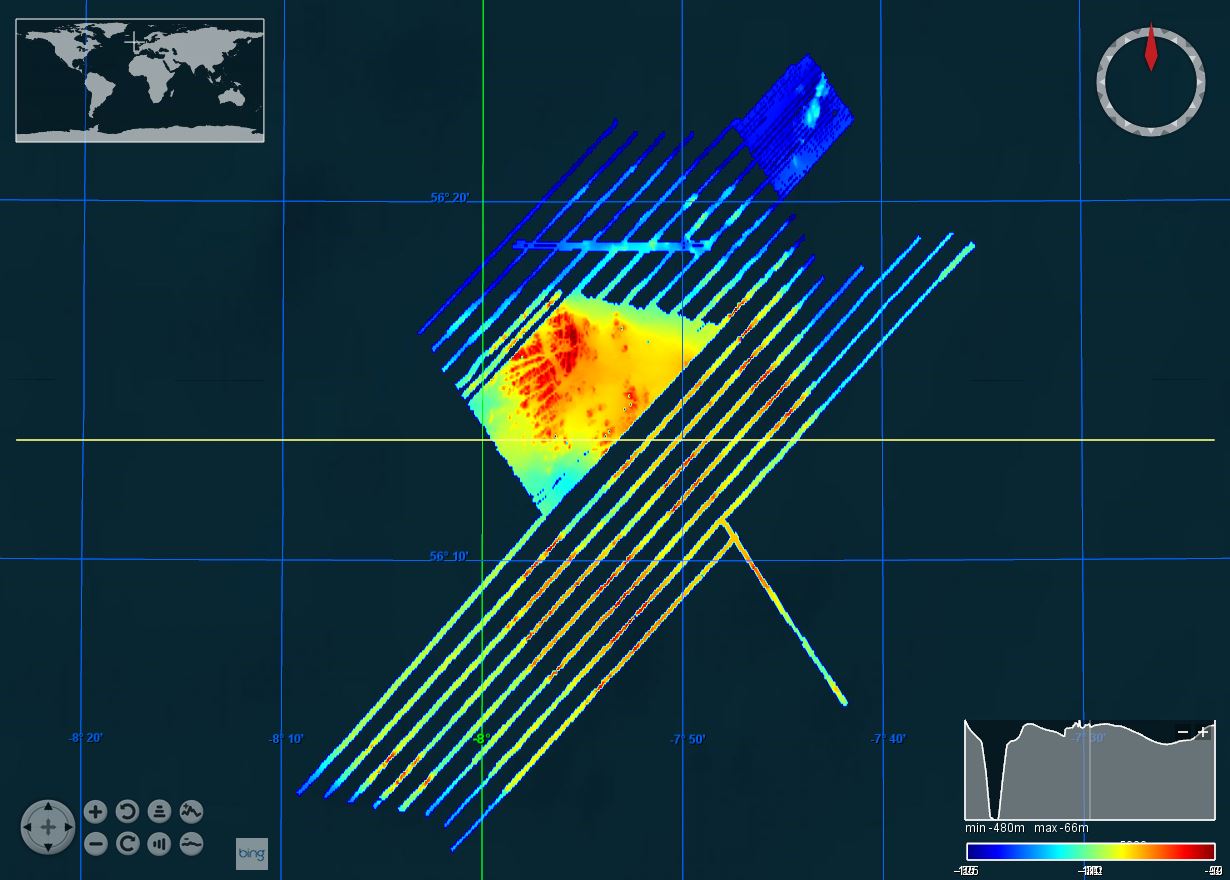
This marine multibeam and sampling survey was undertaken on Stanton Banks by the Joint Nature Conservation Committee (JNCC), Centre for Environment, Fisheries & Aquaculture Science (CEFAS) and British Geological Survey (BGS) in July/August 2012 on board the Northern Lighthouse Board vessel NLV Polestar. The survey was led by the JNCC and included a team from CEFAS who were involved in benthic sampling. A combination of surveys methods were employed, including seabed imagery (drop camera), day grabs and rock dredges. BGS collected sea floor multibeam bathymetry data using a Kongsberg EM3002D multibeam system.
-
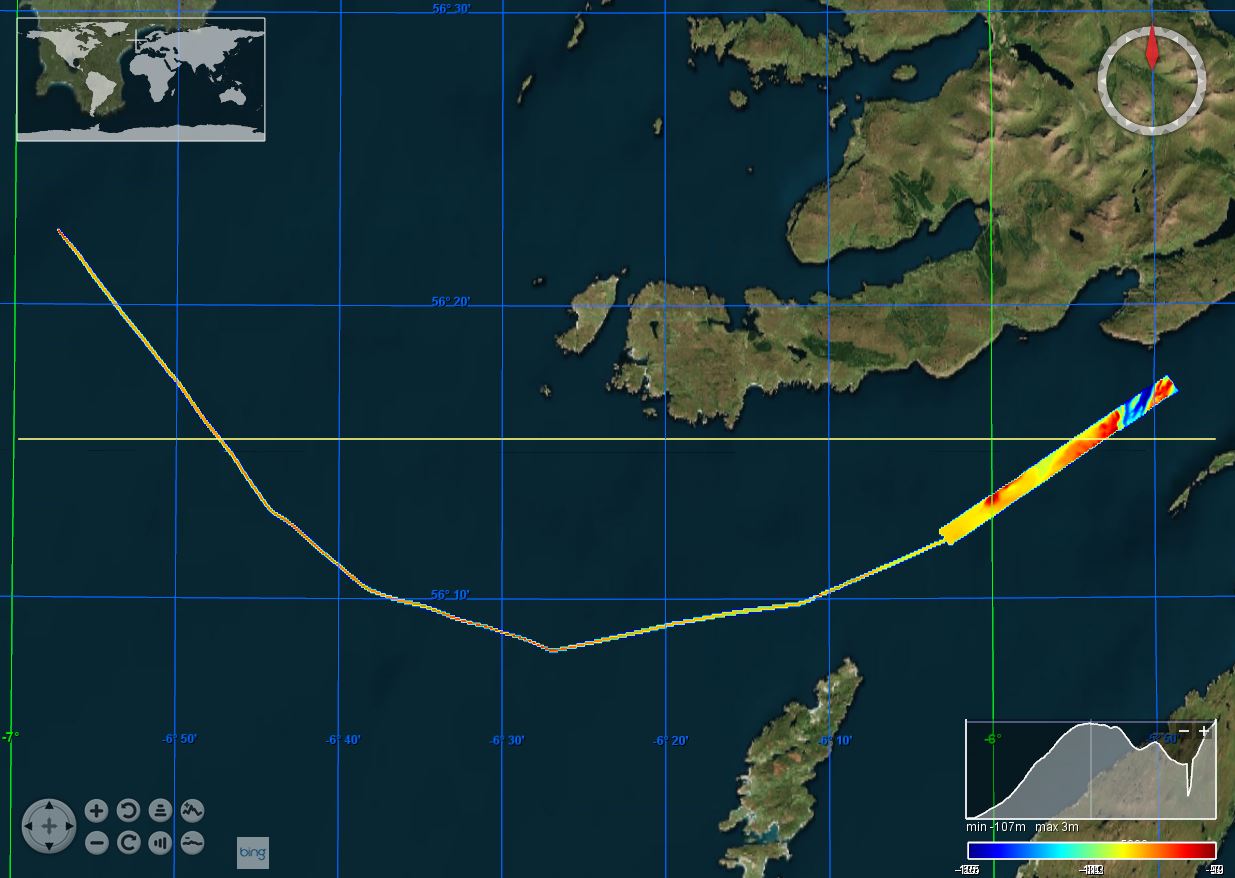
This marine geophysical and multibeam survey was undertaken by British Geological Survey on behalf of Marine Scotland utilising the Northern Lighthouse Board vessel NLV Polestar, it took place in July/August 2012 off south-west Tiree. The purpose was to further our understanding of Scotland’s marine environment, increase the efficiency of use of public resources, enhance the safety of those at sea and contribute to new policy priorities such as marine protected areas, wider conservation measures, marine planning and renewable. Bathymetric data was collected using a Kongsberg EM3002D dual head, multibeam system. Data was acquired using a Kongsberg SIS operating system, logging raw .ALL files. This data was processed offline by BGS using CARIS HIPS and SIPS 7.1 SP2.
-
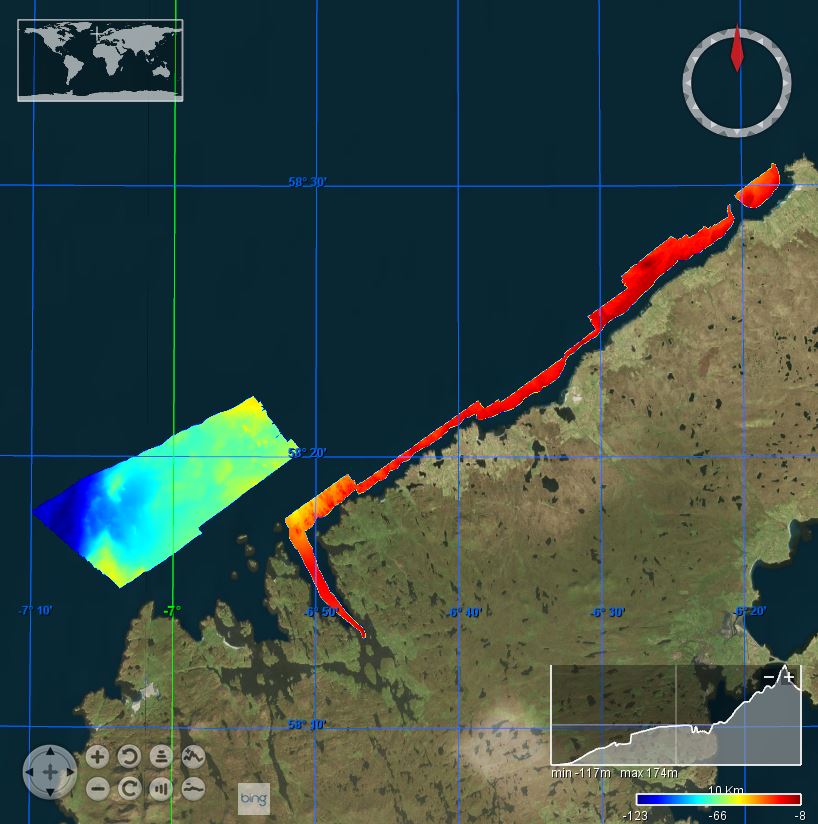
This marine multibeam survey took place in August/September 2011 in the area of Lewis on board the Northern Lighthouse Board vessel NLV Pole Star. The survey was carried out by the British Geological Survey (BGS) on behalf of Marine Scotland. Sea floor bathymetry data were collected using a Kongsberg EM3002D multibeam system.
-
This marine geophysical and multibeam survey was undertaken by British Geological Survey on behalf of Marine Scotland utilising the Northern Lighthouse Board vessel NLV Polestar, it took place in July/August 2012 off south-west Tiree. The purpose was to further our understanding of Scotland’s marine environment, increase the efficiency of use of public resources, enhance the safety of those at sea and contribute to new policy priorities such as marine protected areas, wider conservation measures, marine planning and renewable. Bathymetric data was collected using a Kongsberg EM3002D dual head, multibeam system. Data was acquired using a Kongsberg SIS operating system, logging raw .ALL files. This data was processed offline by BGS using CARIS HIPS and SIPS 7.1 SP2.
-
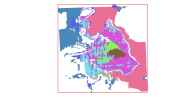
This dataset contains the main habitats maps from the SCI (Site of Community Importance) ÔÇ£Banco de GaliciaÔÇØ. The Galician Bank is a deep underwater mountain located at the northwest of the Iberian Peninsula, 180 km from the Galician coast (in the north-east Atlantic Ocean). Its summit is located at a depth of between 650 and 1,500 metres. Its steep slopes descend from the summit to the abyssal plains located 4,000 meters below sea level. This study was supported by the INDEMARES-LIFE+ Project, EC contract INDEMARES-LIFE+ (07/NAT/E/000732): Inventory and Designation of the Natura 2000 network in marine areas of the Spanish State (www.indemares.es/en). This work was coordinated by the Spanish Institute of Oceanography (IEO, www.ieo.es) and the Biodiversity Foundation (www.fundacion-biodiversidad.es). The interpretation has been made possible thanks to direct and indirect samplings and geophysical data from campaigns "ECOMARG09", "INDEMARES_BANGAL0810", "INDEMARES_BANGAL0711" and "RADPROF0912". Habitats are classified according to EUNIS nomenclature and the List of Marine Habitats in Spain (LPRE, that itÔÇÖs classified hierarchically and was completed and published in March 2013).
-
Data on marine habitats for the Celtic Sea generated from the collation of historical habitat data by Aquafact Environmental Consultants as part of the Strategic Environmental Assessment of the Irish and Celtic Seas, and published in the IOSEA 4 Report. The original classes assigned to the data were translated to the EUNIS habitat classification system as part of the MESH Atlantic project.
-

Data on marine habitats for the Irish Sea generated from the collation of historical sediment and biological data by Joint Nature Conservation Committee as part of the Irish Sea Pilot Project. The original classes assigned to the data were translated to the EUNIS habitat classification system as part of the MESH Atlantic project.
-
EUNIS-translated Indicative biotopes for the Gwynt y Mor study area determined from the analysis of grab samples from the site between 2002-2004. Data originally in Classification system of UK and Ireland, translated to EUNIS at JNCC, 2013. Original non-eunis data retreived from the Crown Estate http://www.marinedataexchange.co.uk/ItemDetails.aspx?id=10609