 EMODnet Product Catalogue
Geoscientific information
Type of resources
Available actions
Topics
Keywords
Contact for the resource
Provided by
Years
Formats
Representation types
Update frequencies
status
Service types
Scale 1:
Resolution
-

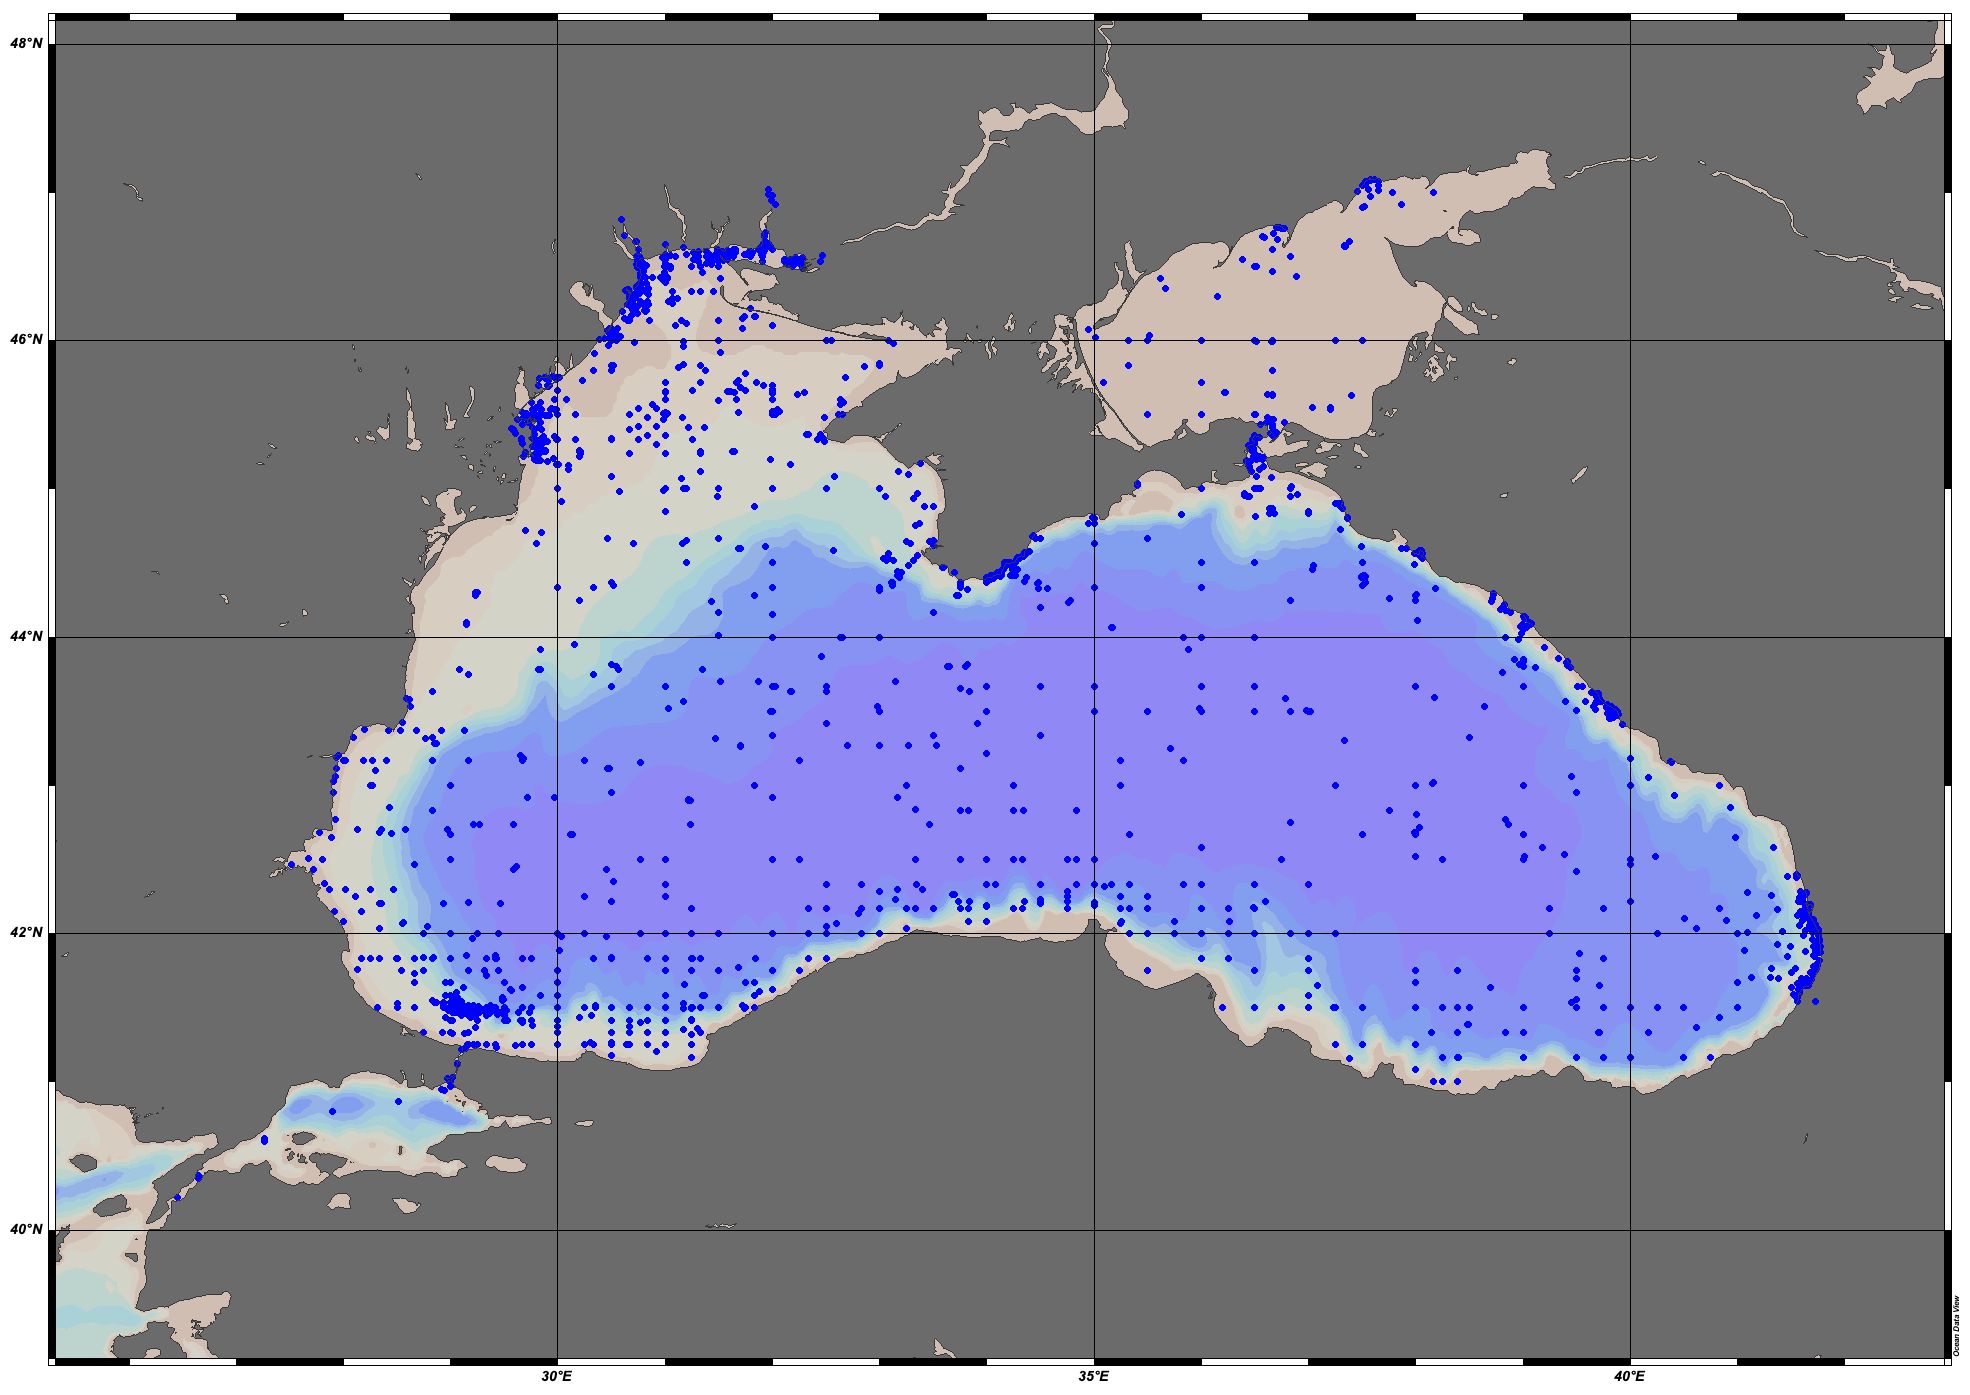
EMODnet Chemistry aims to provide access to marine chemistry datasets and derived data products concerning eutrophication, acidity and contaminants. The importance of the selected substances and other parameters relates to the Marine Strategy Framework Directive (MSFD). This aggregated dataset contains all unrestricted EMODnet Chemistry data on potential hazardous substances, despite the fact that some data might not be related to pollution (e.g. collected by deep corer). Temperature, salinity and additional parameters are included when available. It covers the Black Sea. Data were harmonised and validated by the ‘National Institute for Marine Research and Development "Grigore Antipa" in Romania. The dataset contains water, sediment and biota profiles. The temporal coverage is 1974–2021 for water measurements, 1990–2023 for sediment measurements and 2008–2019 for biota measurements. Regional datasets concerning contaminants are automatically harvested and the resulting collections are harmonised and validated using ODV Software and following a common methodology for all sea regions ( https://doi.org/10.6092/8b52e8d7-dc92-4305-9337-7634a5cae3f4). Parameter names are based on P01 vocabulary, which relates to BODC Parameter Usage Vocabulary and is available at: https://vocab.nerc.ac.uk/search_nvs/P01/. The harmonised dataset can be downloaded as as an ODV spreadsheet, which is composed of a metadata header followed by tab separated values. This spreadsheet can be imported into ODV Software for visualisation (more information can be found at: https://www.seadatanet.org/Software/ODV). In addition, the same dataset is offered also as a txt file in a long/vertical format, in which each P01 measurement is a record line. Additionally, there are a series of columns that split P01 terms into subcomponents (substance, CAS number, matrix...).This transposed format is more adapted to worksheet applications (e.g. LibreOffice Calc).
-
<p>These data are Bayesian Additive Regression Tree model annual predictions for habitat suitability of marine fish species across a range of body sizes and belonging to different feeding guilds from 2010 to 2095 in 5 year intervals in the northeast Atlantic shelf seas. Feeding guilds were allocated based on classifications following Thompson <i>et al</i>. (2020).</p>
-
Global Ocean Climatology - Temperature and Salinity Climatology V2 The climatology considers temperature and salinity profiles from Conductivity Depth Temperature (CTD), Ocean station data (OSD) and Moored buoy data (MRB) along with Profiling Floats (PFL) from 1900 to 2017. The gridded fields are computed using DIVAnd (Data Interpolating Variational Analysis) version 2.3.1. Regional climatologies are available in SeaDataNet reference: Kanwal Shahzadi , Nadia Pinardi , Vladislav Lyubartsev , Marco zavatarelli , Simona simoncelli . Global Ocean Climatology - Temperature and Salinity Climatology V2.
-
EMODnet Chemistry aims to provide access to marine chemistry datasets and derived data products concerning eutrophication, acidity and contaminants. The importance of the selected substances and other parameters relates to the Marine Strategy Framework Directive (MSFD). This aggregated dataset contains all unrestricted EMODnet Chemistry data on potential hazardous substances, despite the fact that some data might not be related to pollution (e.g. collected by deep corer). Temperature, salinity and additional parameters are included when available. It covers the Black Sea. Data were harmonised and validated by the ‘National Institute for Marine Research and Development "Grigore Antipa" in Romania. The dataset contains water, sediment and biota profiles. The temporal coverage is 1974–2021 for water measurements, 1990–2022 for sediment measurements and 2008–2019 for biota measurements. Regional datasets concerning contaminants are automatically harvested and the resulting collections are harmonised and validated using ODV Software and following a common methodology for all sea regions ( https://doi.org/10.6092/8b52e8d7-dc92-4305-9337-7634a5cae3f4). Parameter names are based on P01 vocabulary, which relates to BODC Parameter Usage Vocabulary and is available at: https://vocab.nerc.ac.uk/search_nvs/P01/. The harmonised dataset can be downloaded as as an ODV spreadsheet, which is composed of a metadata header followed by tab separated values. This spreadsheet can be imported into ODV Software for visualisation (more information can be found at: https://www.seadatanet.org/Software/ODV). In addition, the same dataset is offered also as a txt file in a long/vertical format, in which each P01 measurement is a record line. Additionally, there are a series of columns that split P01 terms into subcomponents (substance, CAS number, matrix...).This transposed format is more adapted to worksheet applications (e.g. LibreOffice Calc).
-
EMODnet Physics - Collection of total chlorophyll (CHLT) TimeSeries - MultiPointTimeSeriesObservation
-
EMODnet Physics - Collection of sea temperature (TEMP) Profiles - MultiPointProfilesObservation
-
EMODnet Physics - Collection of sea density (sigma-theta) (DENS) TimeSeries - MultiPointTimeSeriesObservation
-
EMODnet Physics - Collection of sea temperature (TEMP) TimeSeries - MultiPointTimeSeriesObservation
-
EMODnet Physics - Collection of dissolved oxygen (DOXY) TimeSeries - MultiPointTimeSeriesObservation
-
EMODnet Physics - Collection of river flow rate (RVFL) TimeSeries - MultiPointTimeSeriesObservation