 EMODnet Product Catalogue
North Sea
Type of resources
Available actions
Topics
Keywords
Contact for the resource
Provided by
Years
Formats
Representation types
Update frequencies
status
Scale 1:
Resolution
-
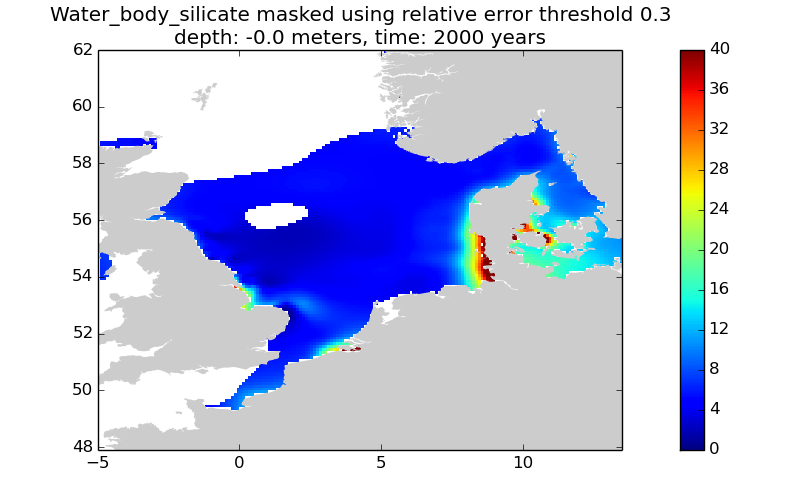
This gridded product visualizes 1960 - 2014 water body silicate concentration (umol/l) in the North Sea domain, for each season (winter: December – February; spring: March – May; summer: June – August; autumn: September – November). It is produced as a Diva 4D analysis, version 4.6.9: a reference field of all seasonal data between 1960-2014 was used; results were logit transformed to avoid negative/underestimated values in the interpolated results; error threshold masks L1 (0.3) and L2 (0.5) are included as well as the unmasked field. Every step of the time dimension corresponds to a 10-year moving average for each season. The depth dimension allows visualizing the gridded field at various depths.
-
EMODnet Chemistry aims to provide access to marine chemistry data sets and derived data products concerning eutrophication, ocean acidification and contaminants. The chemicals chosen reflect importance to the Marine Strategy Framework Directive (MSFD). This regional aggregated dataset contains all unrestricted EMODnet Chemistry data on contaminants (59 parameters), and covers the North Sea with 34978 CDI records divided per matrices: 3909 biota time series, 28071 water profiles, 2998 sediment profiles. Vertical profiles temporal range is from 1970-02-17 to 2017-10-26. Time series temporal range is from 1979-02-26 to 2017-02-28. Data were aggregated and quality controlled by ‘Aarhus University, Department of Bioscience, Marine Ecology Roskilde from Denmark. Regional datasets concerning contaminants are automatically harvested. Parameter names in these datasets are based on P01, BODC Parameter Usage Vocabulary, which is available at: http://seadatanet.maris2.nl/bandit/browse_step.php . Each measurement value has a quality flag indicator. The resulting data collections for each Sea Basin are harmonised, and the collections are quality controlled by EMODnet Chemistry Regional Leaders using ODV Software and following a common methodology for all Sea Regions. Harmonisation means that: (1) unit conversion is carried out to express contaminant concentrations with a limited set of measurement units (according to EU directives 2013/39/UE; Comm. Dec. EU 2017/848) and (2) merging of variables described by different “local names” ,but corresponding exactly to the same concepts in BODC P01 vocabulary. The harmonised dataset can be downloaded as ODV spreadsheet (TXT file), which is composed of metadata header followed by tab separated values. This worksheet can be imported to ODV Software for visualisation (More information can be found at: https://www.seadatanet.org/Software/ODV ). The same dataset is offered also as XLSX file in a long/vertical format, in which each P01 measurement is a record line. Additionally, there are a series of columns that split P01 terms in subcomponents (measure, substance, CAS number, matrix...).This transposed format is more adapted to worksheet applications users (e.g. LibreOffice Calc). The 59 parameter names in this metadata record are based on P02, SeaDataNet Parameter Discovery Vocabulary, which is available at: http://seadatanet.maris2.nl/v_bodc_vocab_v2/vocab_relations.asp?lib=P02 . Detailed documentation will be published soon. The original datasets can be searched and downloaded from EMODnet Chemistry Download Service: https://emodnet-chemistry.maris.nl/search
-
GEMS Survey Ltd. (GEMS) were contracted by Forewind Limited to undertake a bathymetric and geophysical survey of the Tranche A development area and two met mast locations (which were later revised) within the Dogger Bank Zone, in addition to a cable reconnaissance from Tranche A to the Yorkshire coastline. This survey was carried out between 8 July 2010 and 26 December 2010. The primary objectives of the survey were to produce sufficiently high resolution bathymetric and geophysical data and interpretations to allow regional interpretation for planning and modelling purposes; for met mast design to commence and to provide high quality data to inform further benthic and environmental surveys. GEMS supplied interpreted datasets compatible with ESRI ArcGIS software. The GIS data included bathymetry, sidescan sonar mosaics, seabed features, sediments and obstructions.
-
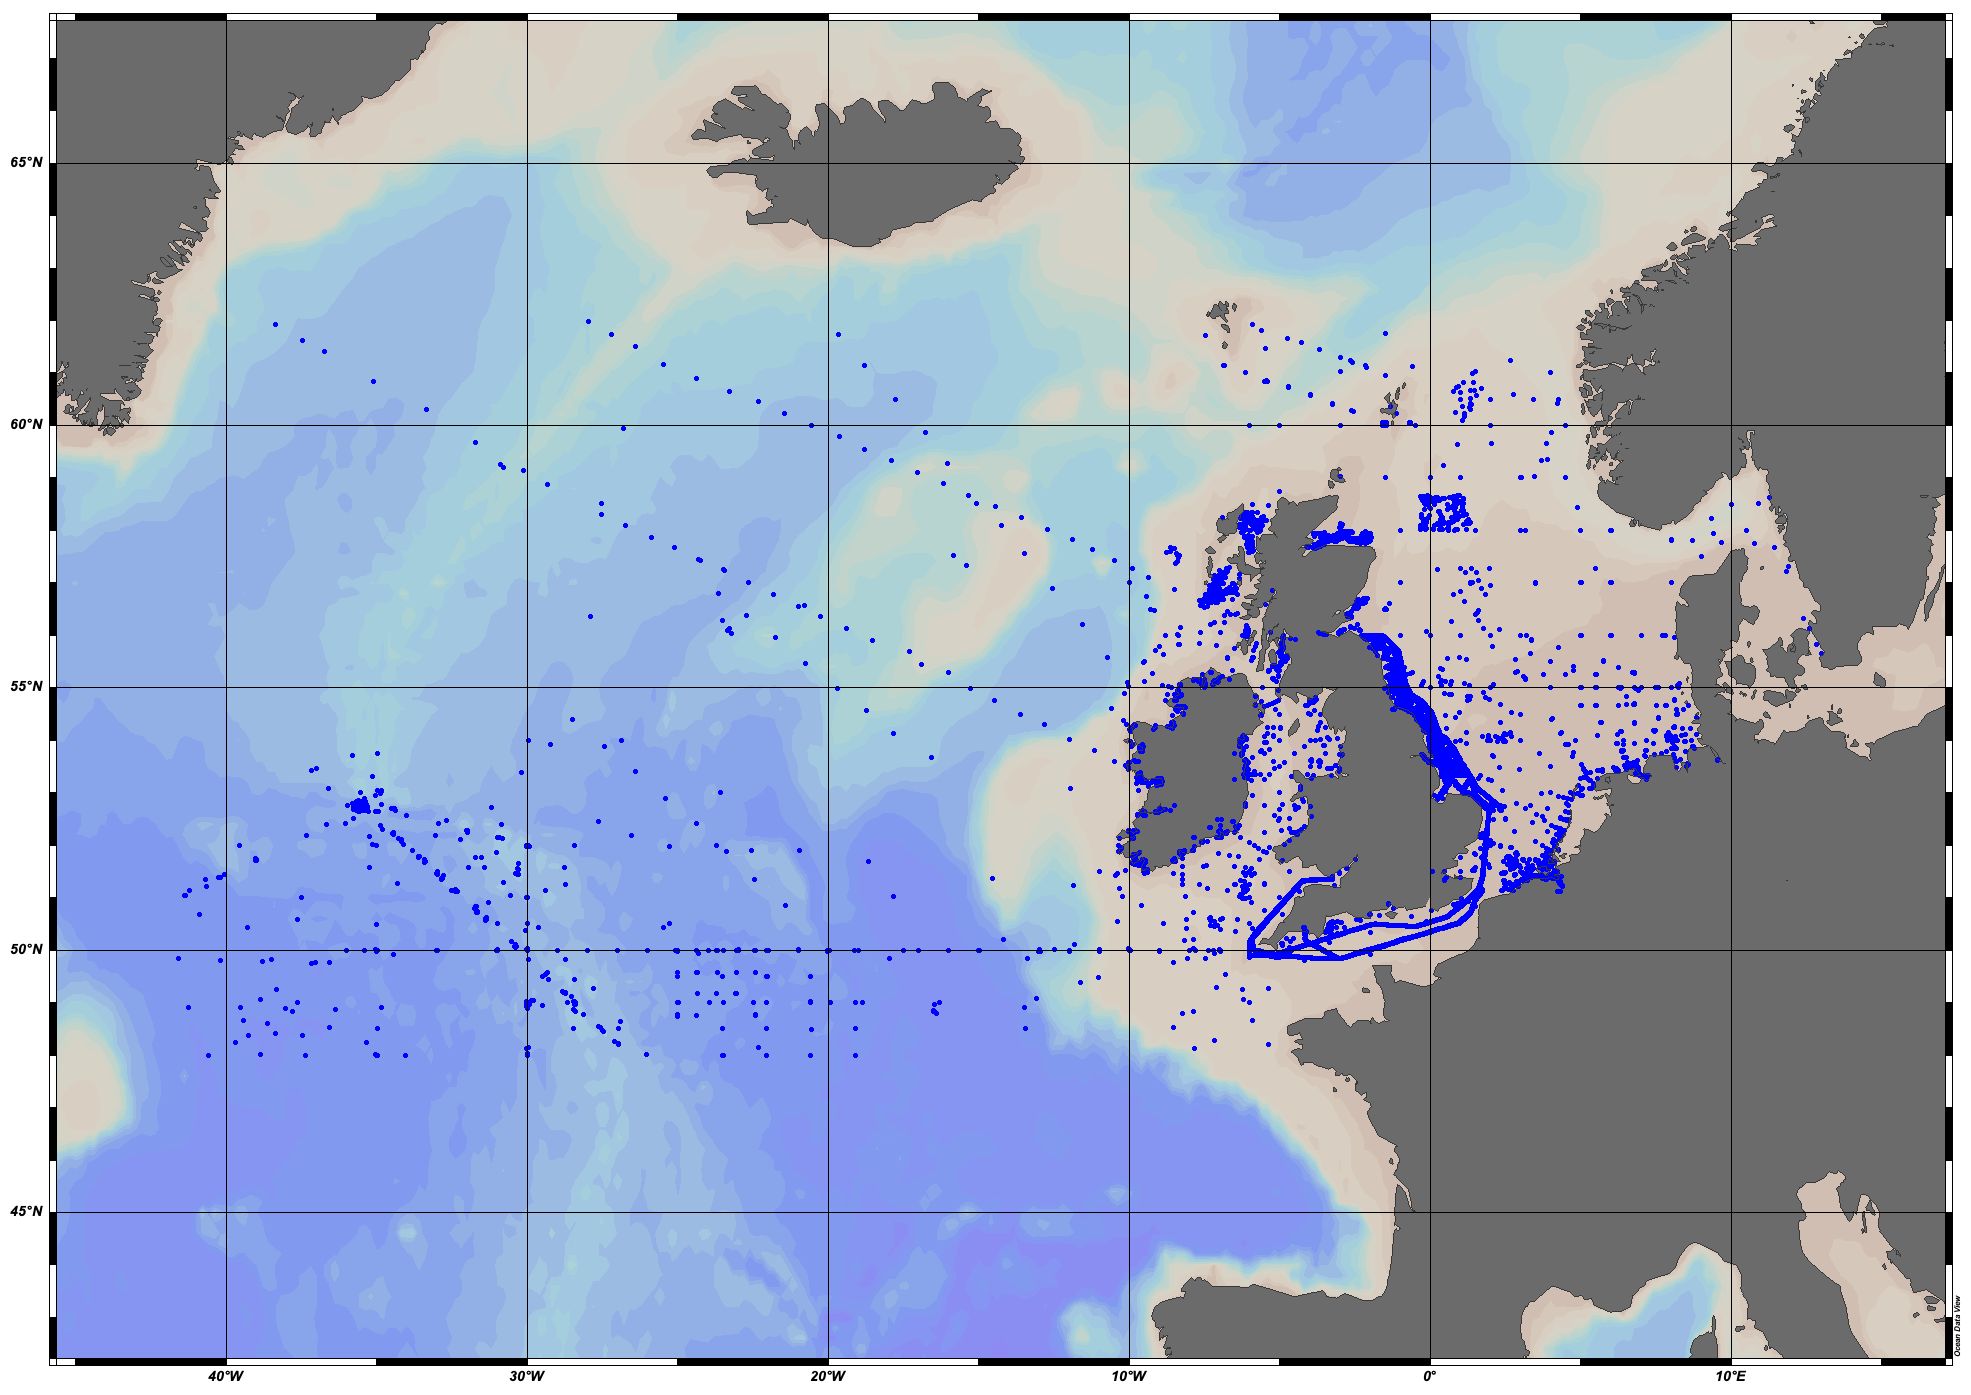
EMODnet Chemistry aims to provide access to marine chemistry datasets and derived data products concerning eutrophication, acidity and contaminants. The importance of the selected substances and other parameters relates to the Marine Strategy Framework Directive (MSFD). This aggregated dataset contains all unrestricted EMODnet Chemistry data on potential hazardous substances, despite the fact that some data might not be related to pollution (e.g. collected by deep corer). Temperature, salinity and additional parameters are included when available. It covers the Greater North Sea and Celtic Seas. Data were harmonised and validated by the 'Aarhus University, Department of Bioscience, Marine Ecology Roskilde' in Denmark. The dataset contains water (profiles), sediment (profiles) and biota (profiles and timeseries). The temporal coverage is 1970–2022 for water measurements, 1970–2021 for sediment measurements and 1979–2022 for biota measurements. Regional datasets concerning contaminants are automatically harvested and the resulting collections are harmonised and validated using ODV Software and following a common methodology for all sea regions ( https://doi.org/10.6092/8b52e8d7-dc92-4305-9337-7634a5cae3f4). Parameter names are based on P01 vocabulary, which relates to BODC Parameter Usage Vocabulary and is available at: https://vocab.nerc.ac.uk/search_nvs/P01/. The harmonised dataset can be downloaded as as an ODV spreadsheet, which is composed of a metadata header followed by tab separated values. This spreadsheet can be imported into ODV Software for visualisation (more information can be found at: https://www.seadatanet.org/Software/ODV). In addition, the same dataset is offered also as a txt file in a long/vertical format, in which each P01 measurement is a record line. Additionally, there are a series of columns that split P01 terms into subcomponents (substance, CAS number, matrix...).This transposed format is more adapted to worksheet applications (e.g. LibreOffice Calc).
-
EMODnet Chemistry aims to provide access to marine chemistry datasets and derived data products concerning eutrophication, acidity and contaminants. The importance of the selected substances and other parameters relates to the Marine Strategy Framework Directive (MSFD). This aggregated dataset contains all unrestricted EMODnet Chemistry data on eutrophication and acidity, and covers the Greater North Sea and Celtic Seas. Data were aggregated and quality controlled by 'Aarhus University, Department of Bioscience, Marine Ecology Roskilde' in Denmark. ITS-90 water temperature and water body salinity variables have also been included ('as are') to complete the eutrophication and acidity data. If you use these variables for calculations, please refer to SeaDataNet for the quality flags: https://www.seadatanet.org/Products/Aggregated-datasets. Regional datasets concerning eutrophication and acidity are automatically harvested, and the resulting collections are aggregated and quality controlled using ODV Software and following a common methodology for all sea regions ( https://doi.org/10.13120/8xm0-5m67). Parameter names are based on P35 vocabulary, which relates to EMODnet Chemistry aggregated parameter names and is available at: https://vocab.nerc.ac.uk/search_nvs/P35/. When not present in original data, water body nitrate plus nitrite was calculated by summing all nitrate and nitrite parameters. The same procedure was applied for water body dissolved inorganic nitrogen (DIN), which was calculated by summing all nitrate, nitrite, and ammonium parameters. Concentrations per unit mass were converted to a unit volume using a constant density of 1.25 kg/L. The aggregated dataset can also be downloaded as an ODV collection and spreadsheet, which is composed of a metadata header followed by tab separated values. This spreadsheet can be imported to ODV Software for visualisation (more information can be found at: https://www.seadatanet.org/Software/ODV).
-
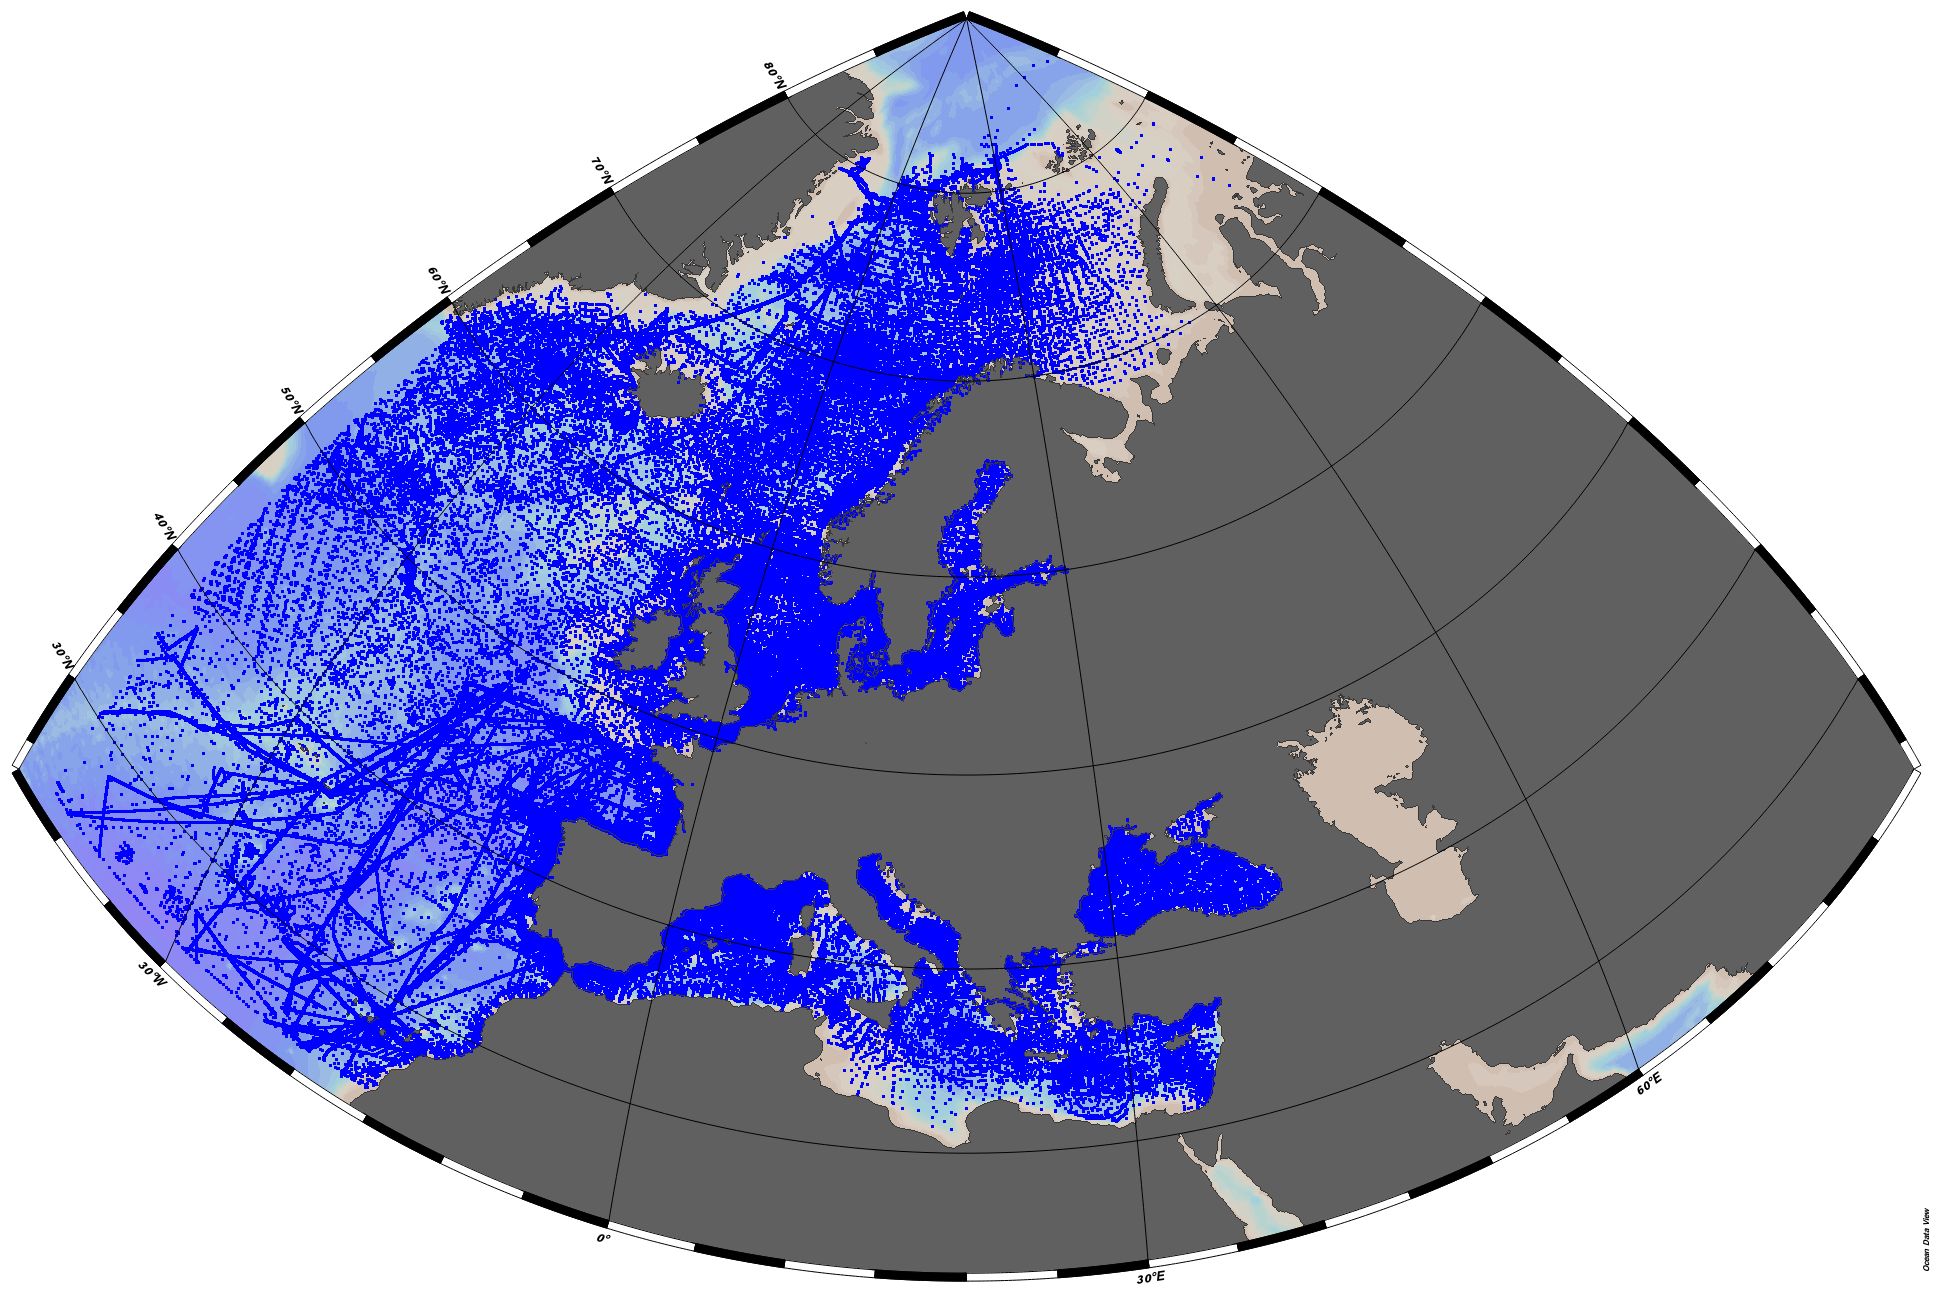
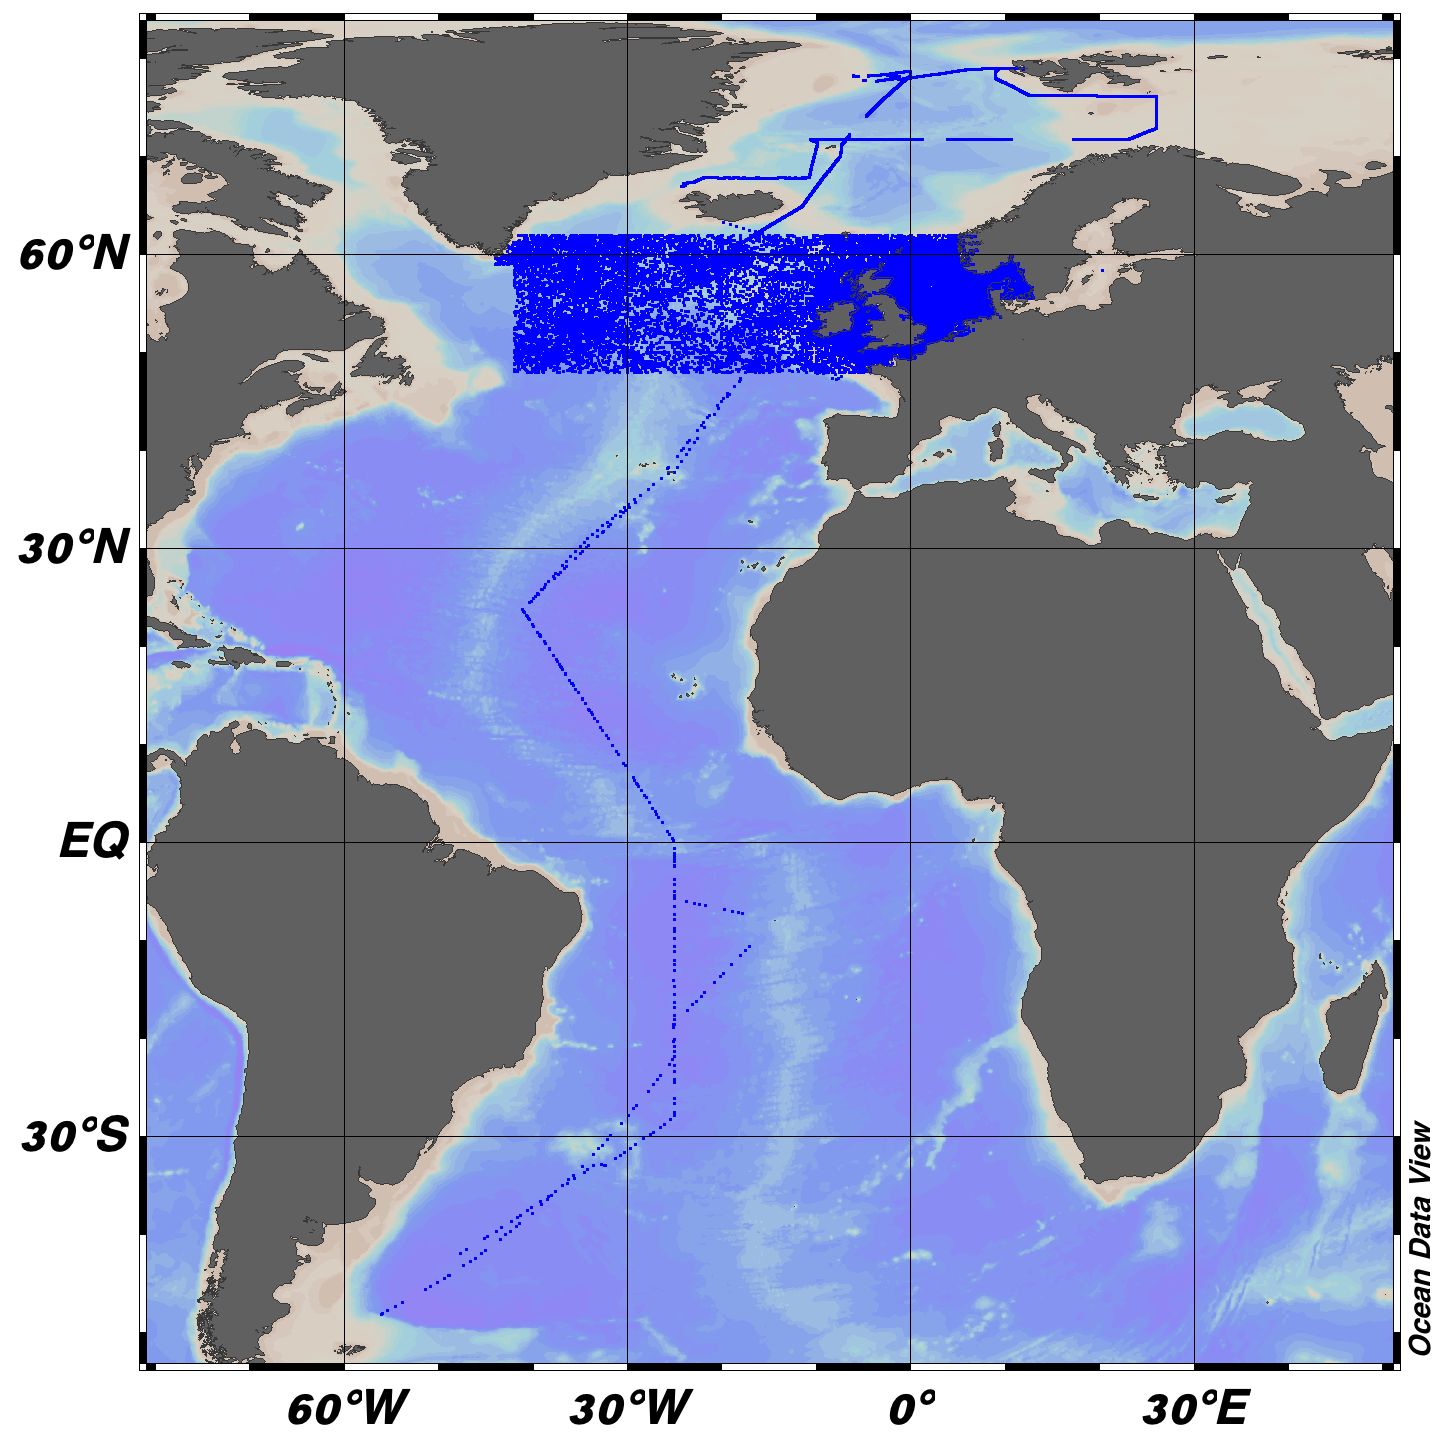
EMODnet Chemistry aims to provide access to marine chemistry datasets and derived data products concerning eutrophication, acidity and contaminants. The importance of the selected substances and other parameters relates to the Marine Strategy Framework Directive (MSFD). This aggregated dataset contains all unrestricted EMODnet Chemistry data profiles on eutrophication and acidity, and covers: the Artic Ocean, the North East Atlantic, the Greater North Sea and Celtic Seas, the Baltic Sea, the Mediterranean Sea and the Black Sea. ITS-90 water temperature and water body salinity variables have also been included ('as are') to complete the eutrophication and acidity data. If you use these variables for calculations, please refer to SeaDataNet for the quality flags: https://www.seadatanet.org/Products/Aggregated-datasets. This European dataset is the result of the aggregation of the regional datasets concerning eutrophication and acidity present in EMODnet Chemistry. The regional datasets are automatically harvested, and the resulting collections are aggregated and quality controlled using ODV Software and following a common methodology for all sea regions ( https://doi.org/10.13120/8xm0-5m67). Parameter names are based on P35 vocabulary, which relates to EMODnet Chemistry aggregated parameter names and is available at: https://vocab.nerc.ac.uk/search_nvs/P35/. This process were regionally performed by: 'Institute of Marine Research - Norwegian Marine Data Centre (NMD)' (Norway), 'IFREMER / IDM / SISMER - Scientific Information Systems for the SEA' (France), 'Aarhus University, Department of Bioscience, Marine Ecology Roskilde' (Denmark), 'Swedish Meteorological and Hydrological Institute (SMHI)' (Sweden), 'Hellenic Centre for Marine Research, Hellenic National Oceanographic Data Centre (HCMR/HNODC)' (Greece) and 'National Institute for Marine Research and Development 'Grigore Antipa' (Romania). When not present in original data, water body nitrate plus nitrite was calculated by summing all nitrate and nitrite parameters. The same procedure was applied for water body dissolved inorganic nitrogen (DIN), which was calculated by summing all nitrate, nitrite, and ammonium parameters. Concentrations per unit mass were converted to a unit volume using a constant density of 1.25 kg/L. The aggregated dataset can be downloaded as an ODV collection.
-
The present dataset has been used to assess how macrobenthic communities vary depending on (i) the type of dune, (ii) the position within the dune and (iii) the season. It has been combined with a biological traits dataset [Robert Alexandre Elie, Quillien Nolwenn, Bacha Mahmoud, Caulle Clémence, Nexer Maëlle, Parent Briz, Garlan Thierry, Desroy Nicolas (2021). Biological traits of macroinvertebrates associated with subtidal sandy beforms. SEANOE. https://doi.org/10.17882/80785] and results from this analysis have been published in Marine Pollution Bulletin in 2021 [Alexandre Elie Robert, Nolwenn Quillien, Mahmoud Bacha, Clémence Caulle, Maëlle Nexer, Briz Parent, Thierry Garlan, Nicolas Desroy, Sediment migrations drive the dynamic of macrobenthic ecosystems in subtidal sandy bedforms, Marine Pollution Bulletin, Volume 171, 2021, 112695, ISSN 0025-326X, https://doi.org/10.1016/j.marpolbul.2021.112695. Important Note: This submission has been initially submitted to SEA scieNtific Open data Edition (SEANOE) publication service and received the recorded DOI. The metadata elements have been further processed (refined) in EMODnet Ingestion Service in order to conform with the Data Submission Service specifications.
-
Aerial surveys with bird observations around the off shore wind farm Borssele (North Sea). It is acquired for gaining insight in spatio-temporal behavior of patterns of birds. RWS case number: 31163291.
-
The dataset entails the maritime spatial plan of Denmark that was adopted on September 29 2023.
-
This work was carried out for the Danish Environment Protection Agency (EPA) targeting microplastics (MP) in Danish marine sediments. It addresses the geographical distribution of MP in sediments from 23 stations, among which, 19 were analysed in 2022 (https://www.emodnet-ingestion.eu/submissions/submissions_details.php?menu=39&tpd=1185&step=001Denmark), and four were analysed in 2023. One of these four samples were collected from Skagerrak, and three were from the North Sea. It attempts to map the level and geographical distribution of MP in sediments from the North Sea and Skagerrak. The monitoring should furthermore create a baseline for future efforts to assess temporal changes of MP in Danish marine sediments.