 EMODnet Product Catalogue
200000
Type of resources
Available actions
Topics
Keywords
Contact for the resource
Provided by
Years
Formats
Representation types
Update frequencies
status
Scale 1:
Resolution
-
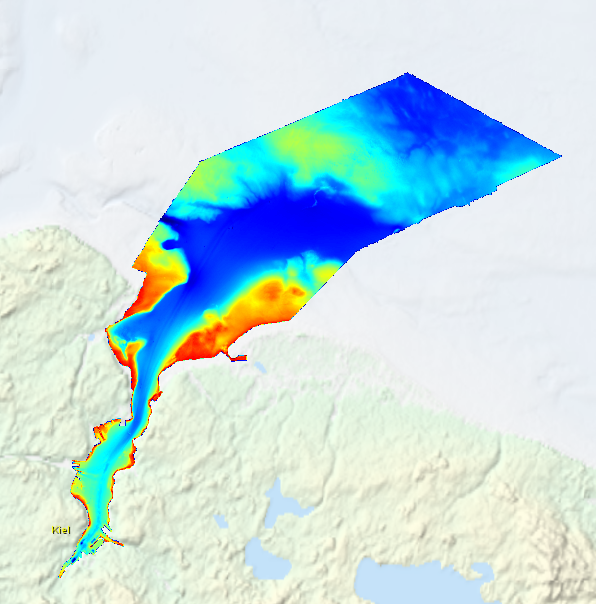
High resolution composite DTM based on multi beam surveys in Kiel Bay. All data acquired in the years 2013-2016.
-
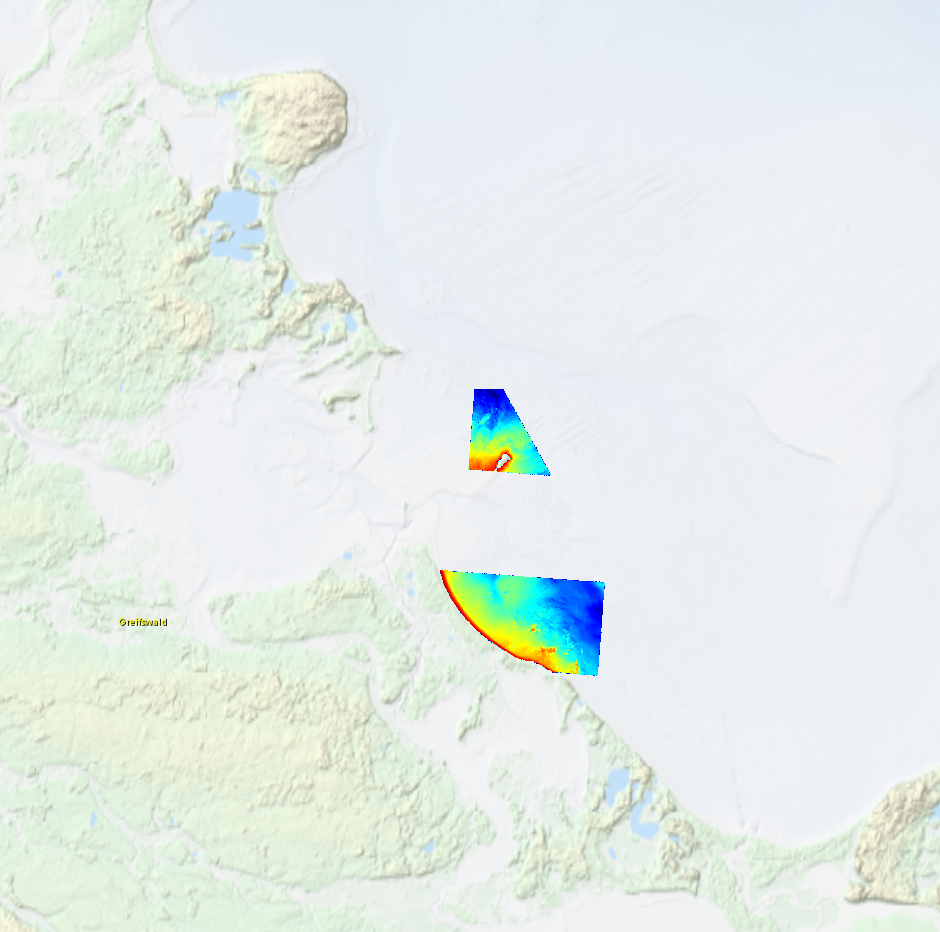
High resolution composite DTM based on multi beam surveys in German Bodden waters. All data acquired in 2016.
-
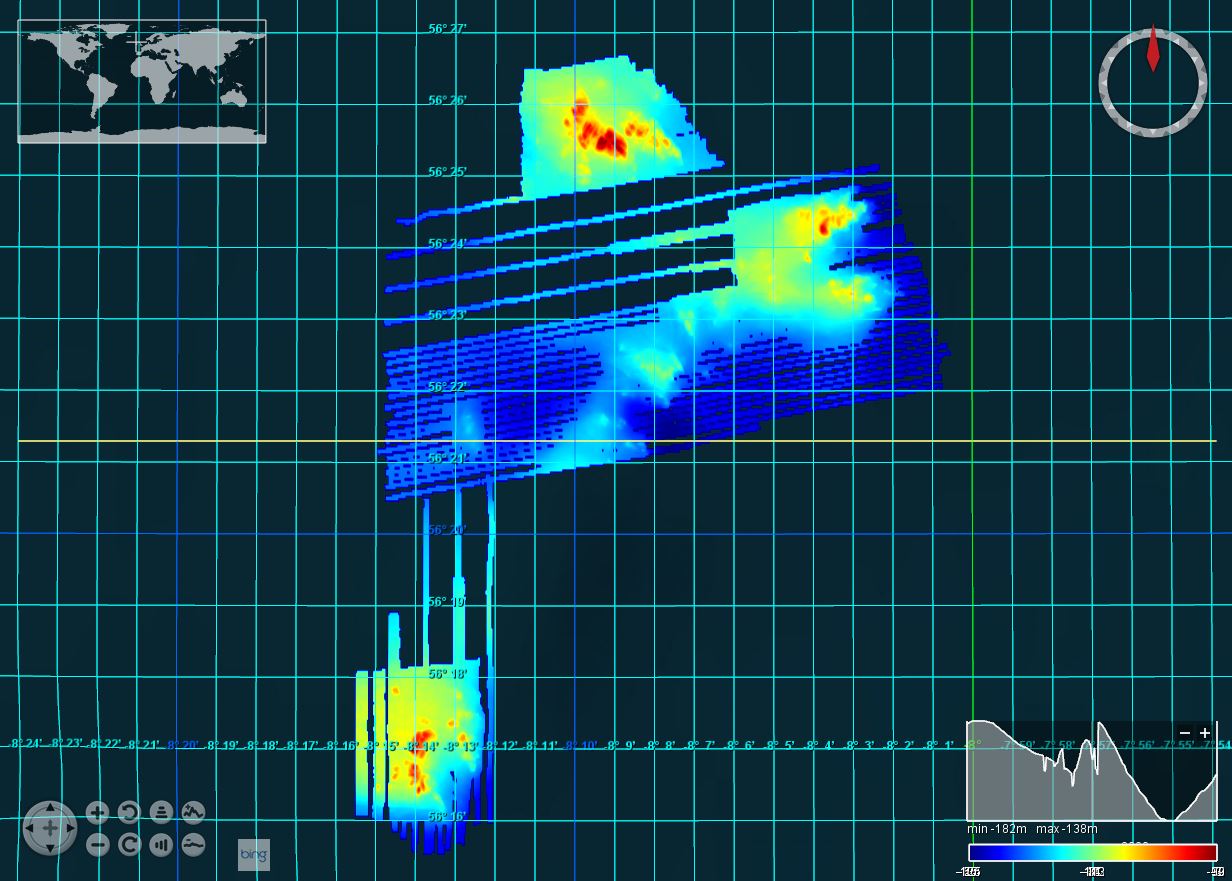
This map shows benthic marine habitats and reef complexes surroounding Sceirde Rocks off the West Coast of Ireland. MBES bathymetry and backscatter were interpreted to classifiy the map into reef areas. ArcGIS Pro Spatial Analyst tools were used to extract the rock outcrops and sediment classes were groundtruthed using sample data.
-
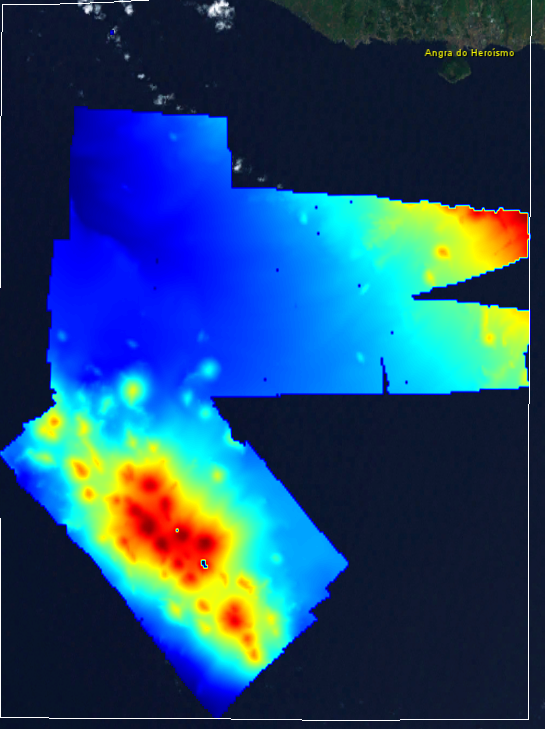
Multibeam during Whale Prey Community Cruise 64PE456
-
Broadscale habitat (EUNIS level 3) for the Cromer Shoals Chalk Beds recommended Marine Conservation Zone (rMCZ).Seabed texture polygons mapped using semi automated ISO cluster unsupervised classification and expert interpretation of acoustic data (MBES bathymetry and backscatter) and groundtruthing data from PSA analysis and image (stills and video) classification.
-
This marine multibeam and sampling survey was undertaken on Stanton Banks by the Joint Nature Conservation Committee (JNCC), Centre for Environment, Fisheries & Aquaculture Science (CEFAS) and British Geological Survey (BGS) in July/August 2012 on board the Northern Lighthouse Board vessel NLV Polestar. The survey was led by the JNCC and included a team from CEFAS who were involved in benthic sampling. A combination of surveys methods were employed, including seabed imagery (drop camera), day grabs and rock dredges. BGS collected sea floor multibeam bathymetry data using a Kongsberg EM3002D multibeam system.
-
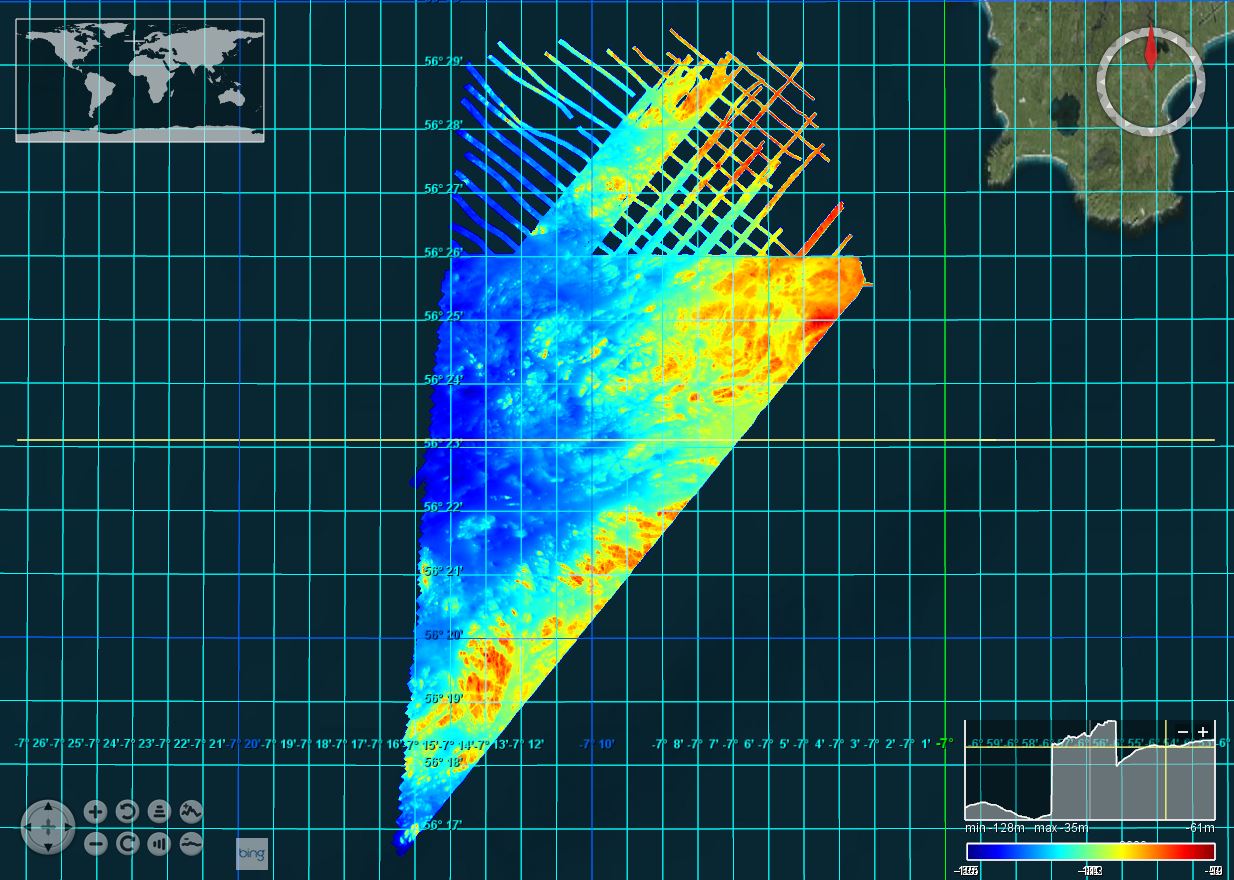
This marine geophysical and multibeam survey was undertaken by British Geological Survey on behalf of Marine Scotland utilising the Northern Lighthouse Board vessel NLV Polestar, it took place in July/August 2012 off south-west Tiree. The purpose was to further our understanding of Scotland’s marine environment, increase the efficiency of use of public resources, enhance the safety of those at sea and contribute to new policy priorities such as marine protected areas, wider conservation measures, marine planning and renewable. Bathymetric data was collected using a Kongsberg EM3002D dual head, multibeam system. Data was acquired using a Kongsberg SIS operating system, logging raw .ALL files. This data was processed offline by BGS using CARIS HIPS and SIPS 7.1 SP2.
-
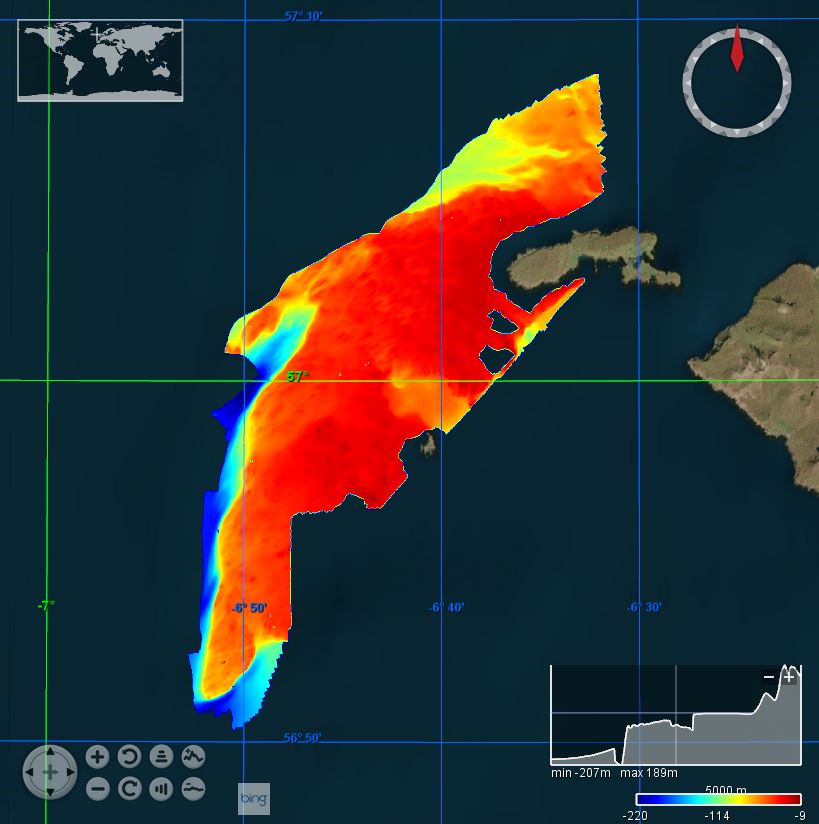
This marine multibeam survey took place in July 2011 in the area around the Isle of Canna on the west coast of Scotland on board the Northern Lighthouse Board vessel NLV Pole Star. The survey was carried out by the British Geological Survey (BGS) on behalf of Marine Scotland and Scottish Natural Heritage (SNH). Sea floor bathymetry data were collected using a Kongsberg EM3002D multibeam system.
-
Mapis based on the interpretation of various types of data from a number of surveys carried out between 2011-2012 both in the intertidal and subtidal zones. Additionally the seabed ┬½ Carte G ┬╗ from the French hydrographic survey (SHOM) was used in the interpretation process. In the tidal zone the identification was made by interpreting coastal ortho-photographs from BD Ortho (2005 et 2009) and digitising them on scale 1 : 2000├¿me with further qualification of the polygons based on ground truth data. For the subtidal zone, several data sources from 2011 were available: bathymetric lidar (with sounding density about 1pt*3m-2), side scan sonar (resolution of about 0.2m), underwater video, sediment and fauna samples collected with grabs and trawls. Addtionnally a single beam sounder was running at all times during the transects, which contributing to improve the depth DTM. In the outer rocky circalittoral zone, side scan sonar corridors were surveyed with a coverage of 30-50% depending on places. In the offshore deep circalittoral zone (known as La Grande vasi├¿re) where soft sediment is predominant, side scan sonar coverage was reduced to about 5-10%. In these latter two circalittoral zones, interpolation between sonar corridors was supported by SHOM ┬½ Carte G ┬╗ (approx. scale 1:100000) along with a 100m resolution depth DTM. On rocky seabed, exposure at the seabed was described using kinetic energy from a combination of wave and current hydrodynamic models according to the methods described in: http://doi.org/10.13155/49975. Rocky substrate in intertidal and infralittoral zones was derived from the combined interpretation of both the topographic and bathymetric Lidar DTMs and aerial photographs, where permitted by water transparency. Various representations of the DTMs (slope, hillshade) helped delineate rocky outcrops with good reliability. Biological qualification of the substrate polygons was made through taxonomic analysis of benthos samples collected by MNHN in the framework of the project"Ecological assessment of Natura 2000 site - Roches de PenmarcÔÇÖh".The final habitat classification was a synthesis of the main habitat classifications, namely: Generic habitats from the Habitat Directive (EUR 27), Elementary habitats from the French Cahiers dÔÇÖhabitats, The Rebent classificationand EUNIS level 4 as much as possible.
-
This map mostly results from the interpolation in gaps between surrounding maps. In places the rugosity derived from bathymetric data (soundings from hydrographic minutes and hydrographic lidar) enabled the interpreter to infer rocky seabed presence. In shallowest places aerial photography was also used to retrieve rocky seabed, distinguished from similar-looking Zostera beds owing to a historic Zostera bed inventory available to the project. The habitat classification was a synthesis of the main habitat classifications, namely: Generic habitats from the Habitat Directive (EUR 27), Elementary habitats from the French Cahiers dÔÇÖhabitats, The Rebent classificationand EUNIS level 4 as much as possible.