 EMODnet Product Catalogue
Hellenic Centre for Marine Research (HCMR)
Type of resources
Available actions
Topics
Keywords
Contact for the resource
Provided by
Years
Formats
Representation types
Update frequencies
Scale 1:
Resolution
-
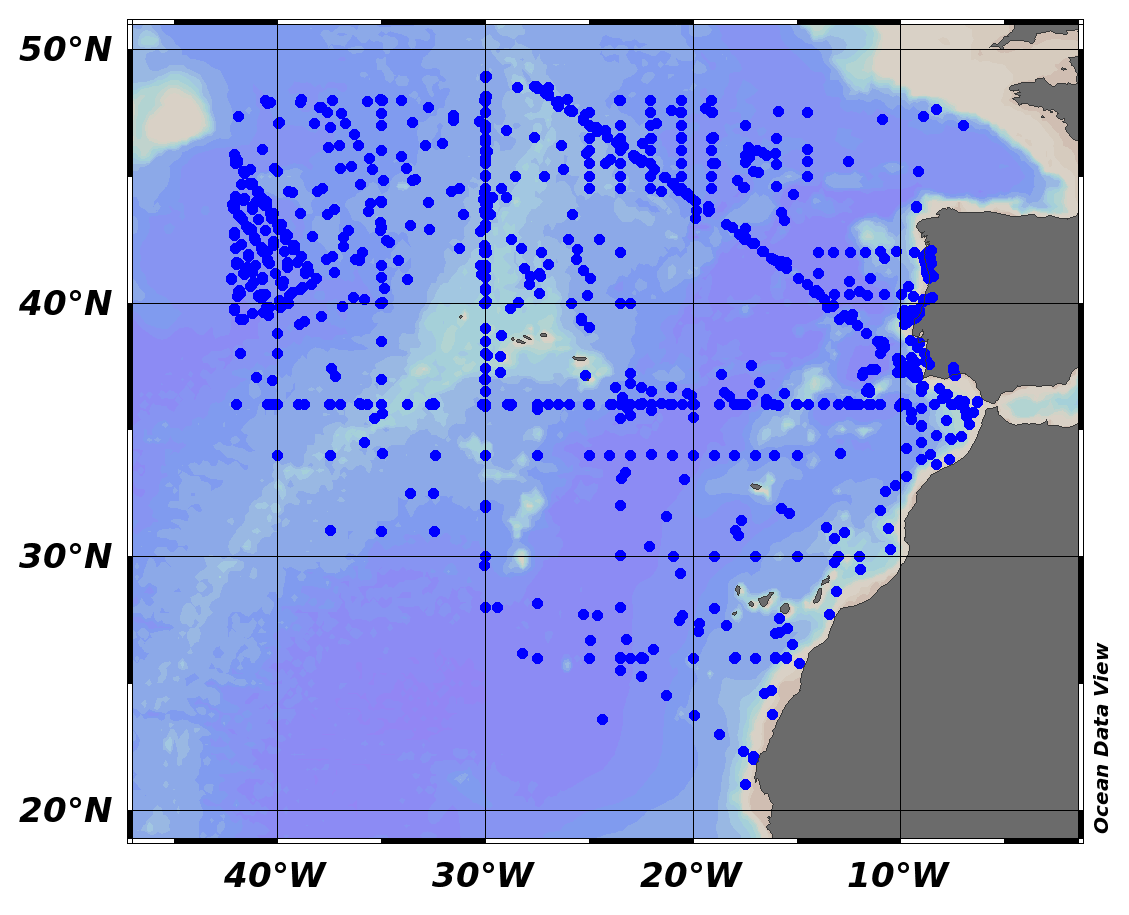
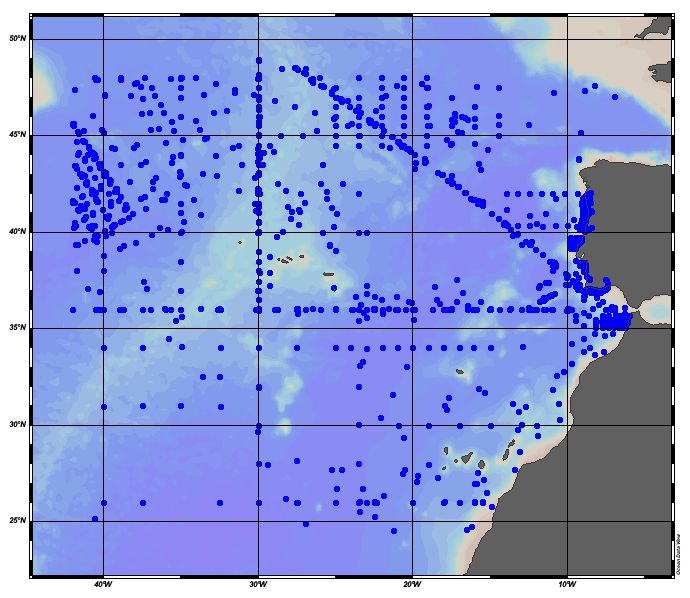
EMODnet Chemistry aims to provide access to marine chemistry data sets and derived data products concerning eutrophication, ocean acidification and contaminants. The chemicals chosen reflect importance to the Marine Strategy Framework Directive (MSFD). This regional aggregated dataset contains all unrestricted EMODnet Chemistry data on contaminants (20 parameters), and covers the North East Atlantic Ocean with 2400 CDI records divided per matrices: 122 in biota (as time series), 1689 in water (as vertical profiles), 589 in sediment (478 Vertical profiles and 111 Time series). Vertical profiles temporal range is from 1970-07-29 to 2017-02-28. Time series temporal range is from 1979-02-28 to 2014-10-21. Data were aggregated and quality controlled by ‘IFREMER / IDM / SISMER - Scientific Information Systems for the SEA’ from France. Regional datasets concerning contaminants are automatically harvested. Parameter names in these datasets are based on P01, BODC Parameter Usage Vocabulary, which is available at: http://seadatanet.maris2.nl/bandit/browse_step.php . Each measurement value has a quality flag indicator. The resulting data collections for each Sea Basin are harmonised, and the collections are quality controlled by EMODnet Chemistry Regional Leaders using ODV Software and following a common methodology for all Sea Regions. Harmonisation means that: (1) unit conversion is carried out to express contaminant concentrations with a limited set of measurement units (according to EU directives 2013/39/UE; Comm. Dec. EU 2017/848) and (2) merging of variables described by different “local names” ,but corresponding exactly to the same concepts in BODC P01 vocabulary. The harmonised dataset can be downloaded as ODV spreadsheet (TXT file), which is composed of metadata header followed by tab separated values. This worksheet can be imported to ODV Software for visualisation (More information can be found at: https://www.seadatanet.org/Software/ODV ). The same dataset is offered also as XLSX file in a long/vertical format, in which each P01 measurement is a record line. Additionally, there are a series of columns that split P01 terms in subcomponents (measure, substance, CAS number, matrix...).This transposed format is more adapted to worksheet applications users (e.g. LibreOffice Calc). The 20 parameter names in this metadata record are based on P02, SeaDataNet Parameter Discovery Vocabulary, which is available at: http://seadatanet.maris2.nl/v_bodc_vocab_v2/vocab_relations.asp?lib=P02 . Detailed documentation will be published soon. The original datasets can be searched and downloaded from EMODnet Chemistry Download Service: https://emodnet-chemistry.maris.nl/search
-

EMODnet Chemistry aims to provide access to marine chemistry datasets and derived data products concerning eutrophication, acidity and contaminants. The importance of the selected substances and other parameters relates to the Marine Strategy Framework Directive (MSFD). This aggregated dataset contains all unrestricted EMODnet Chemistry data on potential hazardous substances, despite the fact that some data might not be related to pollution (e.g. collected by deep corer). Temperature, salinity and additional parameters are included when available. It covers the Northeast Atlantic Ocean (40W). Data were harmonised and validated by the '‘IFREMER / IDM / SISMER - Scientific Information Systems for the SEA’ in France. The dataset contains water (profiles), sediment (profiles and timeseries) and biota (timeseries). The temporal coverage is 1974–2018 for water measurements, 1966–2020 for sediment measurements and 1979–2022 for biota measurements. Regional datasets concerning contaminants are automatically harvested and the resulting collections are harmonised and validated using ODV Software and following a common methodology for all sea regions ( https://doi.org/10.6092/8b52e8d7-dc92-4305-9337-7634a5cae3f4). Parameter names are based on P01 vocabulary, which relates to BODC Parameter Usage Vocabulary and is available at: https://vocab.nerc.ac.uk/search_nvs/P01/. The harmonised dataset can be downloaded as as an ODV spreadsheet, which is composed of a metadata header followed by tab separated values. This spreadsheet can be imported into ODV Software for visualisation (more information can be found at: https://www.seadatanet.org/Software/ODV). In addition, the same dataset is offered also as a txt file in a long/vertical format, in which each P01 measurement is a record line. Additionally, there are a series of columns that split P01 terms into subcomponents (substance, CAS number, matrix...).This transposed format is more adapted to worksheet applications (e.g. LibreOffice Calc).
-
This dataset includes data of plastic litter collected by citizens and students during 12 campaigns that were organised in Crete (Greece) during the period May 2022 – May 2023. The campaigns were organized within the framework of the NAUTILOS Horizon 2020 project. More specifically the number of plastic litter items per category (using the J code List of the EMODnet Chemistry Thematic Lot n°4) was recorded together with information about the location, date, surface area covered, data contributor and some environmental characteristics (sediment, weather, surroundings).
-
The dataset includes time-series of Posidonia oceanica production over ~20 years (1997 -2018) at sixty sites in the Greek Seas. The dataset also include environmental variables for the same sites and time -period (i.e., sea surface temperature, sea surface temperature of August, Chlorophyll a, Suspended particulate matter, Secchi depth)
-
Coastal marine sediments receive intensive stress from urbanization and industrialization, which is manifested by increased contents of heavy metals and organic pollutants. Saronikos Gulf and the small embayment of Elefsis, stretch along the coast of the greater Athens and Pireaus port, the most urbanized and industrialized areas in Greece. Here we present the data of a 20-years geochemical record on grain-size, organic carbon, and major and trace elements contents of the Saronikos Gulf sediments. A total of 216 sediment samples were collected within the period of 1999 to 2018 from the four sub-sectors of the gulf, namely, the Elefsis Bay, the Inner, Outer, and Western (Megara and Epidavros basin) Saronikos Gulf. Additionally, at least one core was obtained from each sub-sector. Sediments deposited at pre-industrial periods were recognized by 14C and 210Pb datings, and served for establishing regionalized, background levels of metals. Factor analysis was conducted to reveal the inter-parametric relationships, thus their common sources, as well as transport and deposition pathways. Then, Enrichment Factors and the multi-elemental Modified Pollution Index (MPI) were calculated to assess the current environmental status of the sediments. Data of sampling sites with at least a five-year record, were assessed for temporal trends, to explore whether sustained, increasing or decreasing trends of the MPI are observed. The dataset and analyses presented here support the research article entitled Geochemistry of major and trace elements in surface sediments of the Saronikos Gulf (Greece): assessment of contamination between 1999 and 2018 by Karageorgis A.P., Botsou F., Kaberi H., and Iliakis S., https://doi.org/10.1016/j.scitotenv.2020.137046
-
EMODnet Chemistry aims to provide access to marine chemistry datasets and derived data products concerning eutrophication, acidity and contaminants. The importance of the selected substances and other parameters relates to the Marine Strategy Framework Directive (MSFD). This aggregated dataset contains all unrestricted EMODnet Chemistry data on potential hazardous substances, despite the fact that some data might not be related to pollution (e.g. collected by deep corer). Temperature, salinity and additional parameters are included when available. It covers the Northeast Atlantic Ocean (40W). Data were harmonised and validated by the '‘IFREMER / IDM / SISMER - Scientific Information Systems for the SEA’ in France. The dataset contains water (profiles), sediment (profiles and timeseries) and biota (timeseries). The temporal coverage is 1974–2018 for water measurements, 1966–2020 for sediment measurements and 1979–2022 for biota measurements. Regional datasets concerning contaminants are automatically harvested and the resulting collections are harmonised and validated using ODV Software and following a common methodology for all sea regions ( https://doi.org/10.6092/8b52e8d7-dc92-4305-9337-7634a5cae3f4). Parameter names are based on P01 vocabulary, which relates to BODC Parameter Usage Vocabulary and is available at: https://vocab.nerc.ac.uk/search_nvs/P01/. The harmonised dataset can be downloaded as as an ODV spreadsheet, which is composed of a metadata header followed by tab separated values. This spreadsheet can be imported into ODV Software for visualisation (more information can be found at: https://www.seadatanet.org/Software/ODV). In addition, the same dataset is offered also as a txt file in a long/vertical format, in which each P01 measurement is a record line. Additionally, there are a series of columns that split P01 terms into subcomponents (substance, CAS number, matrix...).This transposed format is more adapted to worksheet applications (e.g. LibreOffice Calc).
-
webODV visualisations via WMS from the harmonized, standardized, validated data collections that EMODnet Chemistry is regularly producing and publishing for all European sea basins for eutrophication and contaminants. You can analyze, visualize, subset and download EMODnet Chemistry data using interactive webODV services. More information at: https://emodnet.ec.europa.eu/en/chemistry#chemistry-services
-
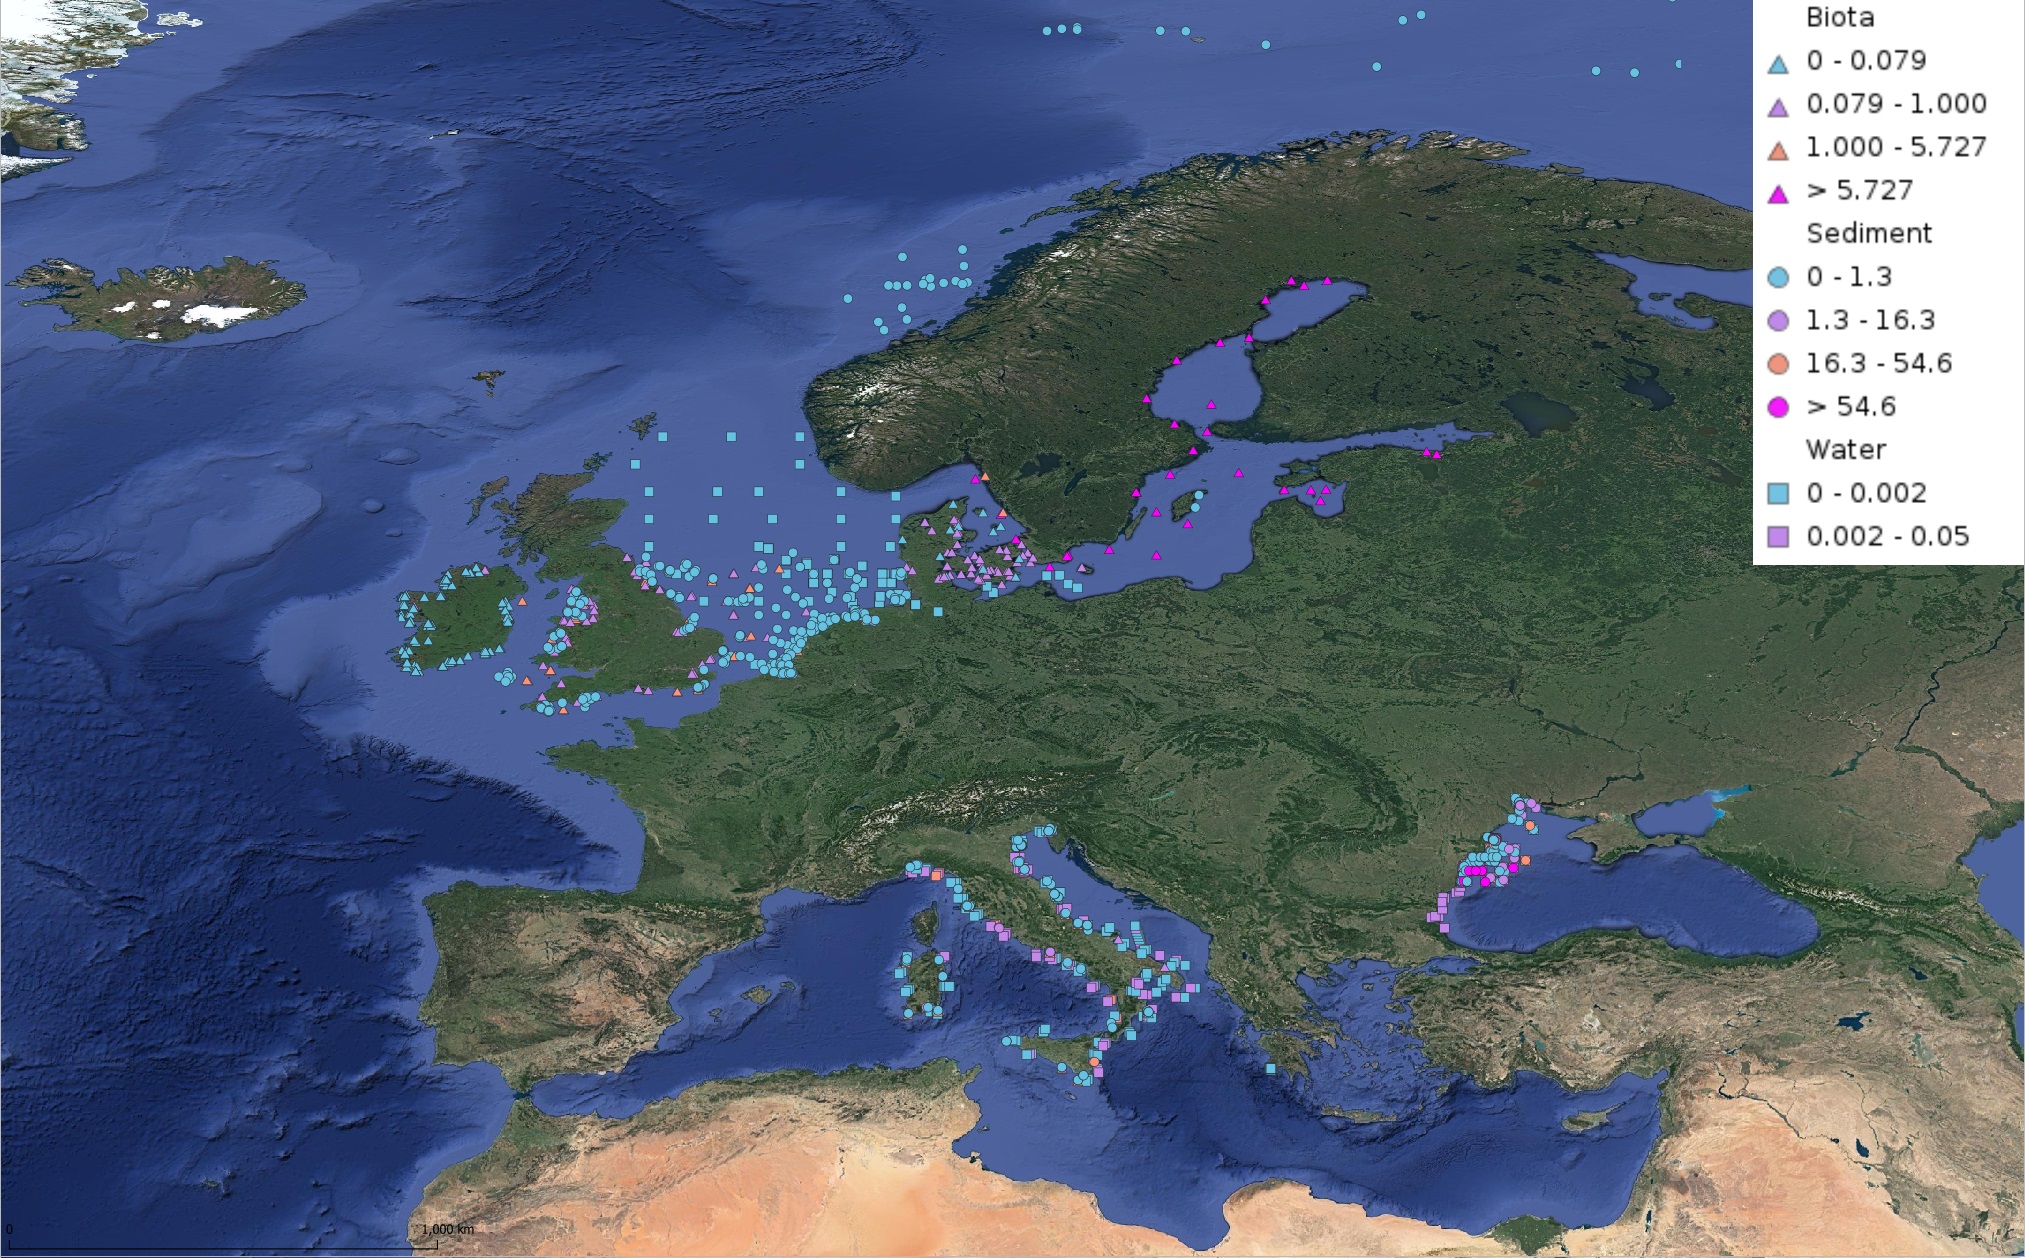
This product displays for Hexachlorobenzene, median values of the last 6 available years that have been measured per matrix and are present in EMODnet validated datasets. The median values ranges are derived from the following percentiles: 0-25%, 25-75%, 75-90%, >90%. Only "good data" are used, namely data with Quality Flag=1, 2, 6, Q (SeaDataNet Quality Flag schema). For water, only surface values are used (0-15 m), for sediment and biota data at all depths are used.
-
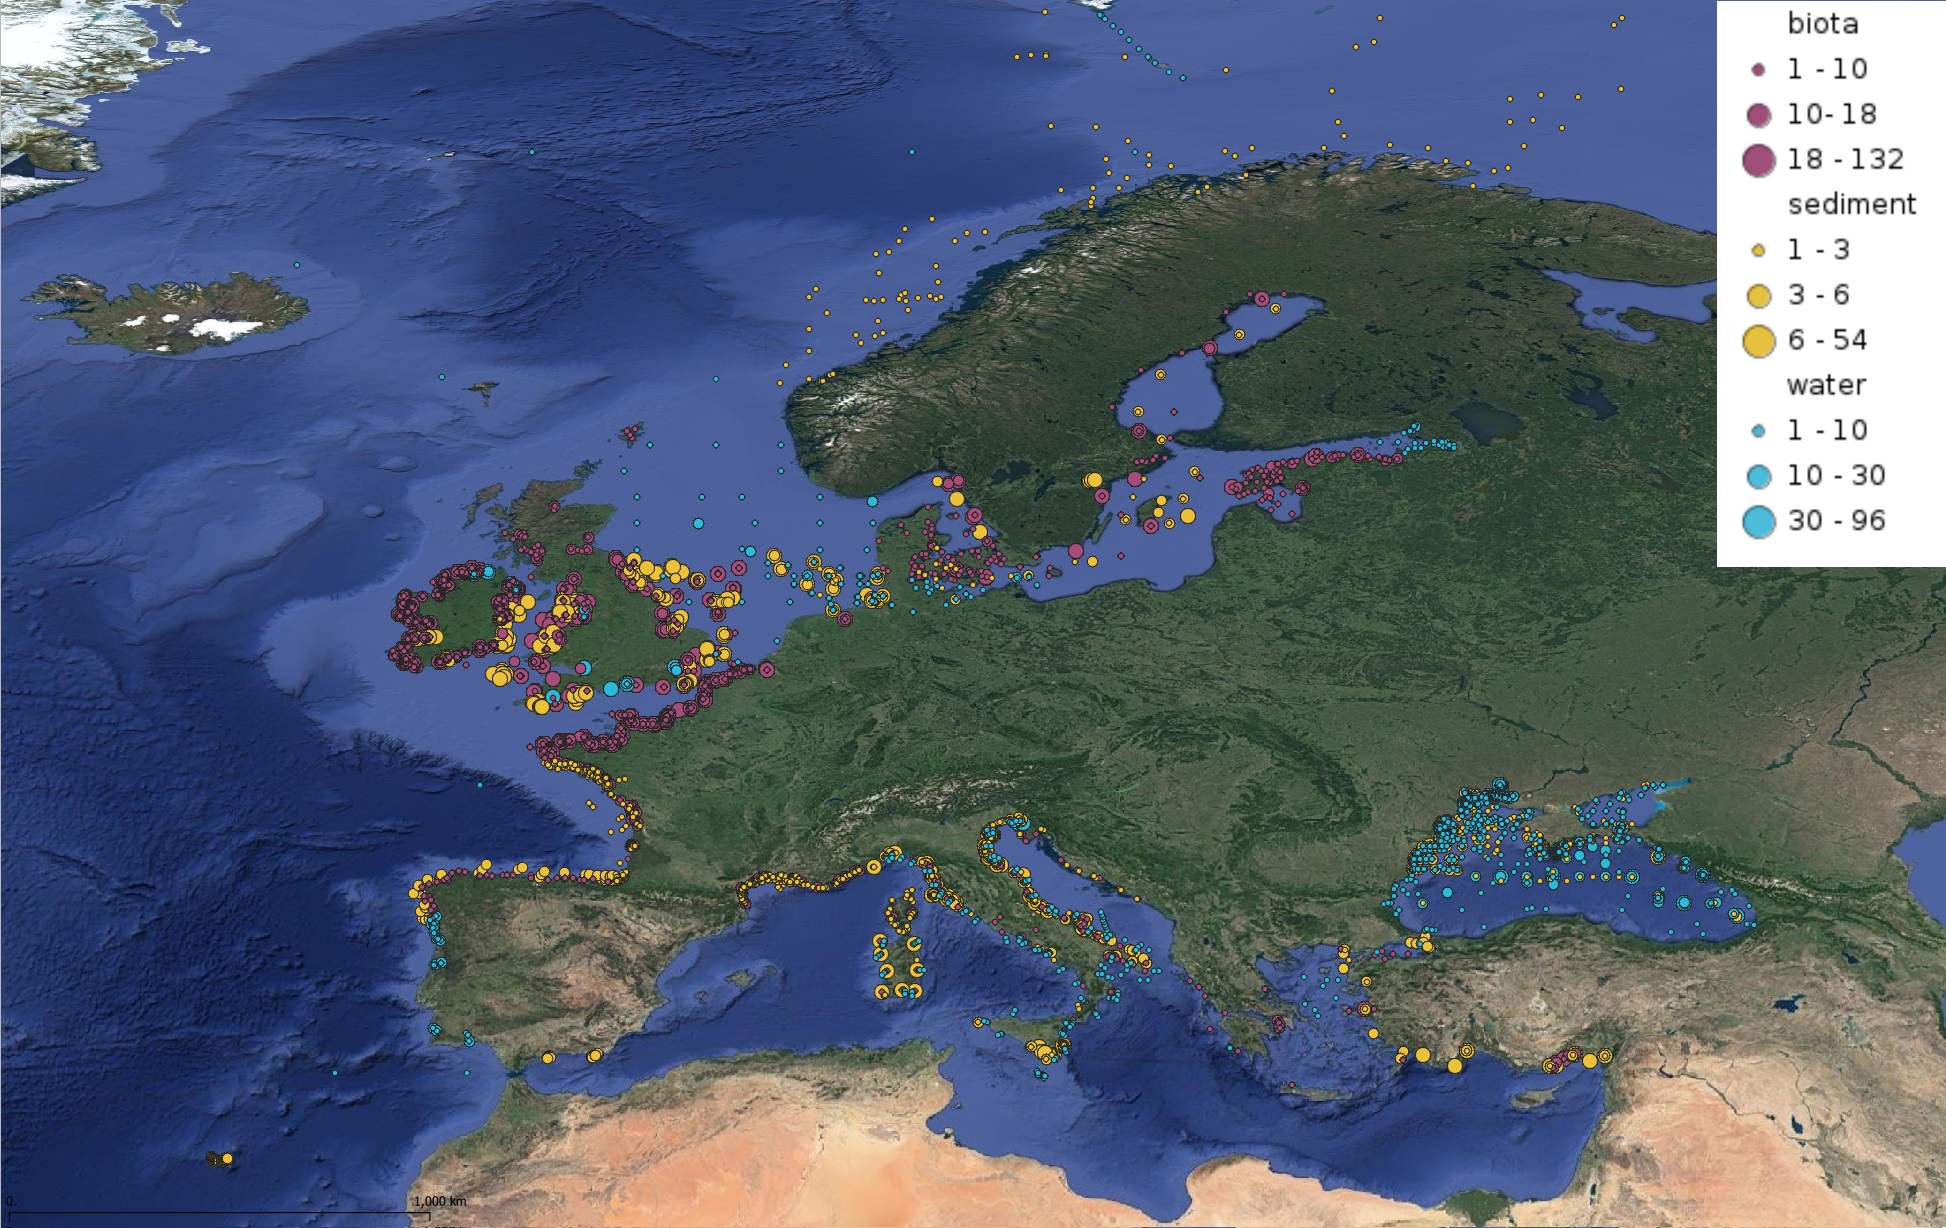
This product displays for DDT, DDE, and DDD, positions with values counts that have been measured per matrix and are present in EMODnet validated datasets. The product displays positions for all available years and per year.
-
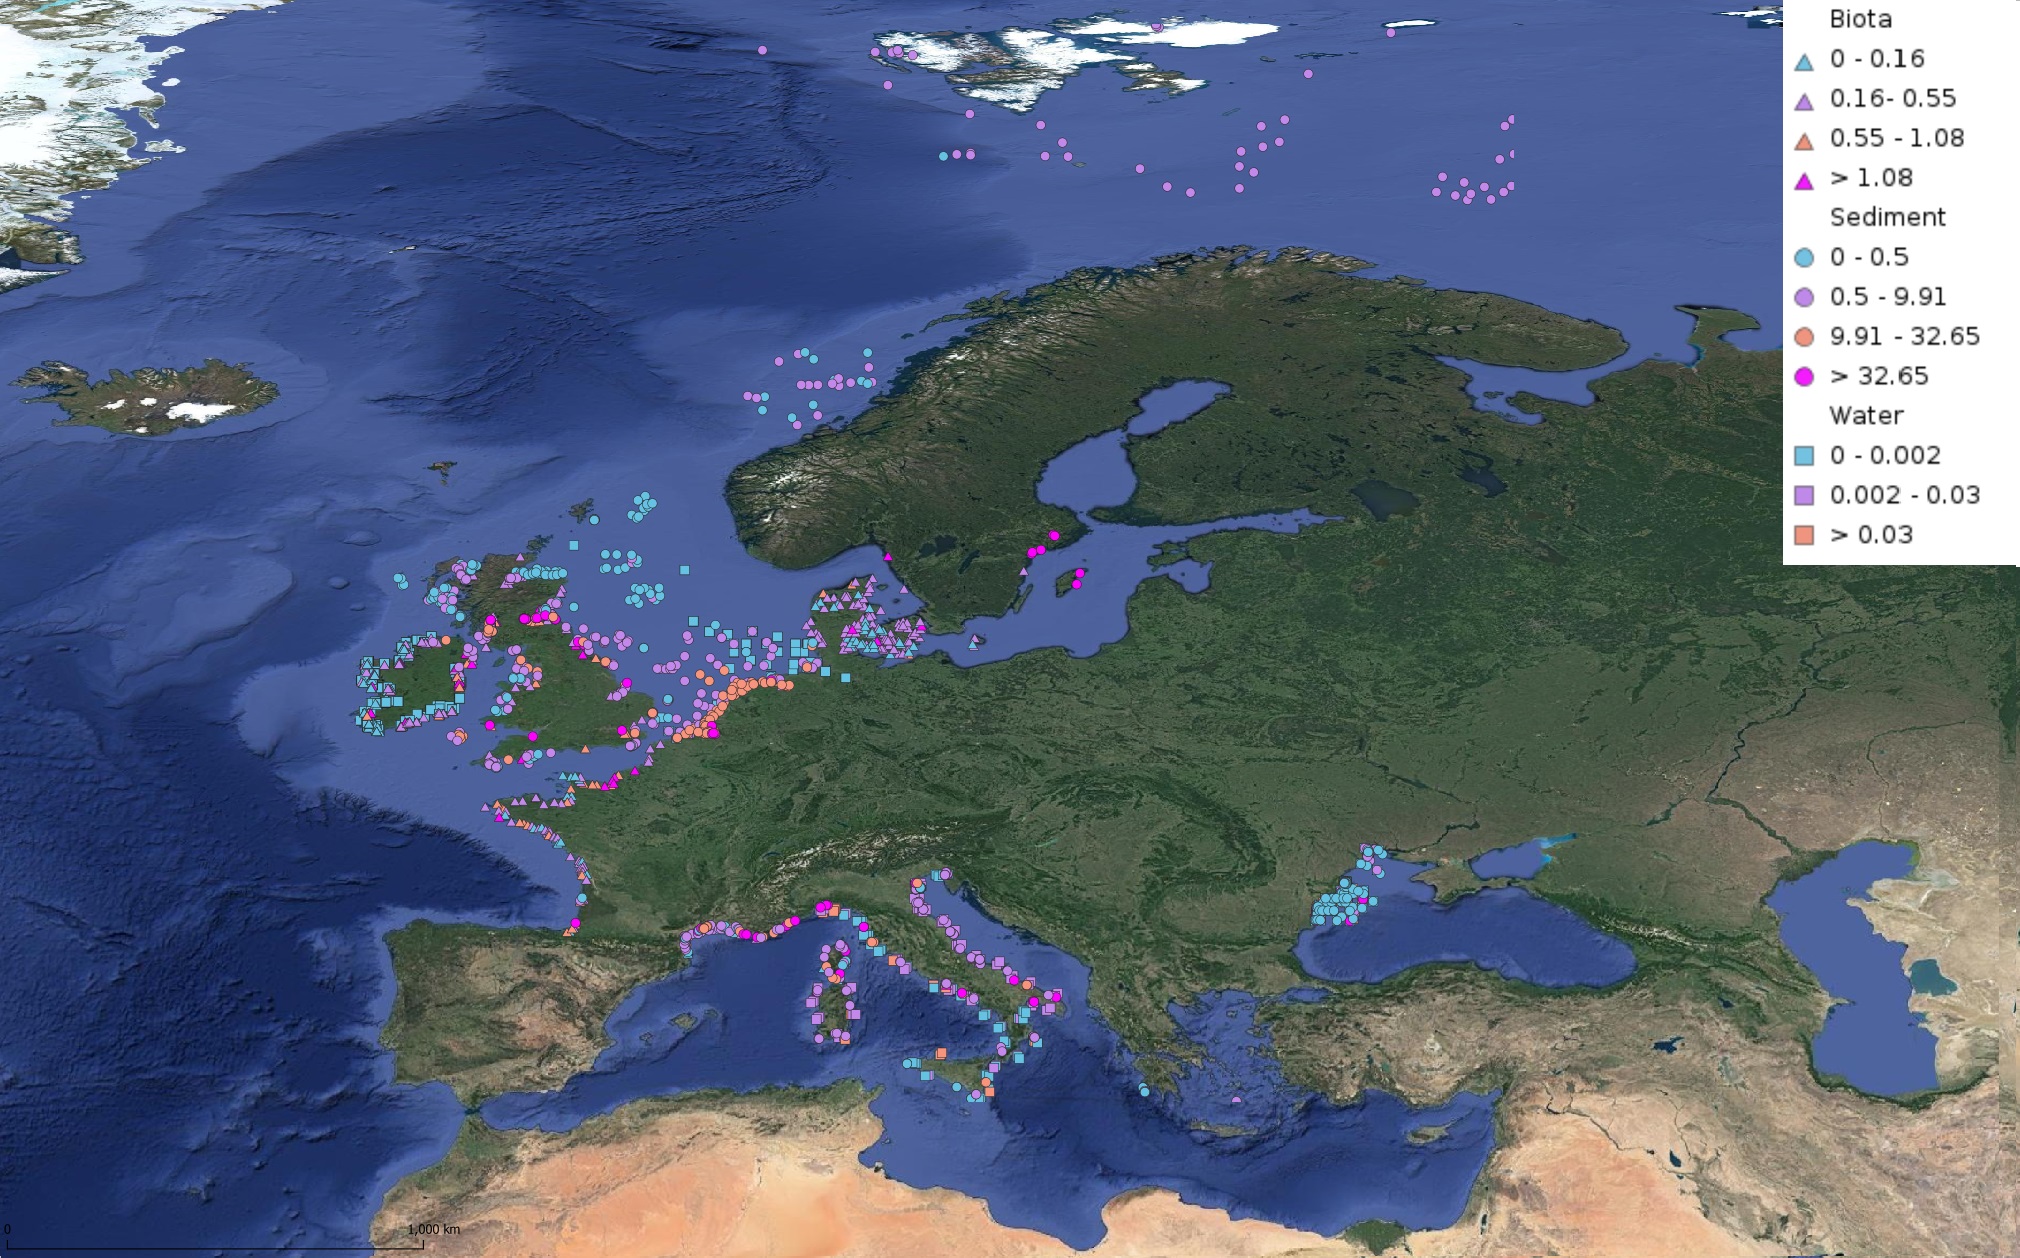
This product displays for Anthracene, median values of the last 6 available years that have been measured per matrix and are present in EMODnet validated datasets. The median values ranges are derived from the following percentiles: 0-25%, 25-75%, 75-90%, >90%. Only "good data" are used, namely data with Quality Flag=1, 2, 6, Q (SeaDataNet Quality Flag schema). For water, only surface values are used (0-15 m), for sediment and biota data at all depths are used.