Introduction by Conor Delaney, EMODnet Technical Coordinator
A core service of EMODnet is the creation and publication of integrated European-scale marine data layers and data products spanning the marine environment and human activities. The launch of the EMODnet unified portal (January 2023) was a huge technical achievement, not least because it included a new common EMODnet MapViewer (also known as the GeoViewer) that unified the geodata viewer services of all the previous 7 EMODnet thematic portals into one. This was a gamechanger for users since the EMODnet MapViewer makes it easier for users to view and access all of EMODnet’s diverse products in one place by providing a central data Discovery, Visualization and Download service, see Figure 1. The Map Viewer includes all of EMODnet’s flagship data products. And the metadata catalogue underpinning the discovery service has an even greater wealth of data layers and data products. In this blog we look at some of the key features of the MapViewer and how they can be used to explore the properties of EMODnet data products.
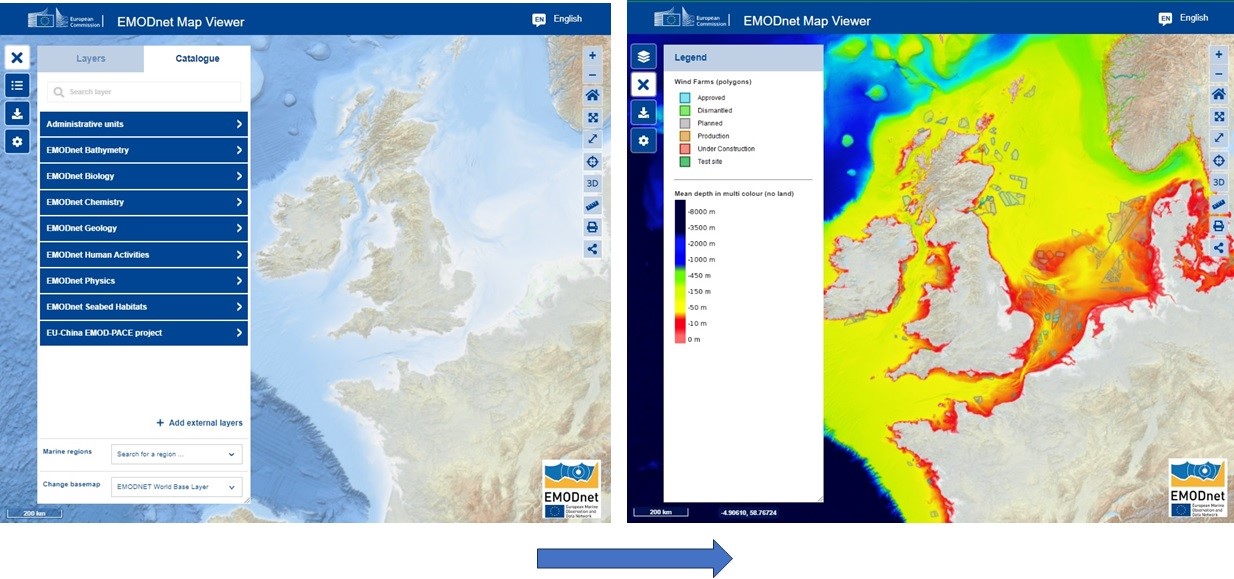
Figure 1: The EMODnet Map Viewer. The core products of EMODnet are presented as selectable layers in the Catalogue, where the user selects a thematic area e.g., ‘Bathymetry’ to open a list of Bathymetry data layers and products (see left image above). Once selected, a layer is visualised on the map together with legends (see right image above). Users can use the visualisation to select an area of a layer to download.
A Data Discovery and Download Service
An important distinction to make here is that while the EMODnet MapViewer provides some of the visualization controls of a traditional Geographical Information System (GIS) it does not provide any geospatial processing services, such as geostatistical processing, and is therefore not a GIS system. This is intentional! The primary role of the MapViewer is to aid the discovery and download of EMODnet products.
Tools for tailoring your marine data maps
The EMODnet Map Viewer offers several functionalities (controls) for a user to tailor maps. In Figure 2 (below), you can see that these map controls are grouped into 2 distinct collections. The controls on the lefthand side of the Map Viewer are used for visualising EMODnet products layers and downloading data products. On the right side of the map are a group of controls, used to navigate the displayed EMODnet layers.
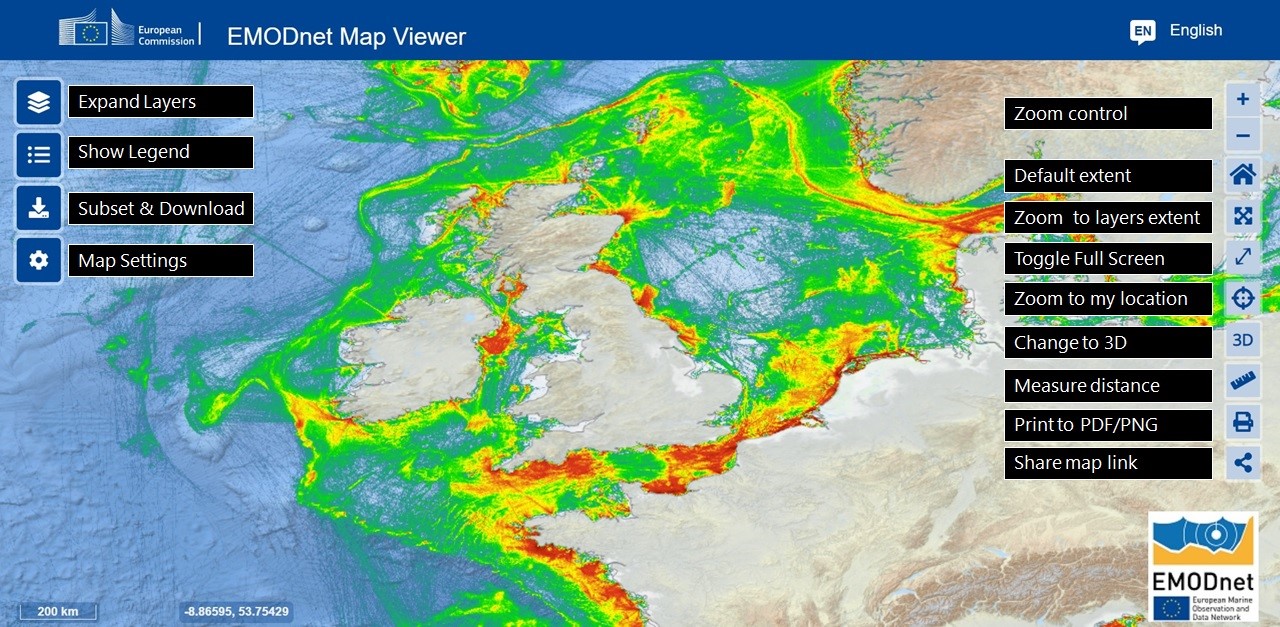
Figure 2: The EMODnet Vessel Density layer is visualized on the Map Viewer. A number of options to tailor the map (e.g., zoom control, changing map projection etc) are offered, and these can be used to interact with the layer.
Other useful tools are the ‘Change basemap’, which is accessible from the ‘Layers’ tab, see Figure 3 below. In addition, clicking on the features of a layer, for example a point of interest on an Aquaculture layer, will trigger a pop-up window containing extra information about the layer in question.
It is also possible to change the geometric projection of how a layer is displayed. This functionality is accessed through the ‘gear or cog’ button in the lefthand collection of tools. Clicking on this tool triggers the display of a form that allows users to change the projection of the layer and it also provides an option to change the format of the coordinates between decimal and degrees.
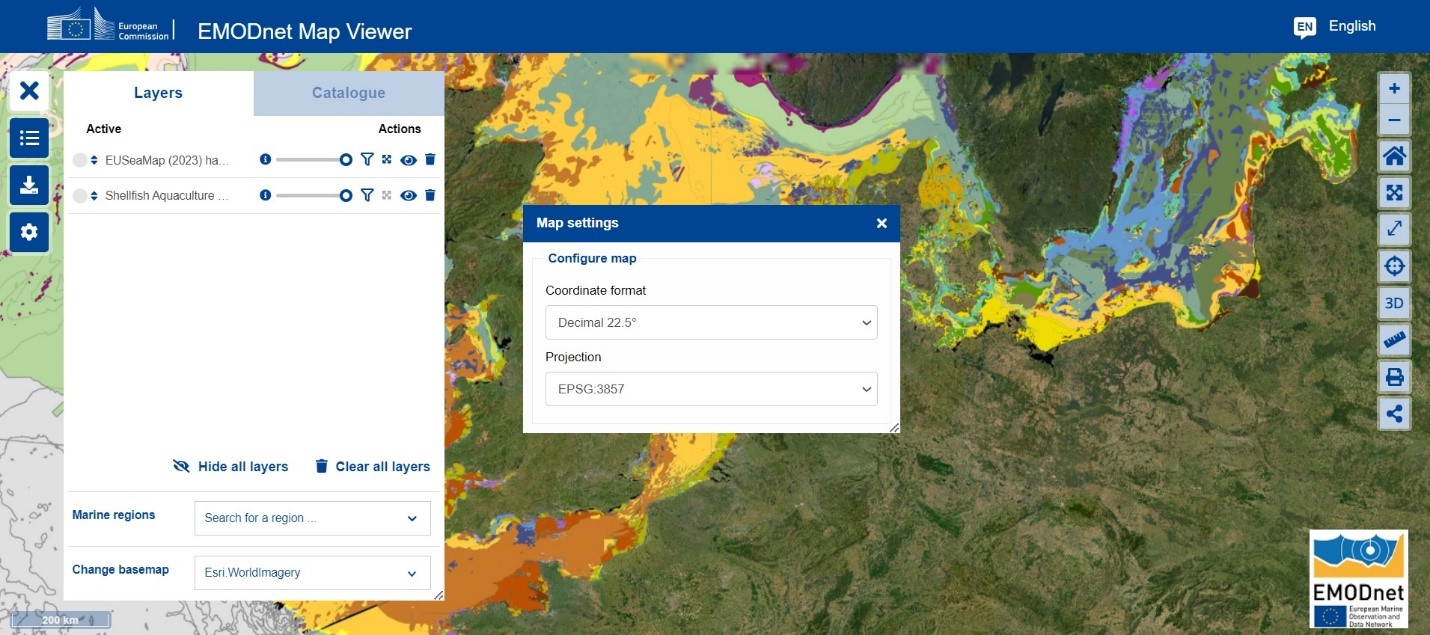
Figure 3: The Map Settings tool, is accessed by clicking the ‘COG’ button in the lefthand collection of tools.
For the next version of the MapViewer the projection tool will be updated to included English descriptions of the projection options. The list of projections is:
- EPSG:3857 → WGS 84 / Pseudo-Mercator
- EPSG:4326 → WGS 84 - World Geodetic System 1984
- EPSG:3034 → ETRS89-extended / LCC Europe
- EPSG:3035 → ETRS89-extended / LAEA Europe (Arctic view)
- EPSG:3031 → WGS 84 / Antarctic Polar Stereographic
The next version of the MapViewer will be released over the Summer of 2024
Thematic-specific control
Some thematics have additional controls that are specifically applicable to the thematic/parameters. For instance, the ‘Elevation Profile’ only appears when you have selected the depth layer from the Bathymetry group of layers.
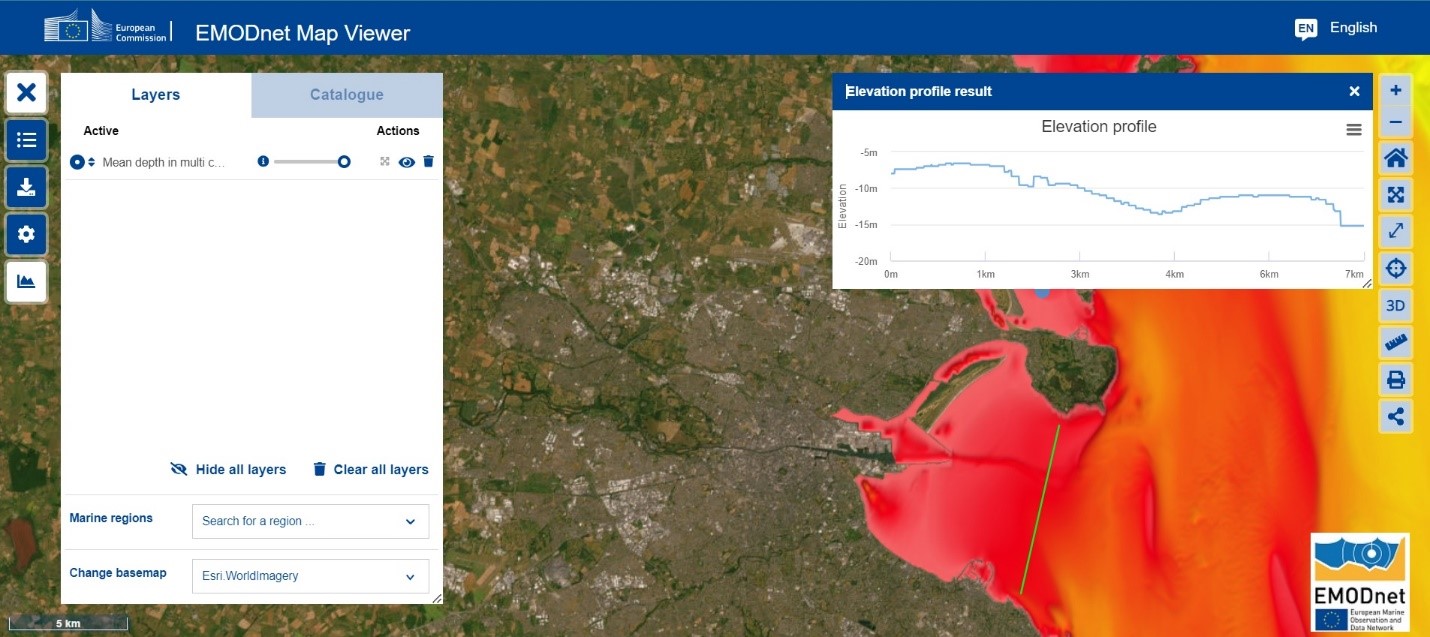
Figure 4: EMODnet Map Viewer. Selecting the Bathymetry Mean Depth layer reveals a Depth/Elevation profile control that allows users to see the depth of the sea between two points on the map.
In Figure 4, the base map has been changed to ‘Esri World Imagery’, to highlight the city of Dublin, Ireland, then the ‘Elevation profile’ tool is used to illustrate the depth across Dublin Bay.
Download tool
Finally, the most powerful tool in the collection on the left of the map is a the ‘Download’ tool, see Figure 5 below. Clicking on this tool will start a series of tasks that will allow the user to draw a box on the map viewer and download the data contained within that box in a number of different formats.
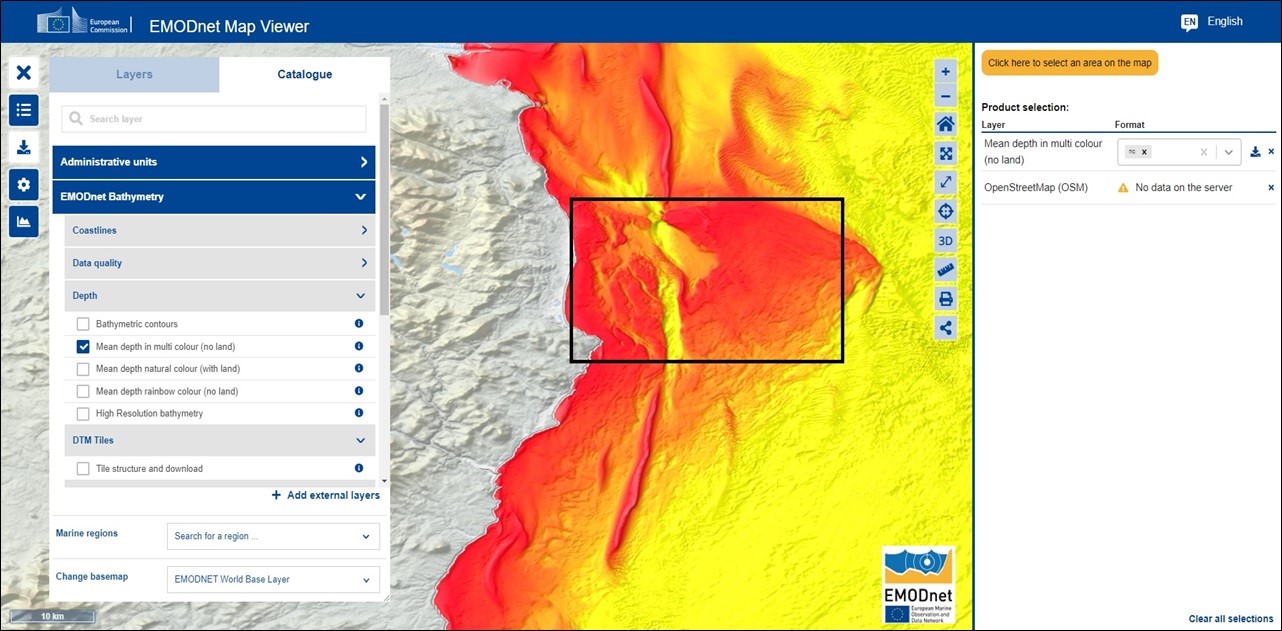
Figure 5: In this image, the EMODnet Map Viewer ‘Download’ tool on the left was clicked, and this in turn opened select region and download service on the righthand side. A region has been selected by drawing a box on the map.
Please note that in some cases this download functionality is not available (for technical reasons) for a particular layer. If this is the case you will be able to download the complete data product of interest by clicking on the ‘i’ icon beside the selected layer in the ‘Catalogue’ tab, see Figure 5.
Some technical insights
EMODnet is a federated Spatial Data Infrastructure (SDI), that is to say, it is a network of geo-data servers spread across Europe, each of which is maintained by the respective EMODnet thematic, e.g., Bathymetry, Biology, Geology etc. Each of the geo data servers publish their respective EMODnet products using the Open Geospatial Consortium (OGC) standards for geodata webservices. These data services are used by the MapViewer, in essence when a user interacts with the EMODnet layers of the MapViewer they are generating data request messages that are passed to the background SDI. EMODnet’s data/webservices are open access, available to all, so the MapViewer is not only acting as a Data Discovery and Download service but also as a showcase of the power, scale, and flexibility of the EMODnet webservices.
The future
We will be releasing an updated version of the MapViewer over the Summer of 2024 and there will be another release towards the end of 2024. EMODnet services continue to evolve, and it is expected that there will be an updated version of the MapViewer twice a year.
 are offered, and these can be used to interact with the layer.")