 EMODnet Product Catalogue
EUNIS
Type of resources
Available actions
Topics
Keywords
Contact for the resource
Provided by
Years
Formats
Representation types
Update frequencies
status
Scale 1:
-
Mapped Habitats, captured from multibeam bathymetry and derived layers by geophysicist and ecologist. JNCC undertook a survey with Marine Scotland Science to Pobie Bank Reef cSAC with the aim of gathering high quality evidence to better ascertain the distribution of bedrock and stony reef for the development of management advice. Multibeam bathymetry and backscatter data and sidescan sonar data were collected, as were benthic infaunal and PSA samples and underwater stills and video imagery. Data were gathered from the FRV Scotia from 23rd August to 6th September 2013. Data (acoustic and underwater camera tow video and stills) from two SEA surveys undertaken at Pobie Bank Reef cSAC in 2003 and 2006 were made available and utilised in the analysis. Also available is a biological data interpretation report based on these data. The report was prepared by Envision in 2009, and contains the most recent habitat map for Pobie Bank Reef cSAC.
-
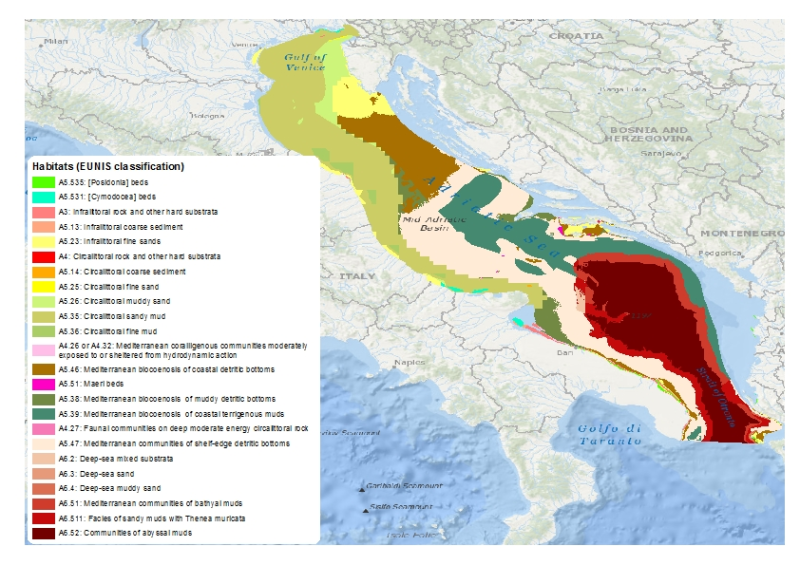
This layer is a predictive EUNIS seabed habitat map for the Adriatic Sea. It was performed within the framework of EMODnet Phase 2 Thematic Lot n┬░ 3 (aka EUSeaMap2). It is a preliminary version which will be refined during the course of the project. The layer was created using two pre-processed input datasets: substrate and biological zone. The seabed substrate type layer was a compendium of historical maps (Emodnet phase 2 Geology lot first release + IBCM map). The biological zones layer, available in this catalog under the title 'Biological zones of the Adriatic Sea', was modeled thanks to layers of bathymetry and light attenuation. The map follows the EUNIS 2007-11 classification system. It does not include the intertidal zone. The study followed the methodology developped within the EUSeaMap project (EMODnet phase 1). For more details about the methodology see EUSeaMap final report (Cameron and Askew, 2011) or Coltman et al., 2008. For more details about the current map see EUSeaMap2 interim report (EMODnet Thematic Lot n┬░ 3, 2014) Cameron, A., Askew, N. (eds.), 2011. EUSeaMap - Preparatory Action for development and assessment of a European broad-scale seabed habitat map final report. URL: http://jncc.gov.uk/euseamap Coltman, N., Golding, N., Verling, E., 2008. Developing a broadscale predictive EUNIS habitat map for the MESH study area. 16 pp. URL: https://www.emodnet-seabedhabitats.eu/resources/mesh-archive/. EMODnet Thematic Lot n┬░ 3, 2014. EMODnet Phase 2 - Annual (interim) report. Reporting Period: Sept. 2013 to Aug. 2014. URL: http://www.emodnet-seabedhabitats.eu/pdf/20140909_euseamap2_year1_report.pdf
-
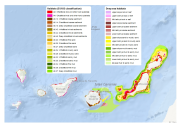
This layer is a predictive EUNIS seabed habitat map for the Canary Islands. It was performed within the framework of EMODnet Phase 2 Thematic Lot n┬░ 3 (aka EUSeaMap2). It is a preliminary version which will be refined during the course of the project. The layer was created using two pre-processed input datasets: substrate and biological zone. The seabed substrate type layer was a compendium of historical maps (Emodnet phase 2 Geology lot first release + Datasets from Instituto Espa├▒ol de Oceanograf├¡a). The biological zones layer, available in this catalog under the title 'Biological zones of the Canary Islands and Madeira archipelago', was modeled thanks to layers of bathymetry and light attenuation. The map follows the EUNIS 2007-11 classification system supplemented by additional categories in deep sea areas (Howell et al., 2010). The map does not include the intertidal zone. The study followed the methodology developped within the EUSeaMap project (EMODnet phase 1). For more details about the methodology see EUSeaMap final report (Cameron and Askew, 2011) or Coltman et al., 2008. For more details about the current map see EUSeaMap2 interim report (EMODnet Thematic Lot n┬░ 3, 2014) Cameron, A., Askew, N. (eds.), 2011. EUSeaMap - Preparatory Action for development and assessment of a European broad-scale seabed habitat map final report. URL: http://jncc.gov.uk/euseamap Coltman, N., Golding, N., Verling, E., 2008. Developing a broadscale predictive EUNIS habitat map for the MESH study area. 16 pp. URL: https://www.emodnet-seabedhabitats.eu/resources/mesh-archive/. EMODnet Thematic Lot n┬░ 3, 2014. EMODnet Phase 2 - Annual (interim) report. Reporting Period: Sept. 2013 to Aug. 2014. URL: http://www.emodnet-seabedhabitats.eu/pdf/20140909_euseamap2_year1_report.pdf Howell, K.L., 2010. A benthic classification system to aid in the implementation of marine protected area networks in the deep/high seas of the NE Atlantic. Biological Conservation 143, 1041ÔÇô1056.
-
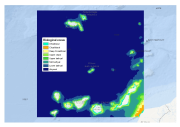
This layer is a model of the biological zones of the Canary Islands and Madeira archipelago. It was performed within the framework of EMODnet Phase 2 Thematic Lot n┬░ 3 (aka EUSeaMap2). It is a preliminary version which will be refined during the course of the project. This layer was modelled with the use of base layers that were the bathymetry (Gebco_08) and the kdpar (bespoke computed layer) The biological zones boundaries were defined in the following way. - Infralittoral lower limit: limit at which the percentage of light reaching the seabed is 1%. The percentage of light layer was calculated by intersecting the kdpar and the bathymetry layers. For more details about this calculation see e.g. Cameron and Askew (2011). - Circalittoral lower limit: depth 80m - Deep circalittoral lower limit: depth 200m - Upper slope lower limit: depth 750m - Upper bathyal lower limit: depth 1100m - Mid bathyal lower limit: depth 1800m - Lower bathyal lower limit: depth 2700m Deep biological zones (from upper slope to abyssal) were chosen according to the classification proposed by Howell (2010). For more details about the current layer see EUSeaMap first year report (EMODnet Thematic Lot n┬░ 3, 2014) Cameron, A., Askew, N. (eds.), 2011. EUSeaMap - Preparatory Action for development and assessment of a European broad-scale seabed habitat map final report. URL: http://jncc.gov.uk/euseamap EMODnet Thematic Lot n┬░ 3, 2014. EMODnet Phase 2 - Annual (interim) report. Reporting Period: Sept. 2013 to Aug. 2014. URL: http://www.emodnet-seabedhabitats.eu/pdf/20140909_euseamap2_year1_report.pdf Howell, K.L., 2010. A benthic classification system to aid in the implementation of marine protected area networks in the deep/high seas of the NE Atlantic. Biological Conservation 143, 1041ÔÇô1056.
-
The objective of this project was to generate seabed habitat maps for locations with full coverage acoustic datasets to as detailed a hierarchical level as possible within the Marine Habitat Classification for Britain and Ireland (version 04.05), also known as MNCR classification, (Connor et al. 2004). The acoustic data were at various stages of processing and interpretation, therefore the mapping of habitats and biotopes in some areas have required a greater amount of work to reach the same level compared to other areas. The constituent polygons within the habitat/biotope maps are labelled to an appropriate level of the Habitat Classification and translated to the corresponding EUNIS code. In order to generate seabed habitat maps for the areas the data associated with each area were required to undergo some preliminary preparation and processing in order to ensure suitability and compatibly with the mapping methodologies employed. The data were then processed using a top-down approach was adopted based on the methods developed by MESH and UKSeaMap and used by EUSeaMap, which utilised the updated seabed substrate information provided by BGS. Habitat maps for the area have been produced (the level of habitat detail which could be mapped was restricted to level 3 or 4 of the EUNIS classification and level 2 or 3 of the MNCR classification) with associated metadata and peripheral supplementary data to aid in future analysis and interpretation. A confidence assessment using the MESH confidence assessment method has been undertaken for each habitat map produced and certainty of classification maps accompany each habitat map also.
-
The results of the habitat mapping exercise were derived from aerial photography interpretation (API). The shapefiles produced are available to holders of OS MasterMap licenses. The habitat mapping dataset is held at Plymouth Coastal Observatory however, the Environment Agency is responsible for the GIS data as it was creating using their MasterMap licence. The survey extends from Portland Bill in Dorset to Avonmouth in Bristol and includes the Isles of Scilly. The landward limit of the survey varied but in general is determined by one of the following: Extent of aerial photography; Indicative tidal floodplain; Sites of Special Scientific Interest (SSSIs); Extent of coastal BAP habitats; 5m contour with a 200m landward buffer ; Inclusion of other target habitats. The habitat map was originally created using the Integrated Habitat Survey (IHS) classification originally developed by Somerset Environmental Records Centre. The classification was broadened to include all coastal habitats in South West England. The IHS classification had been substantially modified for the purposes of the habitat mapping. THIS was converted to EUNIS L3 by Ian Saunders at NE and forms the data NE provided to the JNCC as part of the MCZ project ÔÇô Tranche 1. A MESH Confidence Score of 86 was assigned to the dataset based on the information given in the reports supporting the GIS. Orthorectified aerial photography used was flown to a scale of 1:5000. Photography was flown at low tide on a spring tide between the months of April and September to ensure maximum vegetation coverage. As a result of this and due to adverse weather conditions over some of the key tidal windows the whole project area was not captured in one block, but flown in stages between 2006 and 2009. Although ground-truthing was undertaken to support and validate the habitat map, not all areas were ground-truthed.
-
A broadscale habitat layer was produced by analysing and interpreting the acoustic and ground truth data collected during a JNCC commissioned RV Corystes survey undertaken by the AFBI (Agri-Food and Biosciences) between 16/02/12 and 29/02/12. PSA data were used to assign each sample a EUNIS class which then informed the semi-automated process of map production using object-based image analysis (OBIA). Statistical modelling was combined with the OBIA image analysis to aid production of the final broadscale habitat map.
-
Interpretation of Multibeam Bathymetry and Backscatter data from the Cartopep campaign (1995). Multibeam bathymetry data processed with the Caraibes software (v3.9) and a 30m grid created. The data was acquired in 1995 when multibeam systems were first emerging onto the commercial market. The number of beams per ping was limited and thus the data density low in comparison to more modern data. Data editting was only done on data that was significantly in error. The multibeam backscatter data was also processed in the Caraibes software package and produced 2 mosaics at 50m resolution. The backscatter data did not have higher resolution data. Correlation with ground truth data, consisting of sediment samples and photographic imagery samples, predominantly toward the top of slope and seamount summit and flanks,allowed basic interpretation of the bathymetry and backscatter data near the sample locations. To aid interpetation, the sediment samples had been divided into FOLK categories and habitat type determinations, as well as faunal communities in some instances, had beeen made for the photographic imagery samples. Characterisation was spread over the whole area and divided into polygon regions by finding interpretive boundaries on either backscatter imagery (such as texture changes or contrast changes) or on the bathymetric layers of slope, rugosity and relief.
-
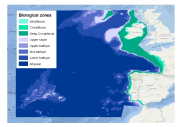
This layer is a model of the biological zones of the EU's 'Atlantic Area 2007-2013'. It was performed within the framework of MeshAtlantic project (INTERREG ÔÇÿAtlantic Area 2007-2013ÔÇÖ program). This layer was modelled with the use of bespoke base layers that were the bathymetry, wave wavelength and the kdpar The biological zones boundaries were defined in the following way. - Infralittoral lower limit: limit at which the percentage of light reaching the seabed is 1%. The percentage of light layer was calculated by intersecting the kdpar and the bathymetry layers. For more details about this calculation see e.g. Vasquez et al. (in press). - Circalittoral lower limit: limit at which the ratio wave wave length over the depth equals 2.53 - Deep circalittoral lower limit: break of slope due to the entrance into the continental slope. This limit was digitalized with the use of the bathymetry layer - Upper slope lower limit: depth 750m - Upper bathyal lower limit: depth 1100m - Mid bathyal lower limit: depth 1800m - Lower bathyal lower limit: break of slope due to the entrance into the abyssal plain. This limit was digitalized with the use of the bathymetry layer Deep biological zones (from upper slope to abyssal) were chosen according to the classification proposed by Howell (2010). For more detail see Vasquez et al. (in press) Howell, K.L., 2010. A benthic classification system to aid in the implementation of marine protected area networks in the deep/high seas of the NE Atlantic. Biological Conservation 143, 1041ÔÇô1056. Vasquez, M., Mata Chac├│n, D., Tempera, F., OÔÇÖKeeffe, E., Galparsoro, I., Sanz Alonso, J. L., Gon├ºalves, J.M.S., Bentes, L., Amorim, P., Henriques, V., McGrath, F., Monteiro, P., Mendes, B., Freitas, R., Martins, R., Populus, J., In press. Broad-scale mapping of seafloor habitats in the north-east Atlantic using existing environmental data.
-
Biogenic horse mussel (Modiolus Modiolus) reef is an important feature of the Pen Llyn a'r Sarnau SAC. The reef has high biodiversity and is vulnerable to anthropogenic activities, such as benthic fishing. The mussel reef forms an undulating surface that is significantly different to the surrounding seabed and therefore acoustic monitoring methods can be used to monitor changes in extent and identity areas of potential damage. Work is carried out on the north Llyn horse mussel reef in Pen Llyn a'r Sarnau jointly by CCW and University of Wales Bangor. Project is carried out in conjunction with the Across Wales drop-down video project.