 The Coast Challenge aimed to produce spatial data layers and time plots for parameters, namely sea level rise and sediment balance per stretch of coast for the Arctic study area.
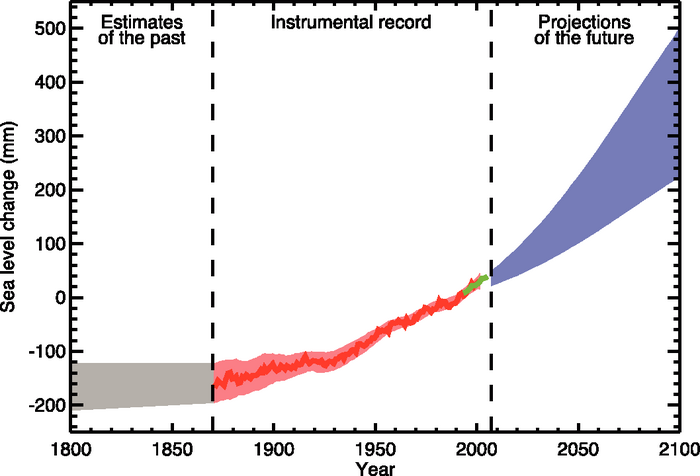
Sea level rise is influenced by changes in atmospheric pressure, melting of sea ice and the polar ice caps and water temperature. A dramatic sea level rise acceleration in the Arctic Ocean was reported in the 1980s. The changes in the patterns of wind-driven and thermohaline circulation may account for most increase of sea level in the Arctic Ocean and their accumulative action can explain more than 80% of the sea level variability during 1950-1990. In light of global change, this sea level rise could be a manifest of warming in the Arctic coupled with a decrease of sea ice extent, warming of the Atlantic waters, changes in the Arctic Ocean circulation, and an increase in coastal erosion and thawing of permafrost. More information on data availability for sea level rise can be found below:
Sea level in the Arctic
Read more
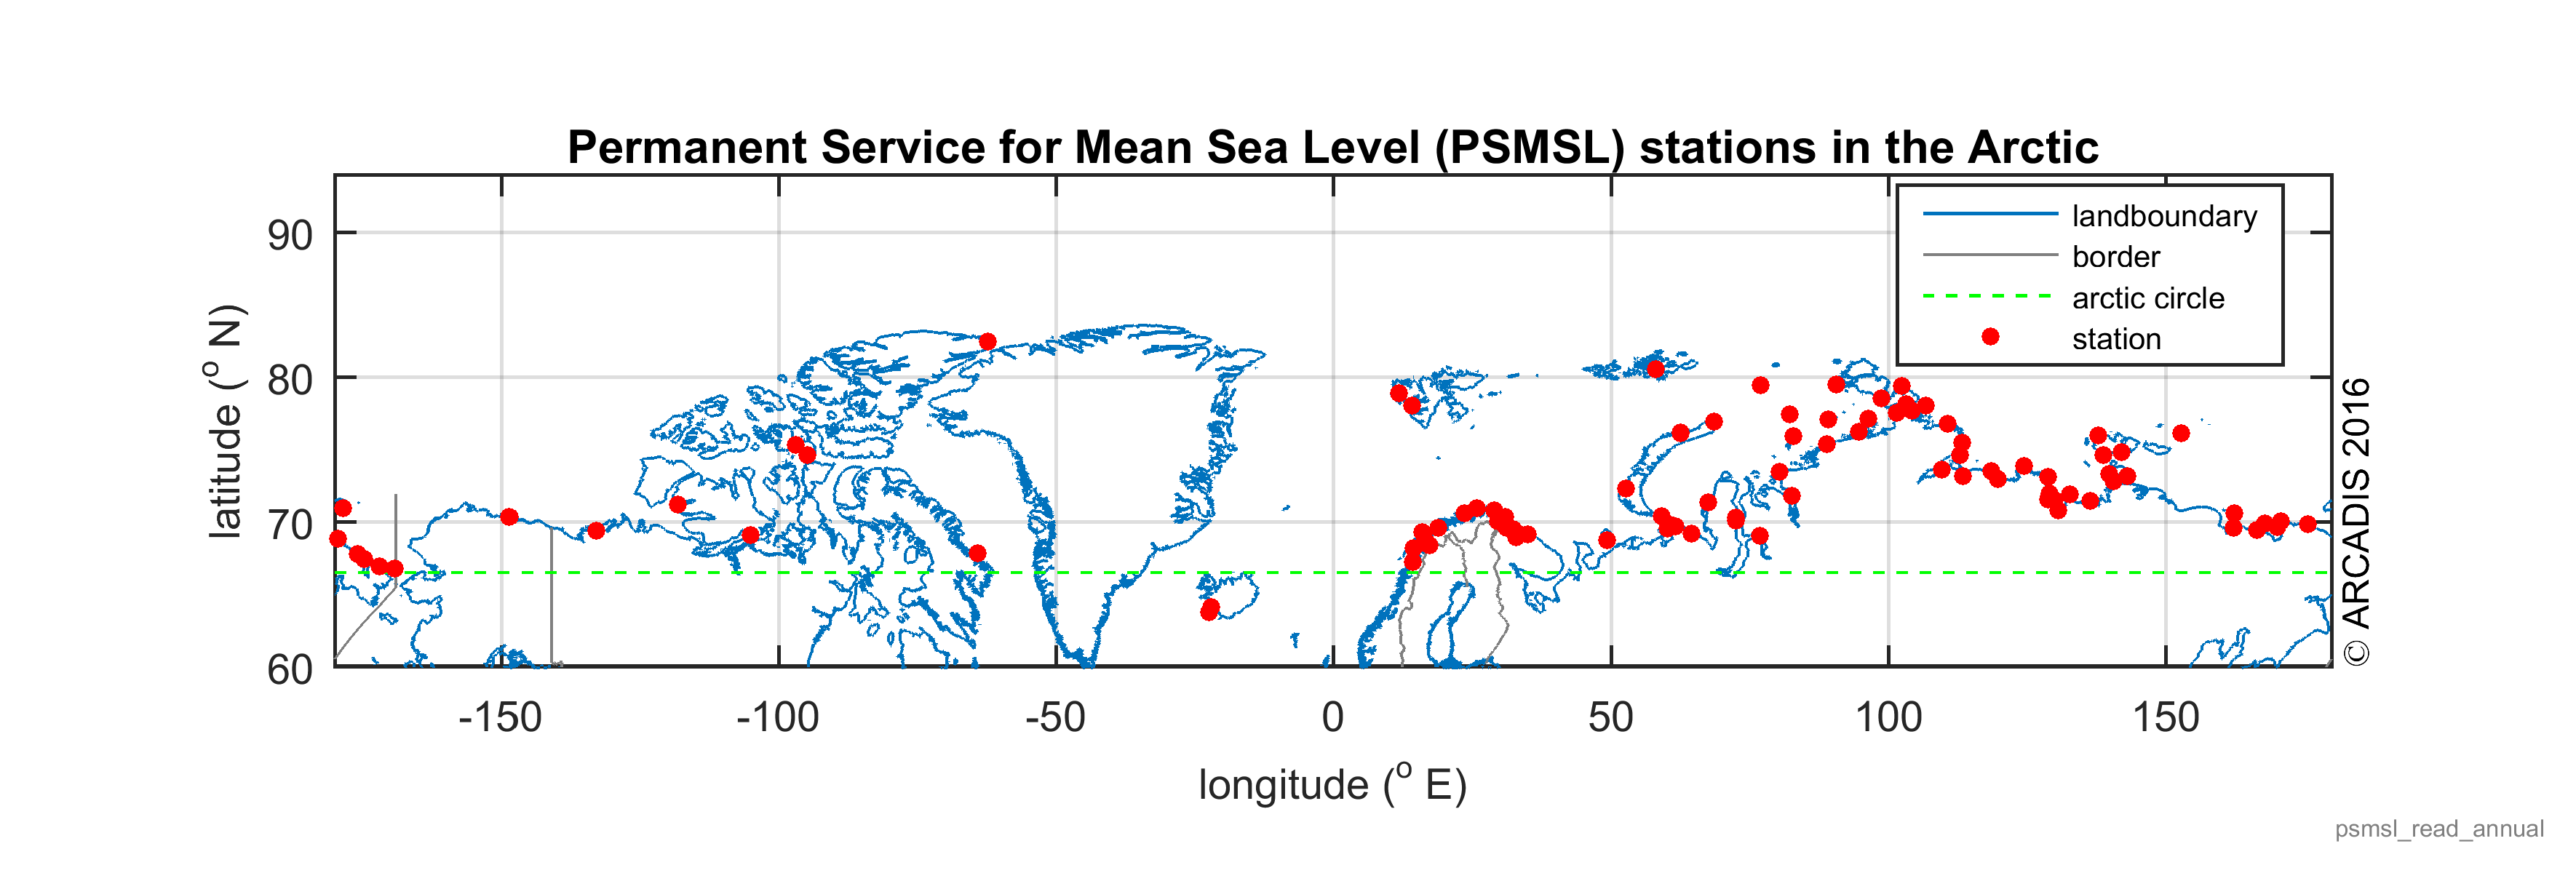
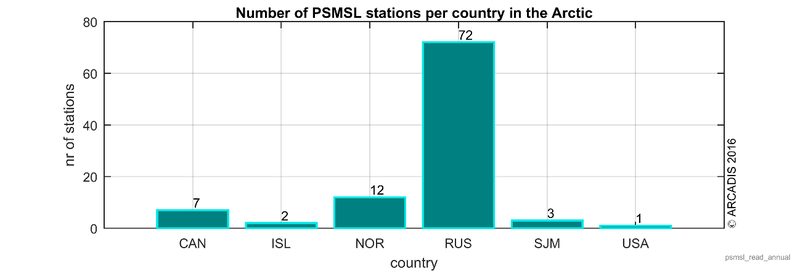
Most important data source for sea level data is the Permanent Service for Mean Sea Level (PSMSL). The PSMSL global data bank contains data from 1461 stations worldwide of which 95 are located in the Arctic circle and two on Iceland just below the Arctic circle. The figures below shows the locations of PSMSL stations in the Arctic and the number of stations per country. The data can be downloaded free of charge from http://www.psmsl.org/data/. There is no PSMSL data available for Greenland.
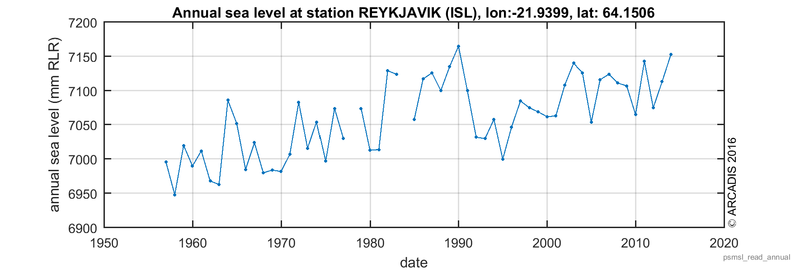
The PSMSL data are reduced to a common datum, namely the Revised Local Reference (RLR), which is defined to be approximately 7000 mm below mean sea level. The data is not corrected for land subsidence. The figure below shows an example of a time series of annual sea level relative to this RLR at Reykjavik on Iceland. The sea level rise amounts to 2.2 mm/year at this station with a 95% confidence bandwidth between 1.6 and 2.9 mm/year. The green dashed line indicates the 50% bandwidth for future observations.
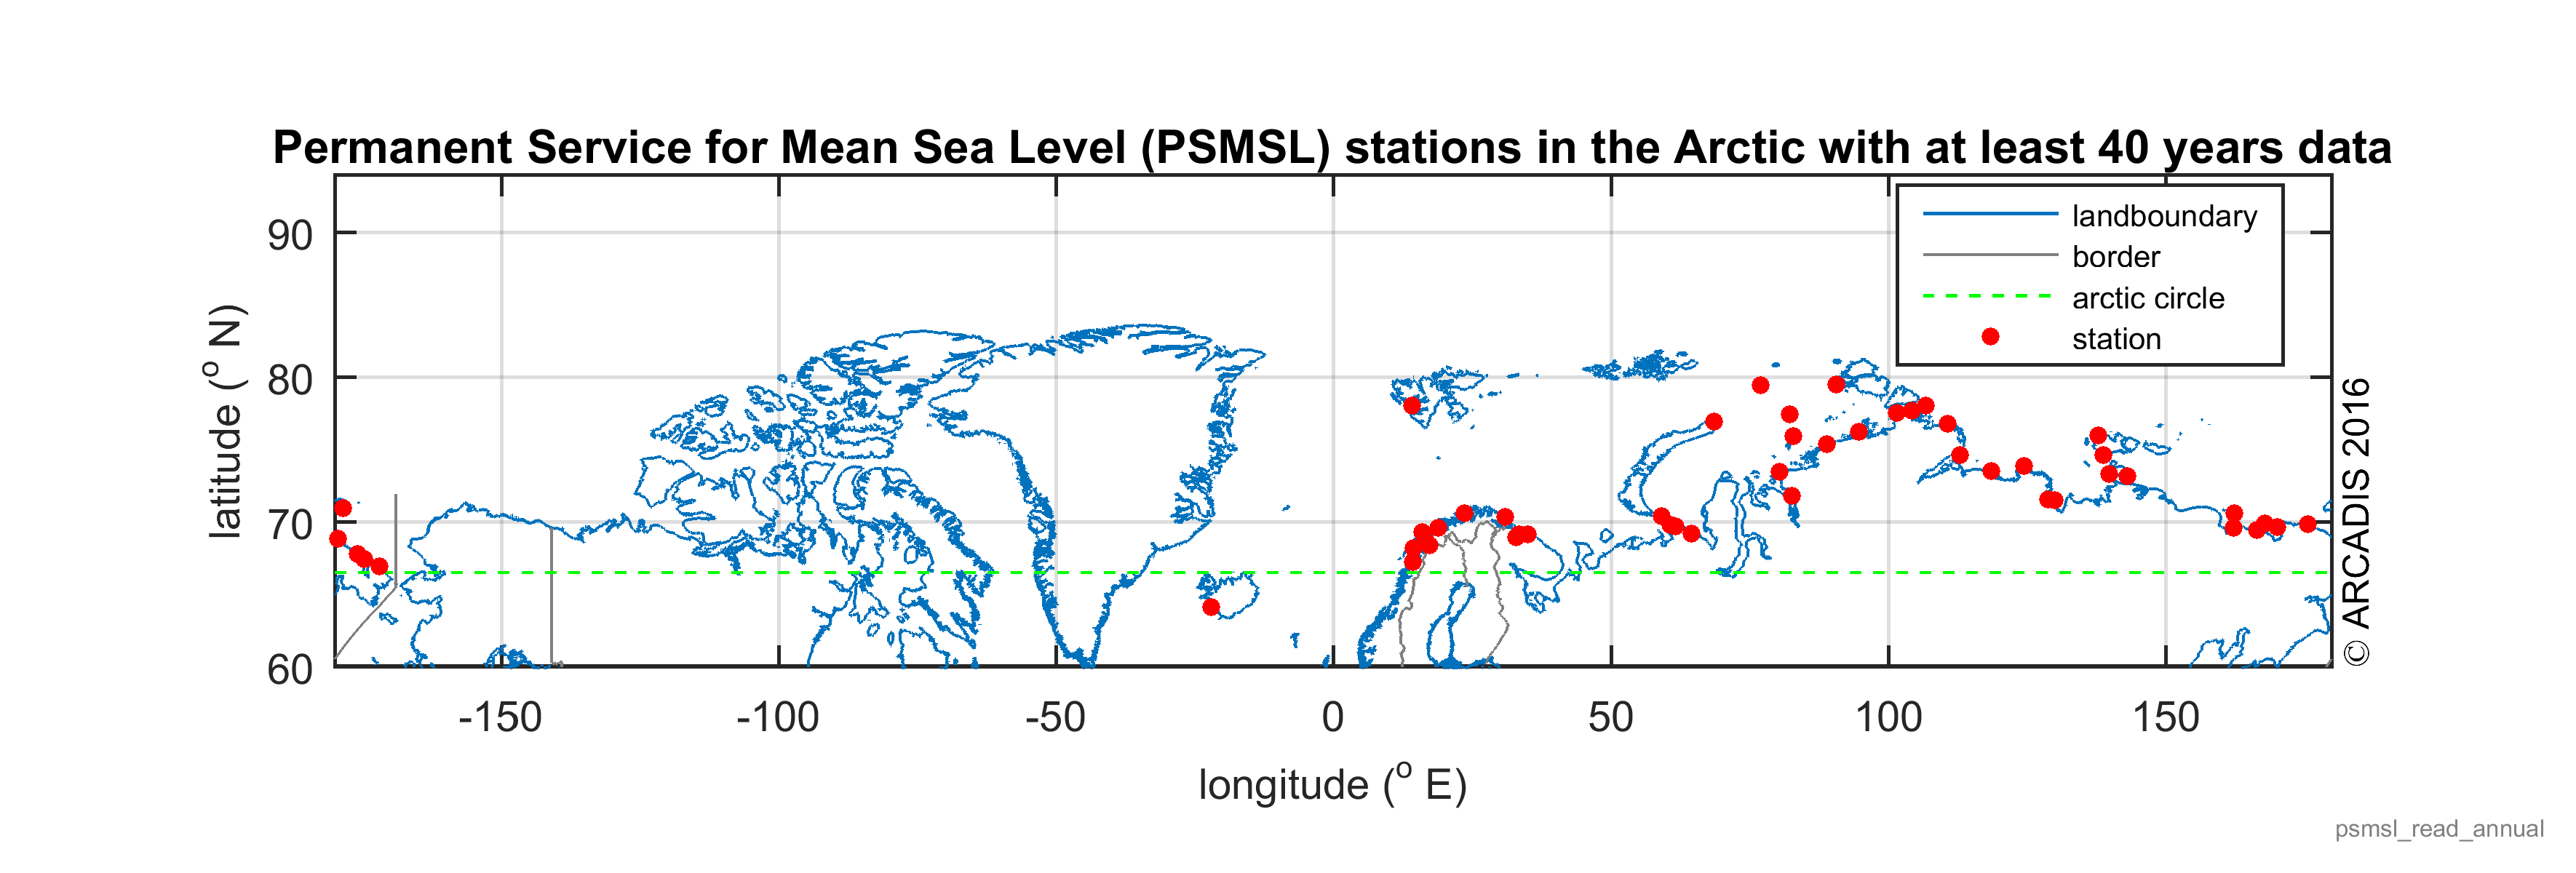
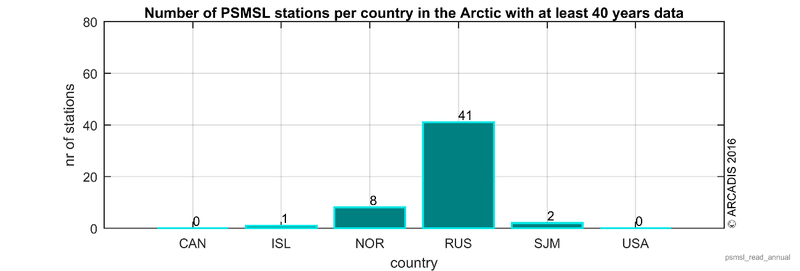
For many applications (including climate change studies) the long term time series are required. The map below shows the locations of sites with at least 40 years of RLR data, which are the most useful records for studies of long term sea level trends. Note that the coverage of this map is much poorer than that of the previous map. The number of stations in the Arctic with this long term temporal coverage amounts to 52. There is no long term data available in Greenland, Canada and the USA.
This also affects the sediment balance, which is defined as the amount of each type of sediment present along the Arctic coast. Thousands of kilometers of Arctic sea coast retreat 2-6 m/year under that action of shore erosion. This means that tens of square kilometers of Arctic land are consumed by the sea every year. This shore erosion is a source of sediment coming into the sea from the land. Therefore, it plays a part in formation of the Arctic sea sediment balance. Sediment discharge from rivers is a second important input into the sediment balance.
In this challenge we assessed whether the availability, consistency and resolution of existing data in these aspects is sufficient and if this is the case to calculate the average annual sea level rise and sediment balance per stretch of coast.

