European Commission logo
Energy, Climate change, Environment

Black Sea Checkpoint Overview

Targeted Audience

As a way to better understand their remit, “sea basin checkpoints” could be regarded as overarching observing systems. What they observe is the whole realm of marine data distributed among a great number of organizations, people and places and in a variety of systems addressing many different purposes. This massive amount of data features a lot of natural variability in terms of data appropriateness and conditions of availability for users’ applications. Data are partially and not homogeneously described either by metadata or by web pages and documentation within their repositories, which makes a first filter on data actual content and quality and introduces uncertainty as to what the data sets really are.
 

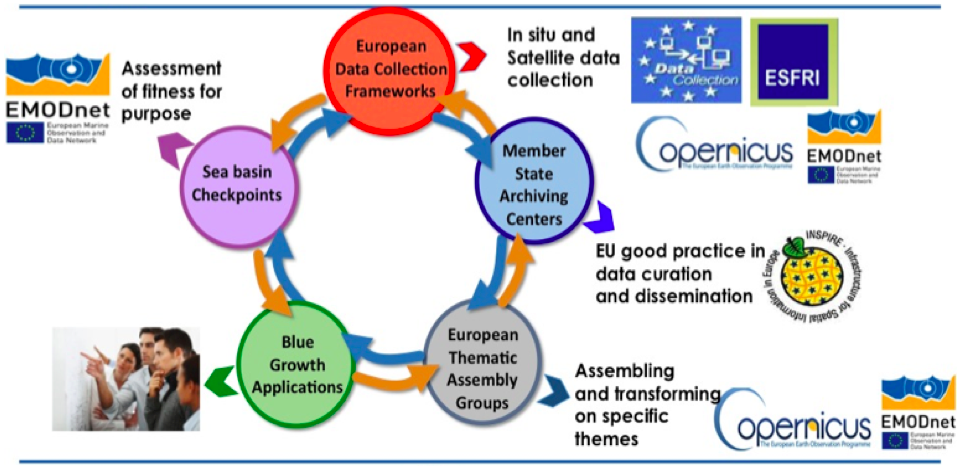
EU initiatives supporting the blue economy

The integrated checkpoint service was driven by two types of access/usage, one public and one restricted for project use (challenges partners, experts and contributors). The public service primarily served a range of potential stakeholders, from institutional policy-makers, to data producers and data providers to help improve the adequacy of existing monitoring systems for the scope of the EU maritime strategy. They are the main usage drivers.


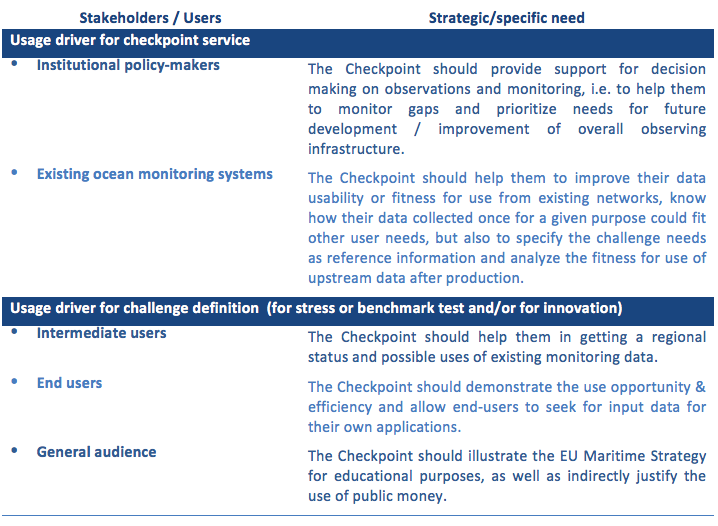
The checkpoint audience

For institutional policy makers, the checkpoint service should provide support for steering committee and decision making on observations monitoring and data management / dissemination infrastructure. This has been done by developing checkpoint e-services ingesting metadata and delivering indicators and statistics for identifying priorities, by challenge, by category of characteristics, by level of data after transformation process, and any type of relevant criterion (e.g. geographical area, elevation range, period of time, resolution…), highlighting gaps of the monitoring in addition to fact sheets and expert reports with proposed solutions.


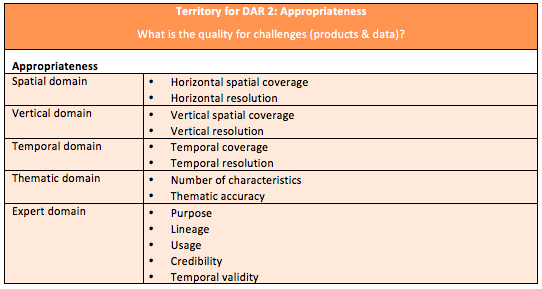
For the other stakeholder categories, it should help highlight how their collected data could fit other uses than their initial purpose, or demonstrate the potential of innovative applications thanks to the availability of upstream data sets. To this end the checkpoint challenges analysed the fitness-for-use of the upstream data according to the requirements they specified to produce the thematic products mandated by the EMODnet tender. The regional checkpoint has thus developed checkpoint e-service with indicators providing feedback on the availability and appropriateness of the upstream data described in the checkpoint catalogue all need information to evaluate fitness for use.

Terminology Used

Adequacy

Sufficient to satisfy a requirement or meet a need.

Appropriateness

What is made available to the challenge? What motivated / decided them to select one observation rather than another one ? This category is dependent on challenge.

Assessment criteria

This criteria aimed to characterize/depict the inputs in terms of 3 categories capable of showing performance and gaps in the present monitoring system, discovery from user point of view, availability as an intrinsic function, and appropriateness related to challenges activities.

Availability

How a characteristic is made available to the user ? This category is an intrinsic function no challenge dependent but taking into account the variety of user.

Category of characteristics

Specifically defined class of variables derived from observations or models and/or the geographical representation of an object.

Challenge

Marine or maritime applications of paramount importance for the European Marine Environment Strategy for stress or benchmark test and/or for innovation

• Energy and food security (renewable energy, fisheries & aquaculture management);
• Marine environmental variability and change (climate change, eutrophication, river inputs, bathymetry, alien species);
• Emergency management (oil spills, fishery impacts, coastal impacts);
• Preservation of natural resources and biodiversity (connectivity of Marine Protected Areas).

Characteristic

A “characteristic” is a distinguishing feature which refers:

• either a variable derived from the observation, the measurement or the numerical model output of a phenomenon or of an object in the environment,
• or to the geographical representation of an object on a map (ie a layer such as a protected area, a coastline or wrecks) by a set of vectors (polygon, curve, point) or a raster (a spatial data model that defines space as an array of equally sized cells such as a grid or an image).

Comparability

To examine things to assess how they are alike and how they are different; to judge one thing and measure it against another thing.

Compatibility

Things that can exist together without problems and conflicts.

Component

A component of a product (« data quality unit » of ISO 19157) is defined by a “combination of a scope and data quality elements” (ISO 19157). The scope “specifies the extent, spatial and/or temporal, and/or common characteristic(s)1 that identify the data on which data quality is to be evaluated” “A data quality element is …a certain aspect of the quality”.
In summary a component is a subset of a dataset to which a set of quality measures or descriptive evaluations apply.
See DPS definition (Data Product Specifications)

Data, Dataset, Collection of data sets, data set series

A data is a reinterpretable representation of information in a formalised manner suitable for communication, interpretation or processing (ISO 19115).
A dataset is an identifiable collection of data (ISO 19115). It can be a time series, a lithological description of a marine sample, a gridded dataset such as a DTM, an hydrodynamic model output, a GIS dataset or a feature layer of a GIS dataset, a data base or a table of values in a publication. A data set can be composed of several files (e.g. the set of seismic data files recorded along the same line).
A collection of data sets is a set of data sets.
A dataset series is a collection of data sets sharing the same specifications of production. This is the concept in use on the Inspire Geoportal.

Descriptor

Either raw metadata for discovery or raw criteria used to asses availability & appropriateness. Descriptors are referred to dataset series or a dataset.

DPS (Data product specifications)

The DPS, Data Product Specifications, is a precise technical description to build the desired (ideal) product in terms of the requirements that it will or may fulfill.

The DPS contains both the specifications of the product and the specification of its quality evaluation. The quality evaluation specifications are grouped by “component”. There is 1 to n “components” by DPS. When there is only one component, the component is the product itself.

The DPS components contain both the specified Quality Measures to apply and the conformance values against which the Quality Measures of the TDP will be compared.
The DPS will be edited in the catalogue of products using the “EMODnet Checkpoint template for Data Product Specifications”.

Environmental matrices

This concept is introduced to avoid ambiguities when using a characteristic name such as “temperature”. The environment matrix is the environment to which a characteristic is related and defined as: Air, Fresh water, Marine water, Riverbed, Seabed, Biota/Biology, Human activities.

Fit for purpose

This concept is introduced to avoid ambiguities when using a characteristic name such as “temperature”. The environment matrix is the environment to which a characteristic is related and defined as: Air, Fresh water, Marine water, Riverbed, Seabed, Biota/Biology, Human activities.

Fit for use

Degree of conformance of data sets to the product specifications of the producer.

GIS

A Geographic Information System (GIS), also known as a geospatial information system, is any system for capturing, storing, analyzing and managing data and associated attributes, which are spatially referenced to Earth.

Harmonisation

Changes/restructuration of the reference version of the data set to make it compatible.

Input dataset

This is the collection of existing data to be input to the Challenges. They are uniquely identified as a combination of (variable, dataset, intended use) or of (geographical feature, dataset, intended use) depending on their nature. They can be shared between challenges.

Metadata

Metadata are information about one or more aspects of data, such as time and date of creation, owner of data, standards used, access rights.

Product

The product is defined by DG MARE and has to be described by a Challenge according to the specifications of production (see DPS definition).
A product contains as many “components” as the DPS requires unless conditions of production made it impossible to create one or more of them.

Provider

Identify both Primary Providers (who are the producers) and Secondary Providers (who are the distributors only).

Relevance

Covering the extent to which data are appropriate for objectives of Challenges.

Stakeholders

Stakeholders are individual, group or institutions affected by a project in a positive or negative way, or individual, group or institutions that have an interest (or stake) in the project. They cover a large spectrum from user point of view to provider point of view:
• Policy manager, coordination bodies, member states and funding agencies
• End-users or data consumers from private and public sectors for application development (individual or organized in clusters or community of practices, see challenges representativeness)
• Marine science community
• Citizen (mainly coastal), NGOs and wider participatory sciences
• Data provider, data manager, data hosting & primary dissemination infrastructures
• Regional or thematic assembly portals (Inspire infrastructures).

Territory

Domain of assessment that expresses the subdivision of the assessment criteria into the three categories of “discovery”, “appropriateness” and “availability”.

Unique identification

Each input data is identified uniquely as a combination of (one characteristic, one dataset or one dataset series, one intended use) or of (one geo. feature, one dataset, one intended use).

Universe of Discourse

View of the real or hypothetical world that includes everything of interest (ISO 19101).

Validation

Confirmation by examination and provision of objective evidence that the particular requirements for a specific intended use are fulfilled.

The Assessment framework

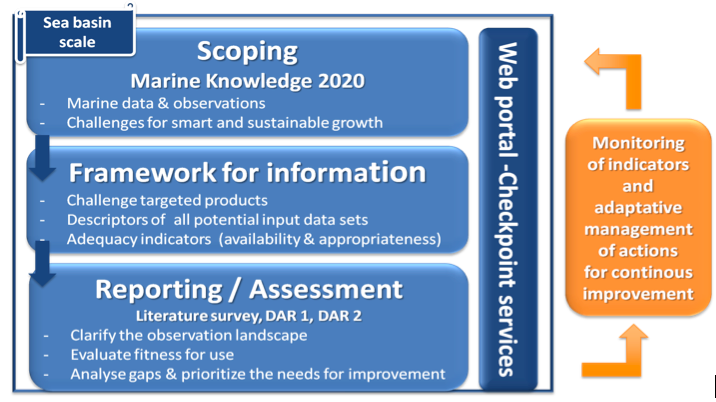
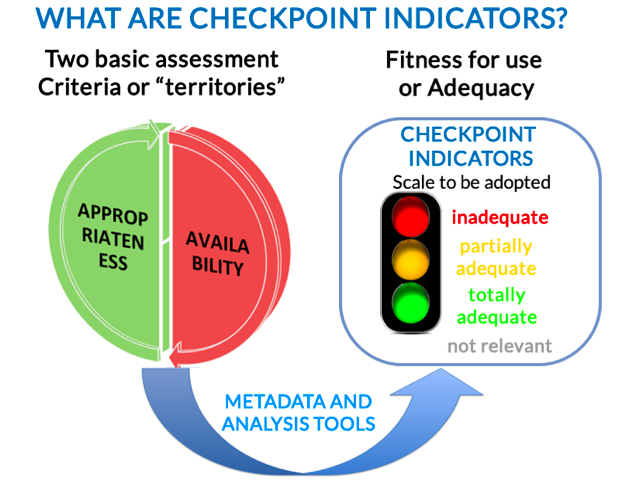
This customer-required approach for a user-view quality assessment led the Mediterranean checkpoint to design and implement an assessment framework which supports the checkpoint concept, a system and service solution to objectify, standardize and attempt to quantify the evaluation results (SMART indicators).

The general synopsis of the checkpoint concept is shown in the figure below: from scoping it goes to an information framework and to reporting quality and gaps using web tools and services.

The implementation is based on :

  • The quality concept of ISO 9000 as the “Degree to which a set of inherent characteristics fulfills requirements” describing how to apply the concept to assess the adequacy of the input data sets and the challenge products making use of them,
  • The INSPIRE Directive for the European Spatial Data Infrastructure, and the ISO standards for Geographical Information (ISO 19115 “Metadata, ISO 19157 “Data Quality” and ISO 19131 “Data Product Specification”),
  • The use of dictionaries of the SeaDataNet European marine data network for parameter identification and classification,
  • The definition of specification of needs for production (so-called DATA PRODUCT SPECIFICATIONS) and the definition of quality indicators (that is upon completeness, logical consistency, thematic accuracy, temporal quality and positional accuracy.) and following the SMART principles (Significant, Measurable, for Actionable information, Reproducible, Time-bound /managed for enhancement)

  • 3 technologies leverage :

- A GIS database for the cataloging the source data and products including links between requirements for making the products, assessment on product realized (so-called TARGETED DATA PRODUCT) and input data used (so-called UPSTREAM DATA);

- A dashboard tool for aggregating and scoring raw metadata and indicators of GIS database and computation of statistics in order to offer a dynamic and synthesised display to allow non-expert public to easily assess the fitness for use without spending a lot of time looking at metadata and checkpoint reports;

- A web service for visualization of GIS map layers;


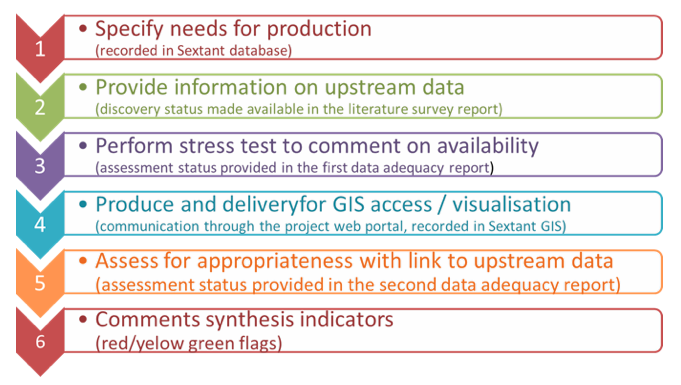
  • A workflow process as shown below:

For the time being the implementing tools have a twofold capacity within the project:

  • As internal tools for the data management team to run analysis and report on the data landscape,
  • As an interface with the outside world, with a focus on data providers but also serving the wider research and industry community.

They were designed to enable users to rapidly check issues about, and progress in data adequacy which can be seen as threefold:

  • Data gaps: where is monitoring lacking?
  • Insufficient assembly: data sets remain scattered
  • Data sourcing issues: access to data is difficult.


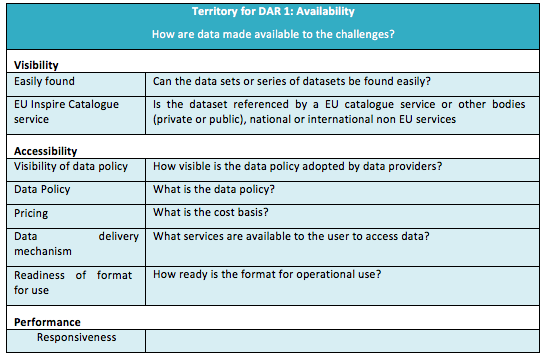
The availability indicators


From checkpoint descriptors to checkpoint indicators
 
Below the details of checkpoint availability indicators:


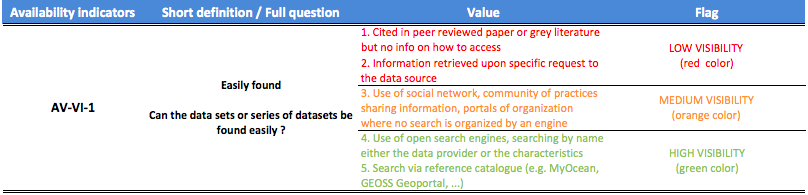
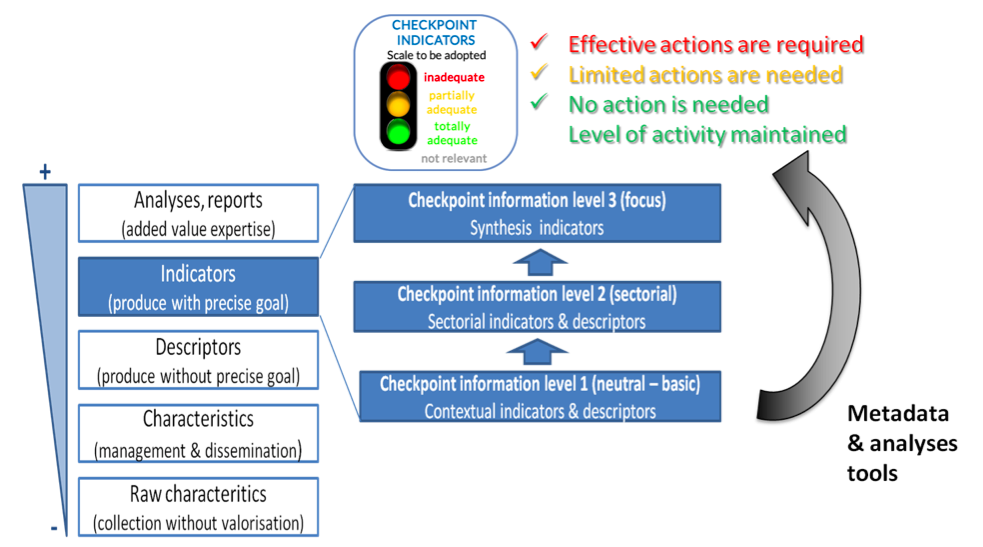
The checkpoint activity produced 3 levels of information, dated at the date of the assessment

  • Level 1 is related to the raw and neutral descriptors of input data and the release of the targeted products of challenges.

(At this level, one can already identify the role and synergies of the input data.)

  • Level 2 are targeted products and sectorial indicators to give feedback on the availability and the appropriateness status per challenge.

(Note here that the availability status is neutral and valid for all challenges.)

  • Level 3 are checkpoint results, composed of the checkpoint e-service to search for and present synthesized and focused indicators and checkpoint expert reports on the fitness for use of the observing infrastructure (literature survey and data adequacy).

(Indicators answer precise questions but cannot be interpreted without the added value comments and expertise published in the reports.)


FAQs

  • What are marine regions or subregion?

A specified area or sub-area of Europe’s seas, as defined within the Marine Strategy Framework Directive. These are specific instances of sea-basins. Recognizable geographical area of marine waters, often confined by land to form a distinct body of water.

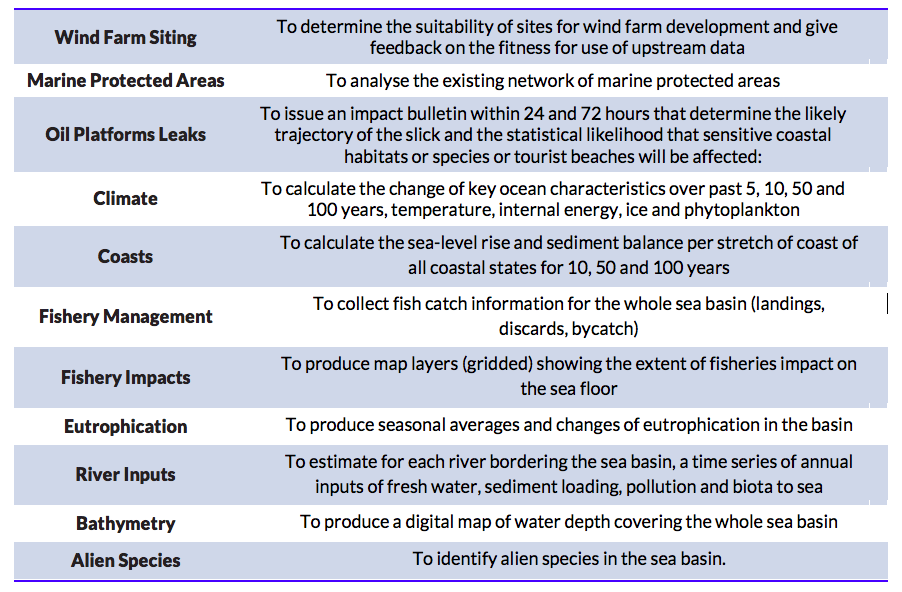
  • What is a challenge?

The challenges are tasks that have been chosen in order to make the bridge with end-user applications and to test how comprehensive and accurate the monitoring and forecasting data sets are at a sea basin scale. They cover the energy and food security sector (renewable energy, fisheries & aquaculture management), marine environmental variability and change (climate change, eutrophication, river inputs, bathymetry, alien species), emergency management (oil spills, fishery impacts, coastal impacts) and preservation of natural resources and biodiversity (connectivity of Protected Marine Areas and red list species), 11 areas altogether:

For more information on challenges see Challenges Section.

  • What are input data sets?

These refer to the collection of existing data used as input to Challenges. Data is collected by an instrument at a particular place and time and which typically are repeated periodically to monitor change over time. It may be raw or processed to make it interoperable with other data.

Many of them are assembled and shared thanks to the European Marine Observation and Data Network (Thematic Assembly Groups), the Copernicus programme, the Data Collection Framework for Fisheries but others are made available in national and international databases.