Introduction
Medsea Checkpoint uses interfaces and tools to deliver the findings of the project in a stepwise approach.
Strategic needs | Readiness |
|---|---|
Synthesis information, to provide support for decision making on observations and monitoring, i.e. to help them to monitor gaps and prioritize needs for future development/improvement of overall observing infrastructure | |
Data Browser or LS Dashboard, and catalogue discovery/downloading service to clarify the observation landscape, to browse in the region the existing monitoring data, according to different criteria, with a gateway to source catalogue/data. | |
Product visualization (GIS) and specification to demonstrate the use opportunity & efficiency through discovery, viewing and downloading of checkpoint targeted products, first demonstrators of new applications, and to allow end-users to seek for input data for their own applications. | |
Assessment results based on seven challenges applications and final Data Adequacy Report |
|
The practical outputs of the project were:
- A literature survey summarizing the monitoring characteristics of the system
- Two Data Adequacy Reports (DARs) to provide an overview of how fit for purpose the monitoring effort is, in view of the challenge of product development
- Two expert panel reports
- A final report indicating how the EMODnet Med-Sea checkpoint portal could operate once the project has finished
Specific products from available primary and assembled datasets for each challenge in synthesis:
Final Assessment
The EMODnet MedSea Checkpoint reached its end and released the 2nd Data Adequacy Report. An ISO inspired objective methodology for monitoring assessment had been developed and finally implemented, which included availability and appropriateness indicators. The assessment results based on seven challenges applications highlighted the main gaps of the monitoring system at the basin scale and suggested some priority actions in order to optimise the monitoring and observational landscape in the Mediterranean Sea region and foster the Blue Economy.
|
|
|

Monitoring Assessment
The assessment of Appropriateness territory was based on four phases:
ISO Quality Elements was selected to describe DPS, TPD and UD, consisting of nine ranks plus one expert evaluation on the usability of the product. These Quality Elements corresponded to nine quality measures for appropriateness specifically defined within the MedSea Checkpoint. Quality Errors was computed for each Targeted Product component from DPS and TPD quality measures and for each UD associated to the Targeted Product as well. “Errors” for Quality Elements were defined as the differences between what was realized and what had been “expected” or “required”. The appropriateness indicators were related to “errors” in the Quality Elements just defined. Appropriateness corresponded then to “low” errors in the specific quality element. In the case of appropriateness, it was less immediate than for availability to provide a simple characterization of the indicators at a high level of aggregation. Some simplifying assumptions were applied, allowing a non-expert to easily assess the appropriateness indicators without looking at the metadata and reports. Appropriateness indicator values can have negative or positive values. The former score was an under-fitting score, representing lower than expected quality while the latter was an over-fitting score. Both scores were saturated at ±100%. In order to associate a range of indicator values to a synthetic indicator score, it was necessary to establish “thresholds” for the values. It was decided that products with ‘errors’ within -10% and +10% with respect to DPS are ‘appropriate’ or at least partly adequate. Values smaller than -10% were under-fitting and not adequate while values larger than +10% were over-fitting or totally adequate, no need for further development.
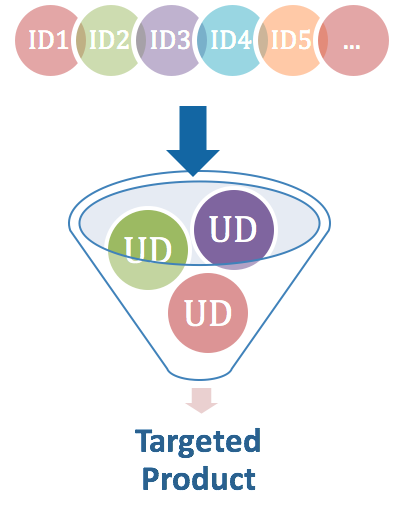
Each Targeted Product was associated with its Upstream Data sets to dynamically perform the data adequacy evaluation |
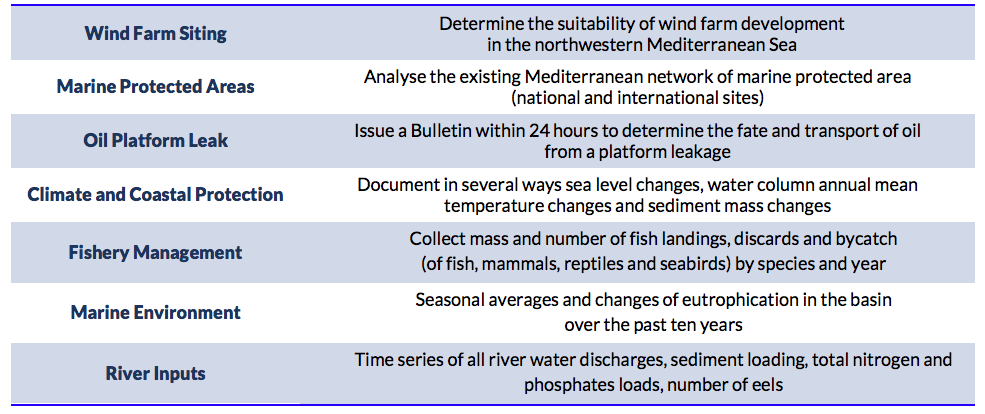
Analysis ResultsThe Checkpoint meta-database contained 266 input dataset descriptors, which identifed and assessed potentially usable information for the construction of the products. 45 Targeted Products were generated following the customer requests:
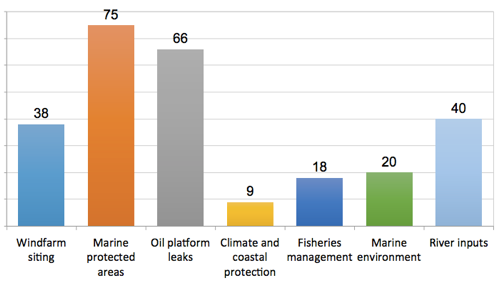
Only 90 over the 266 input dataset were used for the realization of the 45 Targeted Products and they were referred to as Upstream Data. The number of input data sets potentially used by the Challenges to generate their products is described in the figure below where it is evident that Wind Farm Siting, MPAs, Oil Platform Leaks and River Inputs requested more data sets than the others.
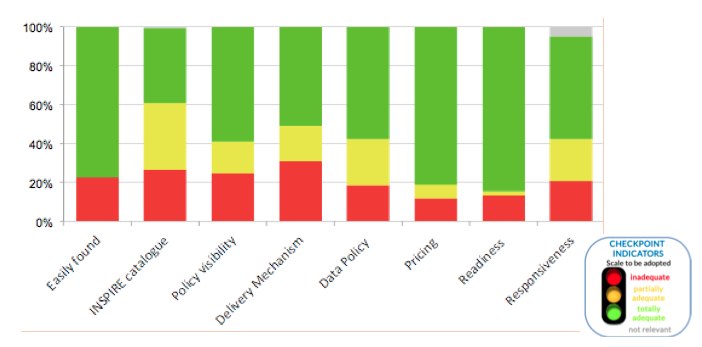
Number of input data sets for each Challenge The availability indicators were used to carry out the first part of the monitoring system assessment. The indicators for the 266 input data sets were analysed by means of a distribution histograms of the scores. The results were summarized below, where the availability indicator scores were summed considering all the input data sets. Above 60% of the input data sets, contributing to the monitoring landscape, were totally and partly inadequate for the INSPIRE Catalogue. Above 40% of the input data sets were partly and totally inadequate for Policy Visibility, Delivery mechanism, Data Policy and Responsiveness. The appropriateness indicators were computed on the Upstream Datasets selected to be used in the Challenge Targeted Products.
Availability indicators scores in percentage over the total number of input data sets (266) present in the meta-database Only 90 of the potential 266 data sets entered the analysis determining not robust statistics. The results appear noisier than ones obtained from availability indicators suggesting that more challenges application should be implemented in order to have more significant statistics on fitness for purpose of the monitoring landscape. Over a total of 29 characteristics used in the generation of Targeted Products, 17 appear not adequate at the scale of the Mediterranean Sea monitoring and the most frequent quality elements that score “not adequate” were: 1) horizontal coverage; 2) temporal coverage; 3) horizontal resolution, and 4) temporal validity. The analysis of Targeted Products quality from appropriateness indicators showed that most of the products had consistent quality with respect to the DPS requirements and that the largest TDP errors were linked to inadequate horizontal coverage, horizontal resolution, and temporal validity. In order to provide an expert evaluation of the quality of each Targeted Product, the experts assigned an overall product quality score with respect to scope (fitness for purpose) and explained why. |
System Gaps
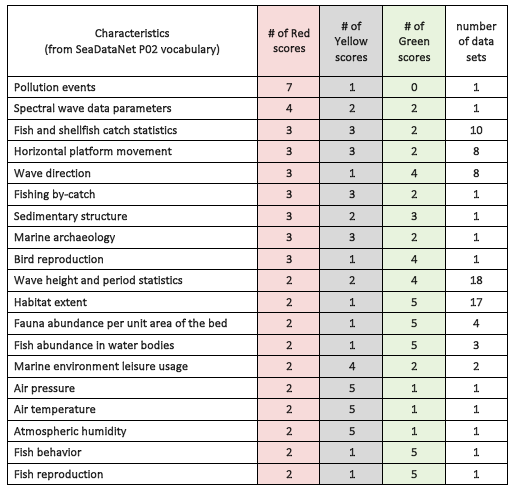
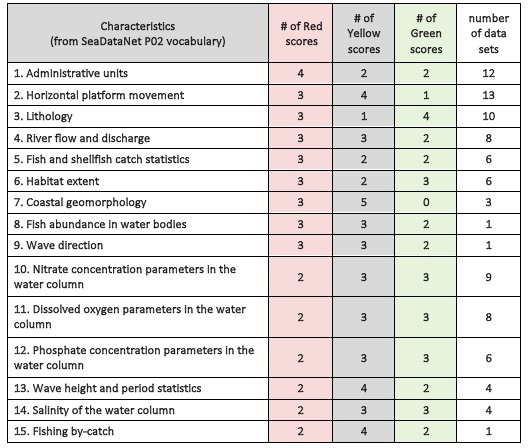
Was the Mediterranean Sea monitoring system adequate? If not, for which characteristics (essential marine variables)? In order to answer this question, the availability and the appropriateness scores had been organized by characteristics across all the challenges and products in the tables below.
Synthesis for availability indicators: characteristic categories that were inadequate in order of inadequacy
Synthesis for appropriateness indicators: characteristic categories that were inadequate in order of inadequacy The conclusion of the Mediterranean Checkpoint assessment derived from the comparison between the inadequate characteristics for availability and appropriateness indicators. Gaps in the Mediterranean Sea monitoring system were identified by the common inadequate characteristics in the two territories. The monitoring system gaps at the basin scale in view of the 7 prescribed Challenges were related to:
|