The Checkpoint Concept
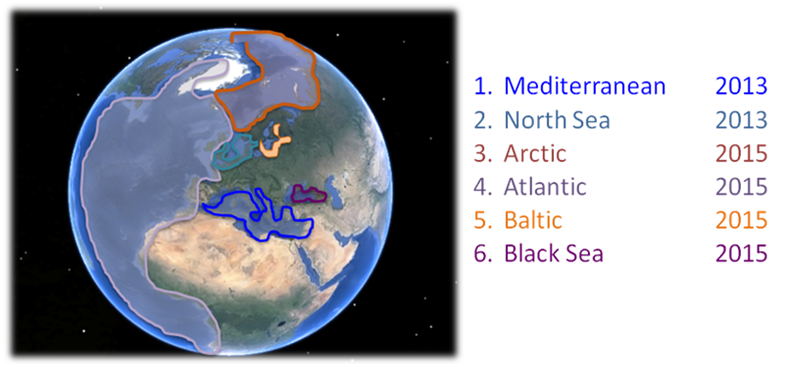
The sea basin checkpoint service could be defined as a wide monitoring system assessment activity aiming to support the sustainable Blue Growth at the scale of the European Sea Basins. Six Sea Basin Checkpoints (Arctic, Atlantic, Baltic, Blacksea, MedSea, North Sea) were implemented with a view to:
- Provide an overview of data sets for all compartments of the marine environment - Air, Ice, Fresh Water, Marine Water, Riverbed/Seabed, Biota/Biology and Human activities
- Assess the adequacy of marine monitoring systems with the needs of users
- Identify how and where existing monitoring systems could be enhanced (in terms of availability, operational reliability, efficiency, time consistency, space consistency, etc.) in order to make data more easily available and usable
- Identify priorities for the collection of new data.
Study area of the 6 Emodnet sea basin checkpoint initiatives
This was carried-out by developing products within 11 thematic challenges, each corresponding to applications of paramount importance for the European Marine Environment Strategy (challenges re in brackets):
- Energetic and food security (renewable energy, fisheries & aquaculture management);
- Marine environment variability and change (climate change, eutrophication, river inputs, bathymetry, alien species);
- Emergency management (oil spills, fishery impacts, coastal impacts);
- Preservation of natural resources and biodiversity (connectivity of Marine Protected Areas).
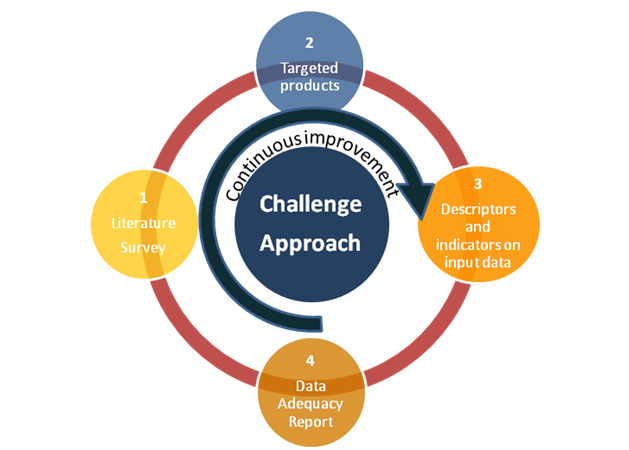
The qualitative assessment was considered in 4 main tasks:
Task 1 A literature survey, the aim of which is to identify from literature and past use cases the gaps in existing data.
Task 2 The development of products by the challenges, including for each product initial specifications (expected accuracy, data requirements in order to reach that accuracy), and the final assessment of the adequacy of existing data with the specifications
Task 3 The assessment of the availability/adequacy of upstream data reported in two documents, named Data Adequacy Reports (DAR) :
- A first assessment achieved at the end of first year (DAR 1) that focused on releasing/revising the data availability status
- A second assessment done in year two (DAR 2) that dealt with the data adequacy (or appropriateness)
Task 4 An external expert panel to review the checkpoint work and provide advice for enhanced and strengthened benefit.
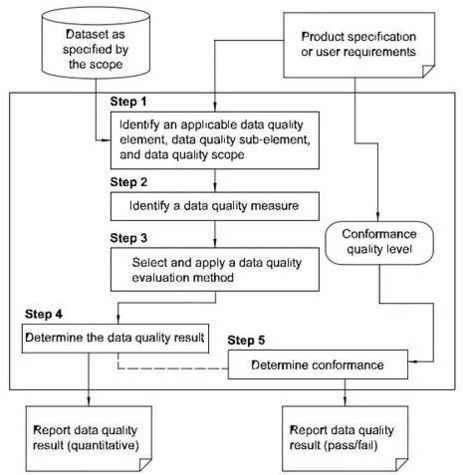
A step by step process for quality assessment
In the case of the Atlantic checkpoint, the region is defined by the Atlantic Ocean, North of the equator up to the Arctic Ocean and excluding the North Sea but the pragmatic geographic approach is the EU economic zones because the two DG/MARE key initiatives do not extend beyond these boundaries. However, when "EU coasts" are specified for the Atlantic (this is the case for MPAs and Coasts challenges and by nature for climate change), it refers to the coasts of UK, metropolitan France, continental Spain, continental Portugal and Ireland that adjoin the Atlantic as well as those of the Azores, Madeira, the Canary Islands, French Guiana, Guadeloupe, Martinique and Saint Martin.
Targeted audience
As a way to better understand their remit, "sea basin checkpoints" could be regarded as overarching observing systems. What they observed was the whole realm of marine data distributed among a great number of organizations, people and places and in a variety of systems addressing many different purposes. This massive amount of data was something that featured a lot of natural variability in terms of data appropriateness and conditions of availability for users’ applications. Data was partially and not homogeneously described either through its metadata or via the web pages and documentation within their repositories, which made a first filter on data actual content and quality and introduced uncertainty as to what the data sets really represented.
The checkpoint integrated service was driven by two types of access/usage, public one and restricted for project use (challenges partners, experts and contributors). The public service served primarily institutional policy-makers on one side to data producers and data providers on the other side to improve the adequacy of existing monitoring systems for the scope of the EU maritime strategy:
- For institutional policy makers, the checkpoint service should have provided support for the steering committee and decision making on observations monitoring and data management / dissemination infrastructure. This had been carried out by developing checkpoint e-services which ingested metadata and delivering indicators and statistics for focusing on priorities, by challenge, by category of characteristics, by level of data after transformation process, and any type of relevant criterion (e.g. geographical area, elevation range, period of time, resolution), highlighting gaps of the monitoring in addition to fact sheets and expert reports with proposed solutions.
- For the other categories it would have helped them to grasp how their data collected could fit other uses than their initial purpose, or to demonstrate the potential of innovative applications, thanks to the availability at that time* of upstream data sets. To this end, the checkpoint challenges were going to analyse the fitness-for-use of the upstream data according to the requirements they specify to produce the thematic products mandated by the EMODnet tender. The regional checkpoint had thus developed a checkpoint e-service with indicators yielding feedback on the availability and appropriateness of the upstream data described in the checkpoint catalogue, i.e., all that had been needed to evaluate fitness for use.
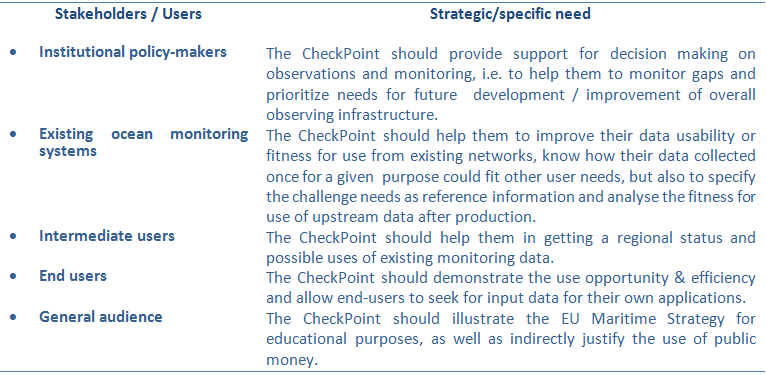
The checkpoint audience
Assessment Framework
Checkpoint outcomes were tightly linked to the definition of challenges and their terms of references but also on the configuration of partners to meet the attended results. The qualitative assessment was considered within the scope of 4 core tasks:
Task 1 The Literature Survey (LS) attempted to enlarge the project partners awareness of observing data land-scape within the basin through published case studies.
Task 2 The development of products & confidence limits within thematic challenges, made spatial and non-spatial alike, available - - in a GIS system for dynamic mapping, along with clear product specification and requirements for upstream data, and feedback on their adequacy (compliant and compatible with INSPIRE, EMODnet and OGS standards).
Task 3 The web-site portal was required to provide a free and unconditional access to outputs from challenges compatible with INSPIRE, EMODnet and OGS, and to EMODnet portals plus link to the EU's maritime forum which now contains all reports and allows for comments and feedback. The operations of checkpoint web tools and services releases description of data and products and assessment available for all, in a standard and reproducible form.
Task 4 The assessment of upstream data was achieved in two phases:
- A first assessment achieved the first year (DAR 1) focused on releasing/revising the data availability status
- A second assessment of upstream data done in a second phase / second year (DAR 2) for evaluating the data adequacy (fitness for use, appropriateness)
Implementation
The major effort of the first Medsea checkpoint project (3 years duration) had been its investment to define and implement the assessment method based on ISO quality standards for quality of data and quality of services, INSPIRE standards for enhanced data sharing and EEA core set of indicators for sustainable environment (that is the translation of the information and reports in descriptive and quantitative metadata usable for the production of the indicators).
The most technical part of the web activities was to support the checkpoint assessment and visibility as follows:
- to develop and setup the service and system architecture,
- to provide expertise and technical support for evaluation
- to maintain, operate and controlthe service and system architecture (technical infrastructure and working environment for Inspire GIS services and dynamic mapping).
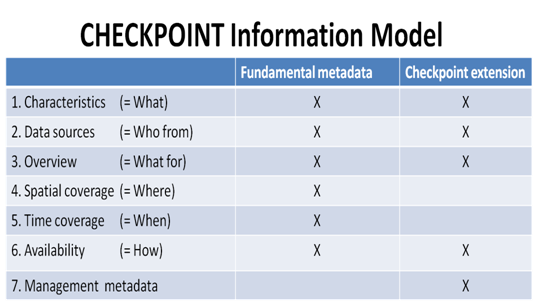
A framework for metadata collation had been designed first and metadata was edited in an INSPIRE-compliant catalogue. The LS task should have resulted concretely in the collation of data sets needed for the production activity of challenges, along with their metadata (sources, primary data producers as well as intermediaries, and more checkpoint descriptors to allow further evaluation). The classical fundamental discovery metadata model used had been extended to meet the assessment requirements.
The checkpoint information model
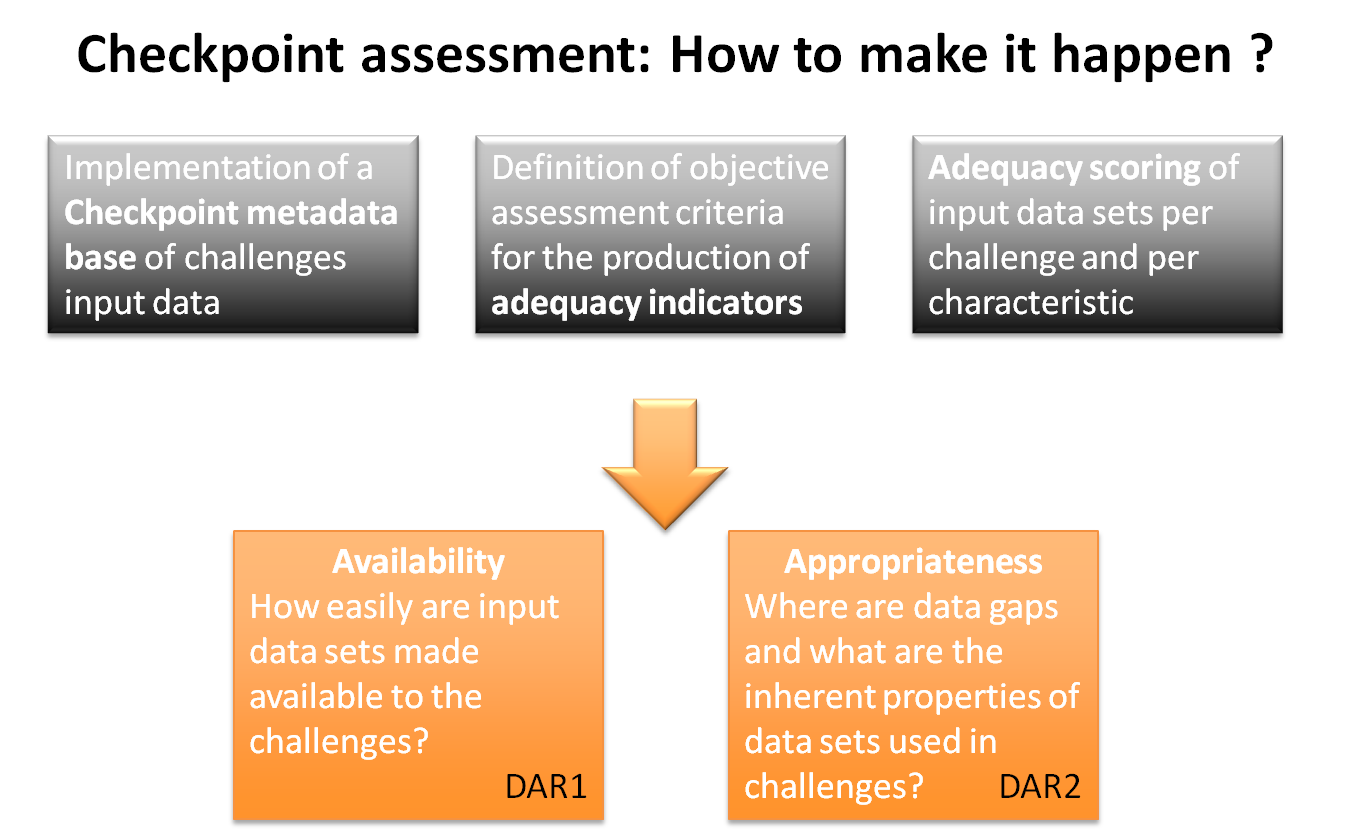
Then, assessment criteria had been defined for the production of adequacy indicators. The indicators were conceived following the SMART scoring method:
- Specific (or significant): target a specific area for improvement;
- Measurable: quantitative for progress monitoring (and thus reproducible);
- Assignable (or actionable): agreed upon;
- Realistic i.e. achievable given the available resources;
- Time-bound
Challenges are required to assess two quality descriptors
Adequacy indicators were selected for both availability and appropriateness and stored in the catalogue. The assessment criteria per territory were defined as follows:
|
Availibility |
||
|
Visibility |
Ease to find |
Can the data sets or series of data sets be found easily ? |
|
EU catalogue service |
Is the data set referenced by an EU catalogue service or another national or international (non EU) service? |
|
|
Accessibility
|
Visibility of data policy |
How visible is the data policy adopted by the data providers? |
|
Data policy |
What is the data policy? |
|
|
Pricing |
What is the cost basis? |
|
|
Data delivery |
What services are available to the users to access data? |
|
|
Readiness of format for use |
How ready is the format for operational use? |
|
|
Performance |
Responsivness |
How long does it takes from data request to data delivery ? |
|
Appropriateness |
||
|
Completeness |
Horizontal coverage |
Surface area covered |
|
Vertical coverage |
Vertical depth covered |
|
|
Temporal coverage |
Time span covered |
|
|
Number of items |
Count of occurrences of the object (e.g. country, species etc.) |
|
|
Consistency |
Number of characteristics |
Count of input characteristics |
|
Accuracy |
Horizontal resolution |
Mean horizontal interval |
|
Vertical resolution |
Mean vertical interval |
|
|
Temporal resolution |
Temporal sampling interval |
|
|
Thematic accuracy |
Percentage |
|
|
Temporal quality |
Temporal validity |
Data freshness (time since last update) |
The metadata catalogue is then harvested by software tools yielding statistics for these two fields of data quality. A scoring method has also be defined to offer a visual representation allowing a non expert to easily assess the level of fitness for use without spending a lot of time looking at metadata and reports.
An end to end method for visual assessment
Vocabulary used
Assessment criteria
Characteristic
- either to a variable derived from the observation, the measurement or the numerical model output of a phenomenon or of an object property in the environment,
- or to the geographical representation of an object on a map (ie a layer such as a protected area, a coastline or wrecks) by a set of vectors (polygon, curve, point) or a raster (a spatial data model that defines space as an array of equally sized cells such as a grid or an image).
Data, Dataset, Collection of data sets, dataset series
Note: Raw checkpoint descriptors refers to a dataset series or a dataset.
Environmental matrix
- Air
- Ice
- Marine Waters
- Fresh Waters
- Riverbed / Seabed
- Biota/Biology
- Human activities
Fitness for use, Fitness for purpose
GIS
Metadata
Stakeholders
- Policy manager, coordination bodies, member states and funding agencies
- End-users or data consumers from private and public sectors for application development (individual or organised in clusters or community of practices, see challenges representativeness)
- Marine science community
- Sustainable use of ecosystem
- Citizen (mainly coastal), NGOs and wider participatory sciences
- Data provider, data manager, data hosting & primary dissemination infrastructures
- Regional or thematic assembly portals (Inspire infrastructures).
Definition
EC in its 2014 final report on the first phase of implementation of the Marine Strategy Framework Directive (2008/56/EC), had defined adequacy as an assessment of the reported information to meet the objectives of the Marine Strategy Framework Directive (MSFD) and its technical requirements. The Checkpoint adequacy is close to this definition but focused on several Challenges.
Data adequacy was defined at the time as the fitness for use of the data for a particular user or for a variety of users. Since different applications require different properties associated with the data itself, ‘adequacy’ should be defined objectively using standardized nomenclature and methods.
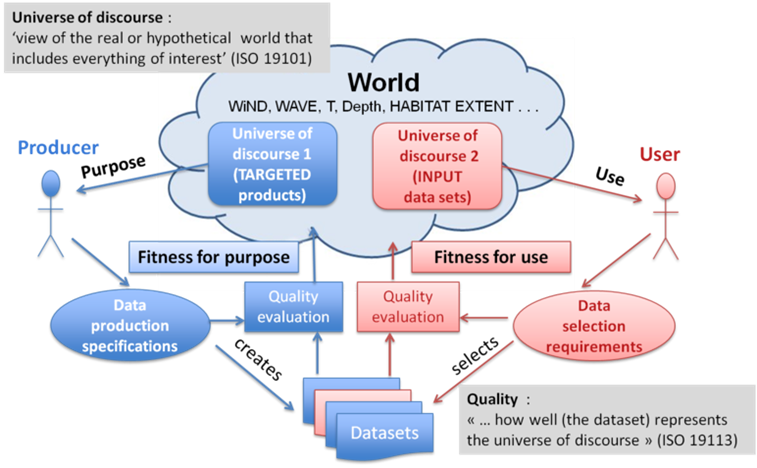
The concept behind the quality of a dataset from a producer and a user point of view
Fitness for use is different from fitness for purpose: the purpose describes the rationale for creating a dataset while the intended use describes the rationale for selecting a dataset. The producer translates the purpose in production specifications while the user translates his use requirements in selection specifications that may differ from the production specifications. The fitness for purpose is evaluated by the producer according to the specifications of the quality expected for his purpose. The fitness for use of a dataset is evaluated by the user according to the specifications of the quality expected for his use. The purpose of the Checkpoint is to provide an evaluation of the fitness for use of the data sets used by the Challenges.
Data product specification (ISO 19131)

