 The pan-Arctic watershed contains many rivers with several of Earth’s largest rivers. These rivers exert a disproportionate influence on the Arctic ocean as they transport more than 10% of global river discharge into the Arctic Ocean, which contains only ~1% of global ocean volume. In order to understand the dynamics of the Arctic ocean it is crucial to be able to quantify the discharge and nutrient fluxes originating from the rivers from this pan-Arctic watershed into the Arctic ocean. There are six Arctic rivers in this pan-Arctic watershed that have basin area’s exceeding 500 000km2 (the Ob’, Yenisey, Lena, Mackenzie, Yukon and Kolyma). Combined these “Big 6” cover 67% of the pan-Arctic watershed and 63% of the total discharge into the Arctic ocean. The next eight largest rivers and their watersheds together only cover an additional 11% of this area and 16% of the discharge, with 22% of the area and 21% of the discharge left for the remaining ‘smaller rivers’ of the Arctic.
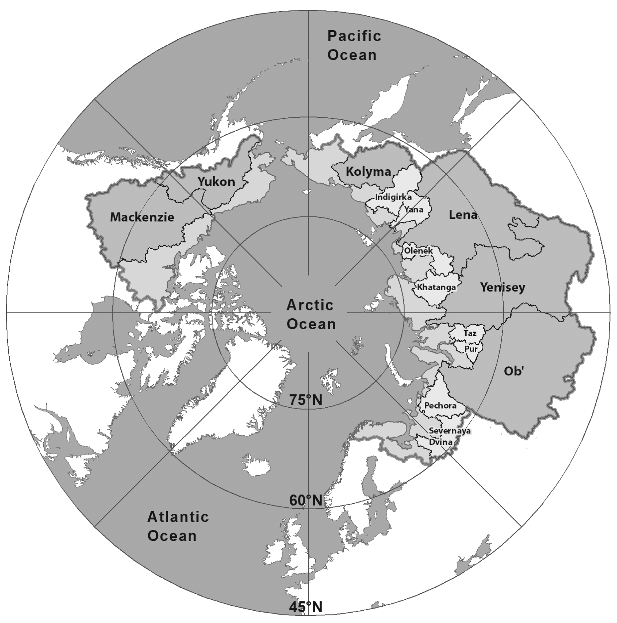
Figure 1: Map of the pan-Arctic watershed, showing its major rivers with the six largest in dark grey and the next eight largest in light grey. The dark grey line indicates the boundary of the pan-Arctic watershed (Holmes et al., 2013)
Objectives
The objective for the River Challenge of the Sea Basin Checkpoint Arctic project was to provide time series of the annual input into the Arctic Ocean of:
Water volume - Time series of annual water discharge
Read more
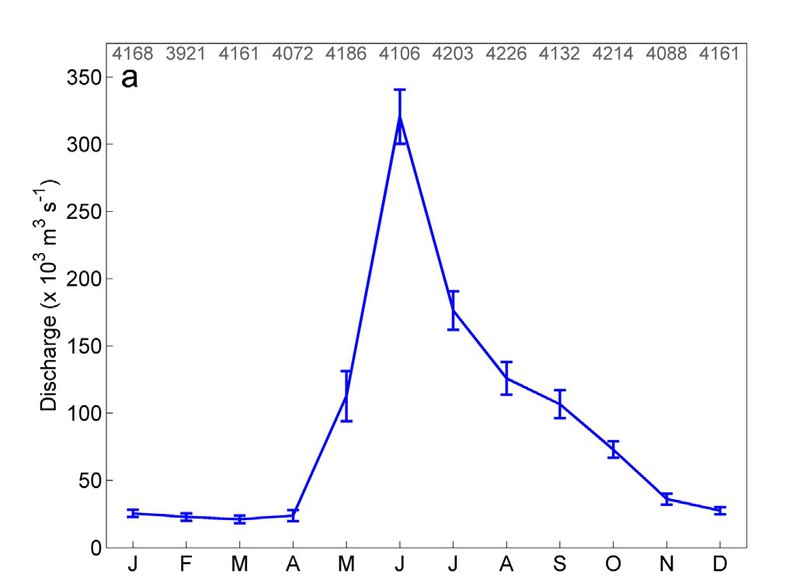
The rivers that discharge to the Arctic Ocean freeze during the winter months and during that time the discharge of the large rivers is low. Some small rivers freeze completely. In April the ice generally starts to melt and in May or June the peak discharge associated with the melting of the snow and ice in the catchments occurs. This spring discharge peak is called ‘freshet’. After this peak the discharge gradually decreases. This discharge regime has important implications for the discharge of sediment and nutrients. The bulk of these discharges occur in approximately 5 months. The typical shape of the hydrograph is illustrated by the average yearly discharge hydrograph for the 6 largest Arctic Rivers plus the Kuskokwim in the figure below (Whitefield et al. 2015).
Time series of yearly total discharge into the Arctic Ocean
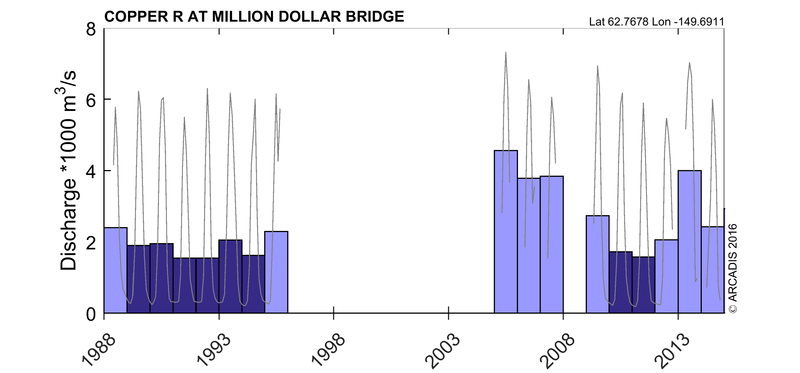
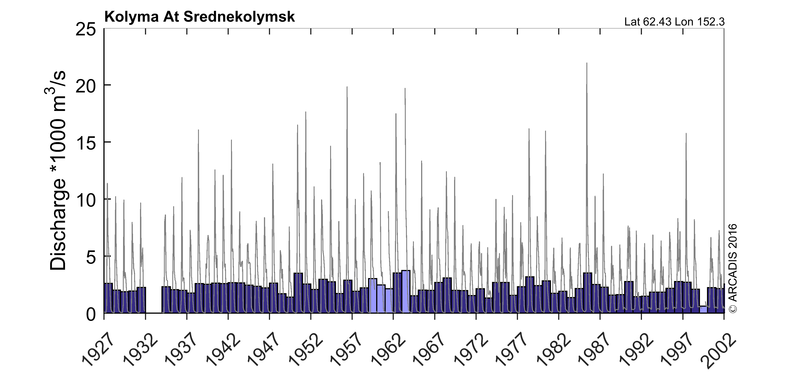
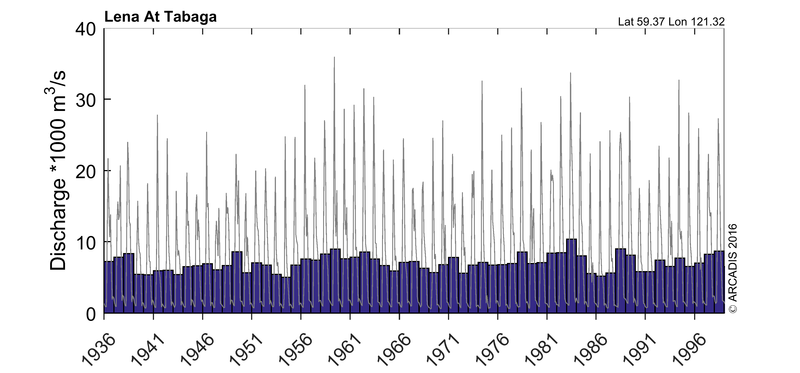
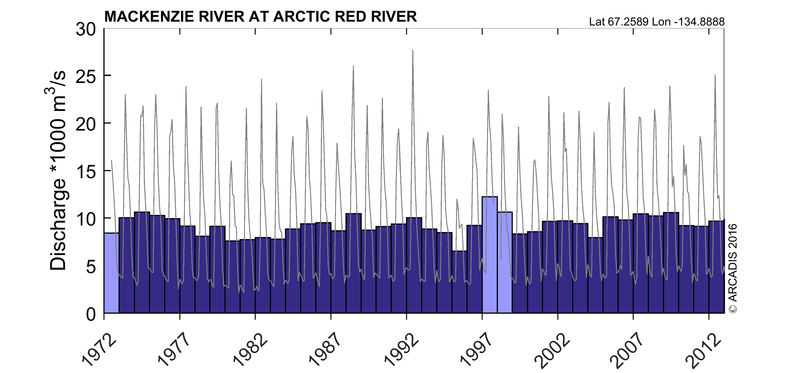
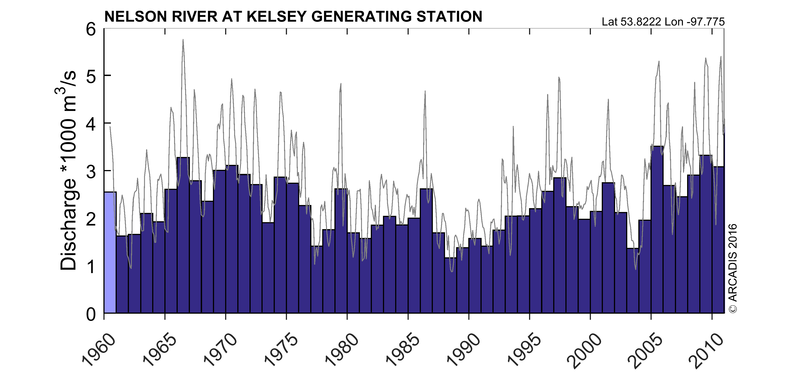
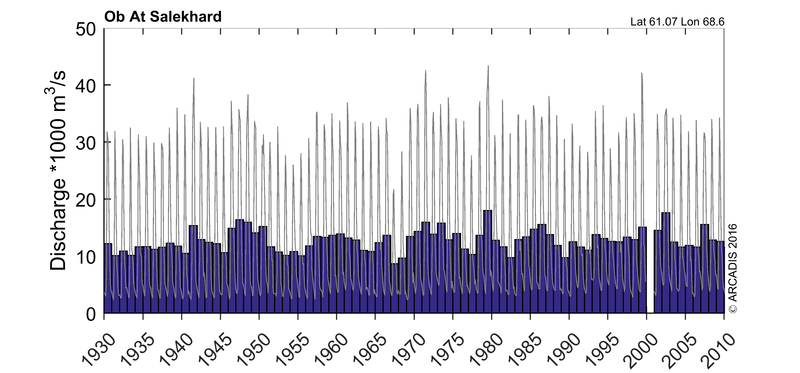
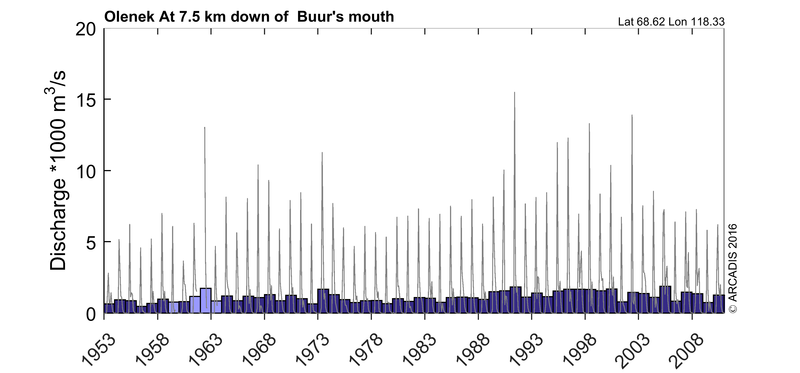
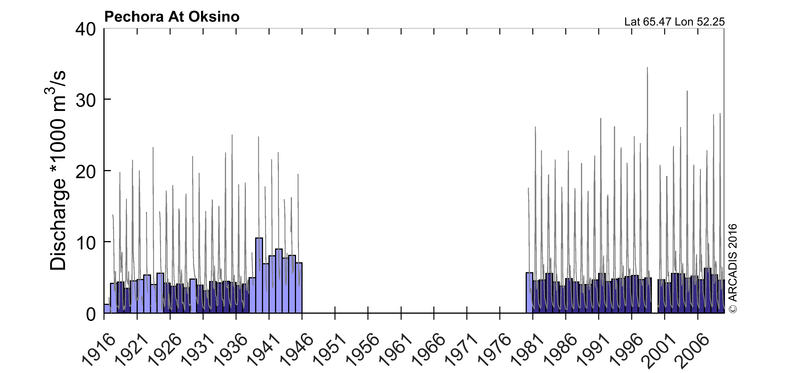
The challenge set by DG-mare was to provide a time series of the annual mass of water discharged to the Arctic ocean. This time series were created by integrating the monthly averaged discharge over a year. The stations marked as ‘downstream station’ for all rivers in the ArcticHycos data set were processed. The usual unit to report river discharge is a volume per unit time, this has been reported instead of the annual mass of water. The time series are presented as an average discharge in m3/s and km3/y.
The ArcticHycos data set is the most complete data set in terms of spatial and temporal coverage and other data sets only contain copies of a subset of this data. Therefore no additional data from other data sets. The data sets for the large Russian rivers typically start in the early 20th century or even late 19th century. This makes these rivers interesting for long-term trend detection in climate studies. However, the recent years discharges are missing, observations stop approximately after 2010. This data will probably be delivered by the SHI in the future (Looser BfG, pers. comm. 2016). The record typically starts in the 60’s and 70’s for the North American rivers and recent observations are available.
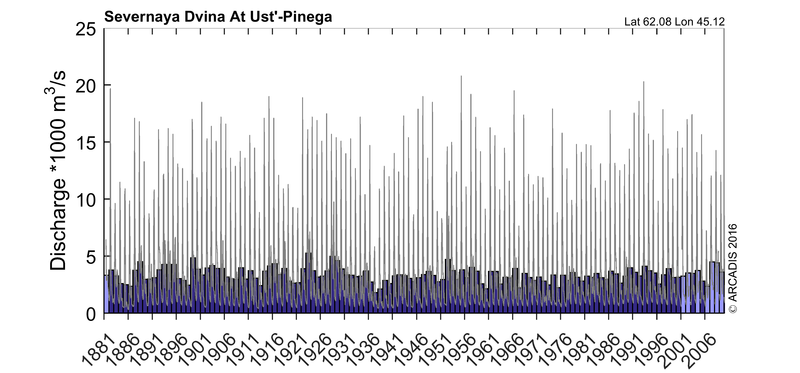
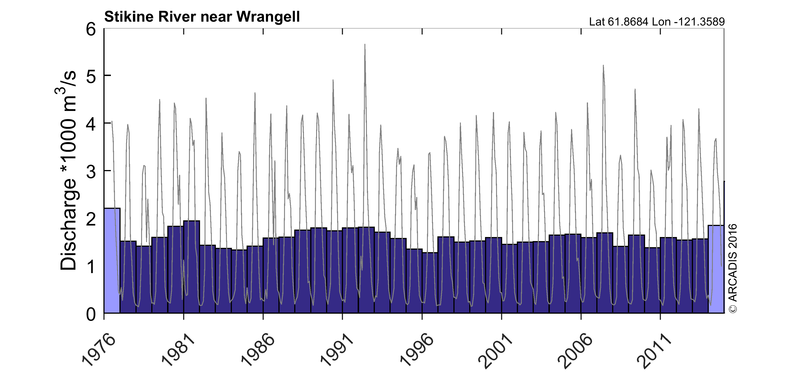
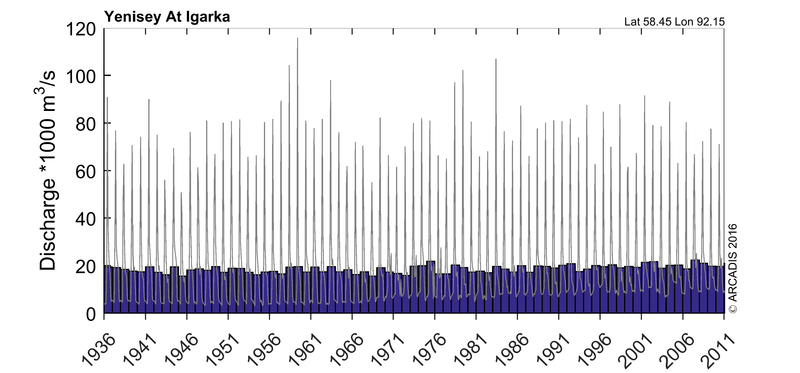
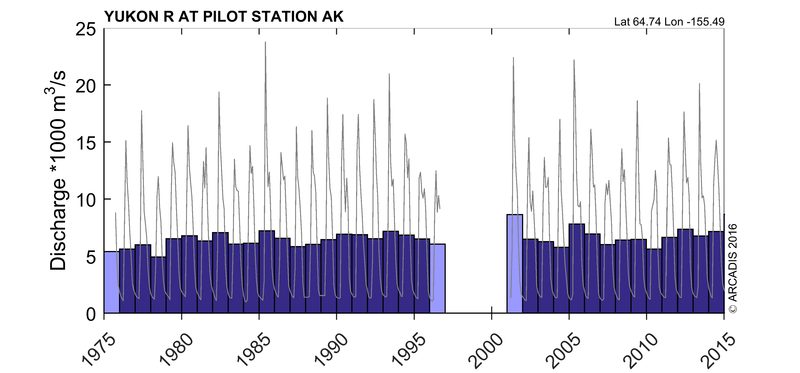
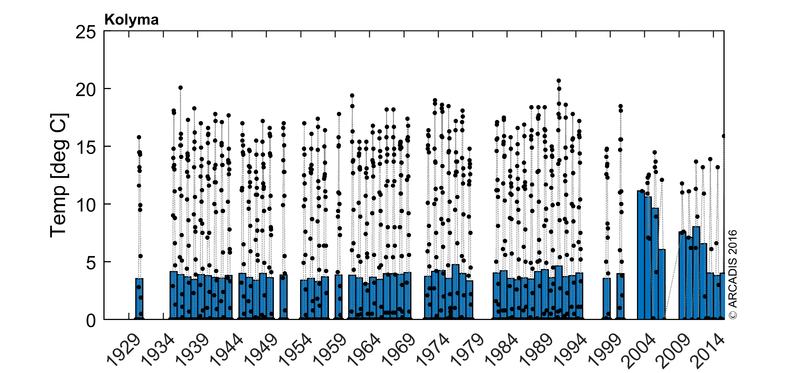
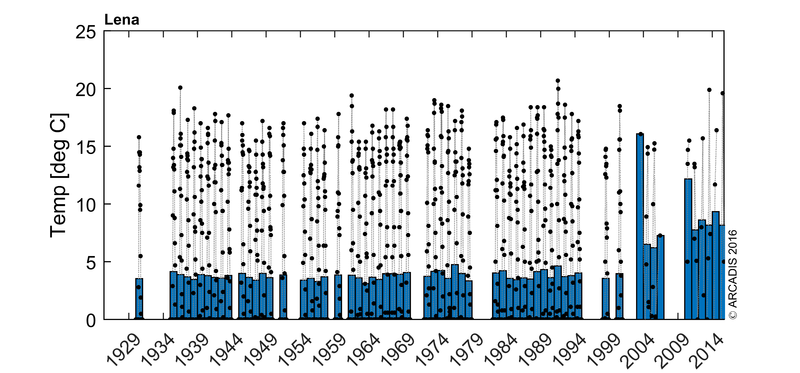
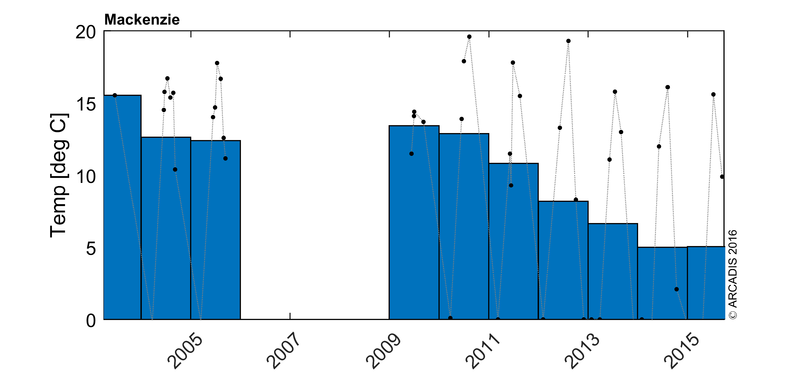
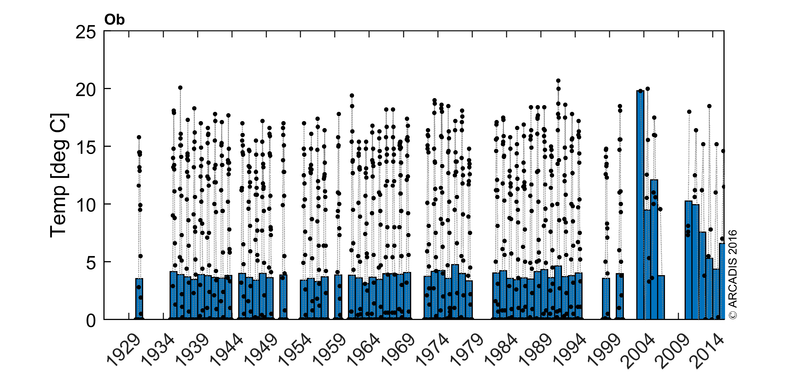
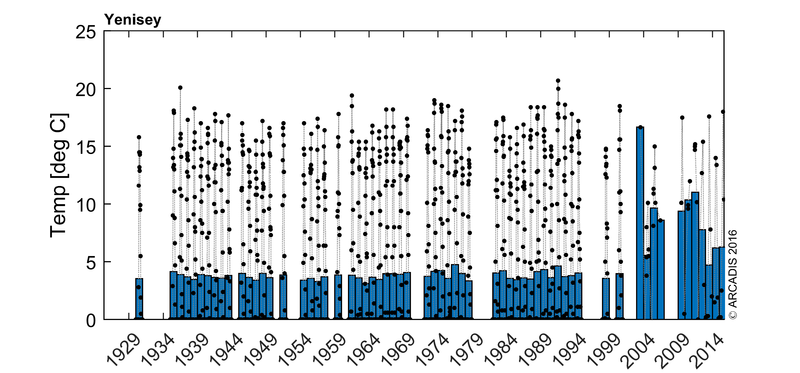
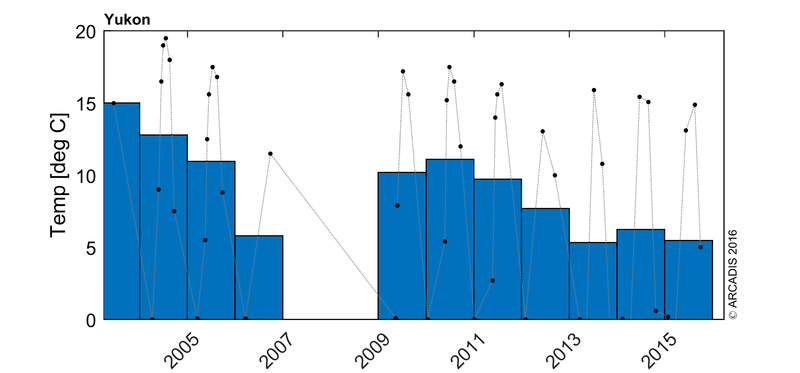
The time series of the monthly data contain data gaps. Averaging over an incomplete year will result in a deviation of the average temperature from the true average temperature. These defects were not repaired in this project. For the most significant rivers the time series are also presented below. The years with incomplete time series have been indicated with a lighter blue color in the graphs below. The grey lines show the monthly time series.
 Variability and change in discharge
The time series show a considerable variability in discharge from year to year. An obvious question in the context of climate change is whether trends can be observed in the discharge. These trends are obscured by the variability therefore a statistical analysis of the data is required. Déry et al. (2016) conducted such an analysis for rivers in Northern Canada. They find that for many rivers no significant trends can be detected, and when a trend is detected it sometimes is anthropogenic (e.g. a river diversion). They do find a significant increase for the total discharge from the Canadian rivers, an 18% increase between 1989 and 2013. This is in line with the work of Zhang et al. (2012) who analysed the discharge from the 3 largest Eurasian Rivers (Ob, Yenisei and Lena) see figure below. These papers show that trends can be detected using the current data sets.
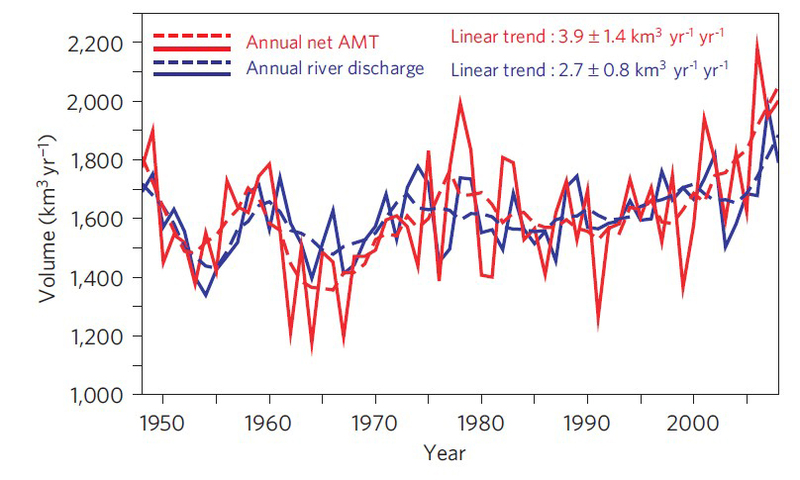
Figure 2: Year-by-year annual net AMT and river discharg. Annual net AMT converged into the Ob, Yenisei and Lena river basins (red solid line) and annual discharge from these three rivers (blue solid line) from 1948 to 2008. The five-year running means were applied to detect QDV of net AMT (red dashed line) and discharge (blue dashed line). The linear trends are derived from the linear regression.
Hudson Bay
The Hudson bay receives considerable freshwater input from rivers. Time series for these discharges are available from the Wateroffice Canada. These discharges are not considered to be freshwater input for the Arctic Ocean. Whitefield at al. (2015) argue as follows: While discharge data are available for many Canadian rivers in the Hudson Bay region, these data were not used to develop ARDAT because rivers in this region fall outside of the pan-Arctic watershed boundary that was selected for data set development. Inclusion of these rivers would add about 10% more water to the total budget (Déry et al., 2005), but mean ocean circulation in the Hudson Bay region tends to advect river inputs east and southward, away from the Arctic Basin (Prinsenberg, 1986).
- Déry, Stephen & A. Stadnyk, Tricia & K. MacDonald, Matthew & Gauli-Sharma, Bunu. (2016). Recent trends and variability in river discharge across northern Canada. Hydrology and Earth System Sciences. 20. 4801-4818. Doi:10.5194/hess-20-4801-2016.
- Prinsenberg, S.J. 1986. Salinity and temperature distributions of Hudson Bay and James Bay. In: Canadian inland seas, I.P Martini, ed. Elsevier Publishers Ltd., Amsterdam.
- Whitefield, J., Winsor P., McClelland J., Menemenlis D., A new river discharge and river temperature climatology data set for the pan-Arctic region, Ocean Modelling, Volume 88, 2015, Pages 1-15, ISSN 1463-5003, http://dx.doi.org/10.1016/j.ocemod.2014.12.012.
- Zhang, X. He, J. Zhang, J. and Wu, P. (2013) Enhanced poleward moisture transport and amplified northern high-latitude wetting trend Nature Climate Change 3(1):47-51 January 2013 DOI: 10.1038/nclimate16
Water temperature - Time series of annual water temperature
Read more
Two sets of temperature data have been used to compile temperature time series. The Arctic-GRO database contains temperature, but is only relatively recent and focuses on the six largest rivers. Furthermore Lammers et al. (2007) have compiled a temperature data set for 17 Russian drainage basins (ARDAT). This data covers a period from 1929 to 2003.
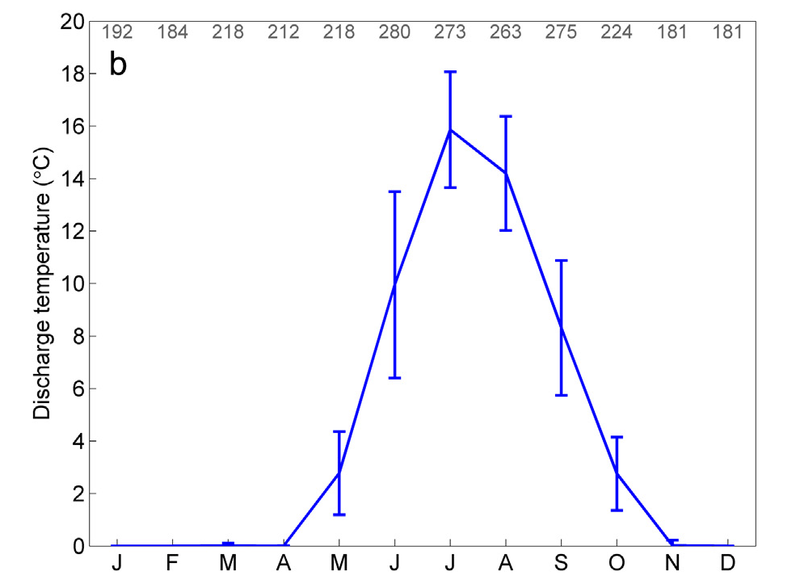
Measurements of temperatures are more scarce over the winter. However, the temperature of the discharge drops to zero degrees (C) from November until April. Therefore this temperature can be assumed over winter (e.g. Whitefield et al., 2015). The average climatology for the Rivers in ARDAT is shown in the figure (Figure 1) below from Whitefield et al. (2015).
References
- Lammers, R.B., J.W. Pundsack, and A.I. Shiklomanov (2007), Variability in river temperature, discharge, and energy flux from the Russian pan-Arctic landmass, J. Geophys. Res. - Biogeosciences, 112, G04S59, doi:10.1029/2006JG000370.
- Whitefield, J., Winsor P., McClelland J., Menemenlis D., A new river discharge and river temperature climatology data set for the pan-Arctic region, Ocean Modelling, Volume 88, 2015, Pages 1-15, ISSN 1463-5003, http://dx.doi.org/10.1016/j.ocemod.2014.12.01
Read more
The challenge set by DG-mare for this project was to create a time series of the total sediment output of rivers into the Arctic Ocean. In order to fulfill this goal an inventory of existing data sets was made. New scientific work to create an assessment of this parameter was not part of the project of challenge. Therefore we did not calculate sediment transport assessment from .e.g. river discharges.
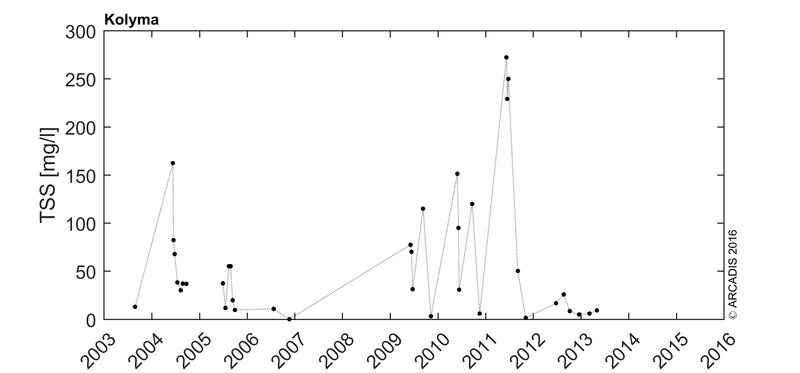
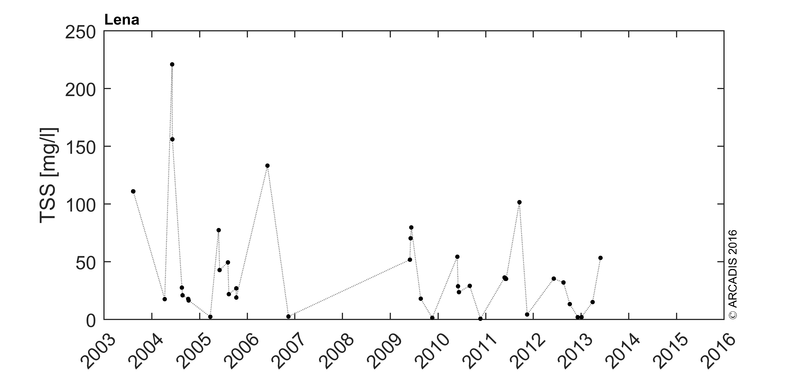
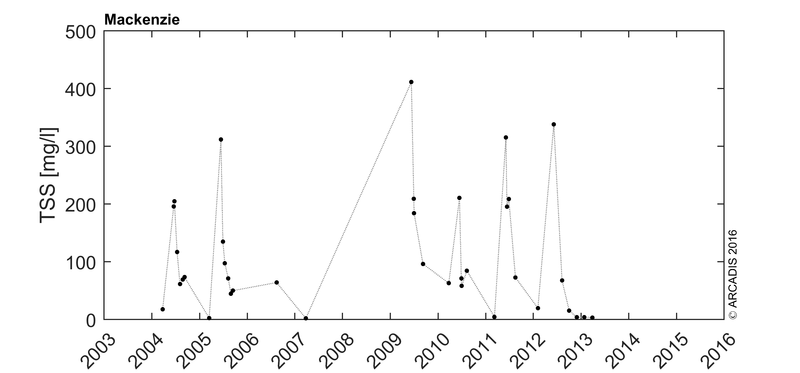
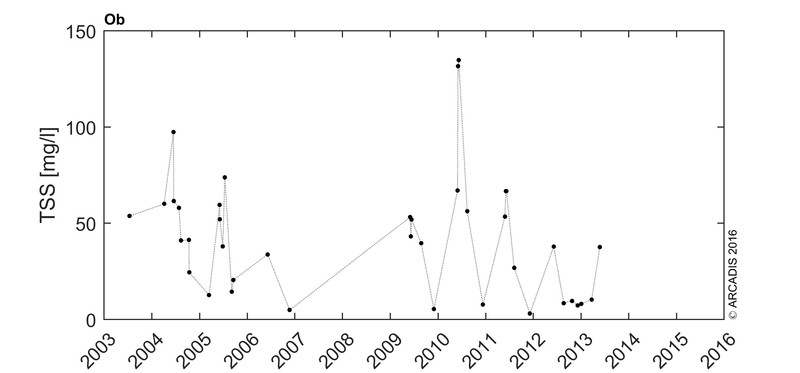
Databases of (total) sediment discharge measurements for the Pan-Arctic region have not been identified. Only suspended sediment concentration (SSC) measurements were found for individual rivers. These SSC measurements are however usually intermittent and only available for some rivers. Furthermore, only knowing the SSC is insufficient to estimate the total sediment discharge since the bed load sediment discharge to the Arctic Ocean remains unobserved. The suspended load is often the largest part of the total sediment load. Turowski et al. 2010 report on the ratio of suspended to bed load and find that extrapolation of the total load based on the suspended load is inaccurate.
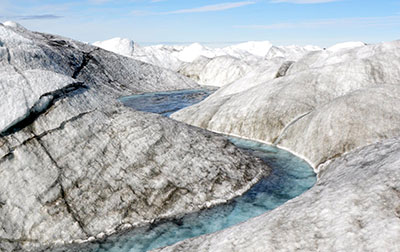
These SSC measurements can provide a basis to estimate the total suspended sediment discharge to the Arctic Ocean. However, considerable extrapolation of data is needed to provide this estimate. The sediment discharge is delivered by a few large rivers, and many small rivers. Many of these small rivers flow from glaciated terrain into the ocean and most are unmonitored. A problem in the estimation of the total sediment discharge is that the many small streams may carry significant sediment loads, while at the same time their load is highly irregular and the rating curve is very specific for particular streams. Observation of the sediment discharge from the many small streams therefore requires an enormous monitoring effort. A notable example of a well monitored small stream is the Zackenberg River in Northeast Greenland (Ladegaard-Pedersen et al., 2016) here short, but a very detailed time series of SSC has been measured.
The few large arctic rivers exhibit relatively slow changes in the sediment concentration, therefore the monitoring is more feasible, but still very expensive in practice. This explains the scarce measurements on the SSC. The SSC data sets that have been identified are the SSC data sets in HYDAT, the USGS database for the Yukon starting in 1976 and the Arctic-GRO data set for the 6 largest Arctic Rivers, starting in 2003.
As mentioned before a measured data sets that allows the determination of the timeseries of the yearly total sediment discharge into the Arctic Ocean was not found. The best assessment of the average yearly sediment output of rivers into the Arctic Ocean probably comes from Overeem and Syvitsky (2008) who use discharge information to model the sediment output. Furthermore, the FAO-Aquastat database contains average sediment yields for catchments worldwide, among which many Arctic Catchments. It doesn’t contain time series however and it is not updated.
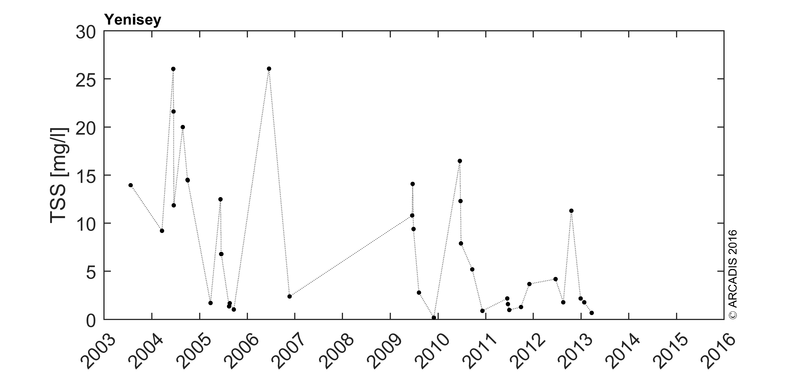
Instead of presenting time series of the total sediment discharge, time series of the suspended sediment concentration are shown.

References
- Ladegaard-Pedersen P., Sigsgaard C., Kroon A., Abermann J., Skov K., Elberling B., Suspended sediment in a high-Arctic river: An appraisal of flux estimation methods, Sci Total Environ (2016), http://dx.doi.org/10.1016/j.scitotenv.2016.12.006
- Overeem, I., & Syvitski, J. P. M. (2008). Changing sediment supply in Arctic rivers. In Proceedings of a symposium held in Christchurch, New Zealand, December 2008, IAHS-AISH Publication. pp. 391–397.
Turowski, J. M., Rickenmann, D., & Dadson, S. J. (2010). The partitioning of the total sediment load of a river into suspended load and bedload: A review of empirical data. Sedimentology, 57(4), 1126–1146. http://doi.org/10.1111/j.1365-3091.2009.01140.x
Total nitrogen and Phosphates - Discharge of Total Nitrogen and Phosphates
Read more
Salmon in the Arctic is not common, on the Pacific side Chum, Pink, Sockeye, Coho and Chinook salmon have been encountered and Atlantic salmon on the Atlantic side (Irvine et al. 2009; Verspoor et al. 2007). Data on the in- and outflow of salmon in the main Arctic rivers is sparse and very much scattered spatially as well as temporally. The same goes for general abundance data sets. No major overview exists of in- and output for all major rivers in the Arctic system. The bulk of the (online) available English data stems from the Alaskan and Canadian rivers or coastal areas, which is site-specific and local.
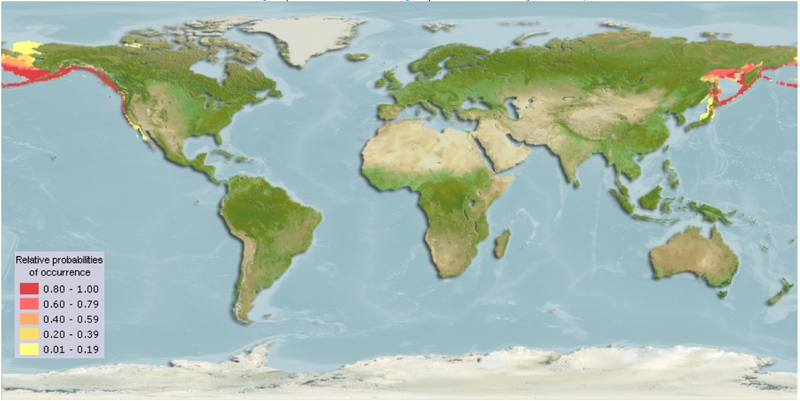
However, to get a first impression on the in- and output of Salmon, we chose to focus on the Chinook salmon (Oncorhynchus tshawytscha) in the Alaskan area, where data are available. The native range of the Chinook salmon is in the Northern Pacific coastal areas, as can be seen on Figure 4.
Chinook salmon only reproduces once in their life, after which they die. The adult fish swimming upriver will not return to the sea, however the hatchlings will. On the website for the Alaskan department for Fish and Game, fish counts can be retrieved for multiple species and rivers. Figure 5 shows the Alaskan areas where salmon fisheries are present, including the dominant species and principal river systems.
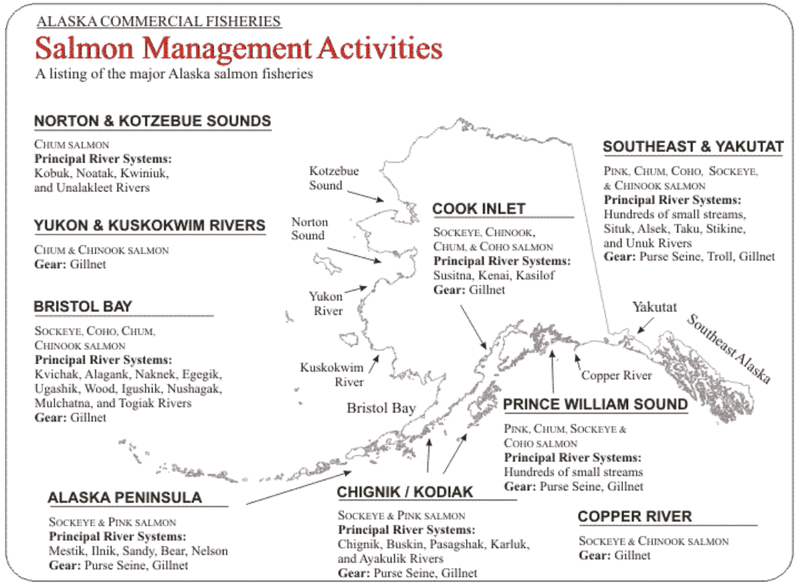
Figure 5: Salmon fisheries in Alaska. Source: http://www.adfg.alaska.gov/index.cfm?adfg=CommercialByFisherySalmon.salmonmaps_management
According to the Alaska department of Fish and Game, the Northern coasts of Alaska are occasionally home to small numbers of chum, pink, and Chinook salmon, however no count data is available. There were no data available from Chinook salmon on rivers opening into the Chukchi Sea. The only Chinook salmon count data available close to the study area of the Sea Basin Checkpoint project is from several rivers opening in the Norton Sound (Figure 6), we will show several as examples.
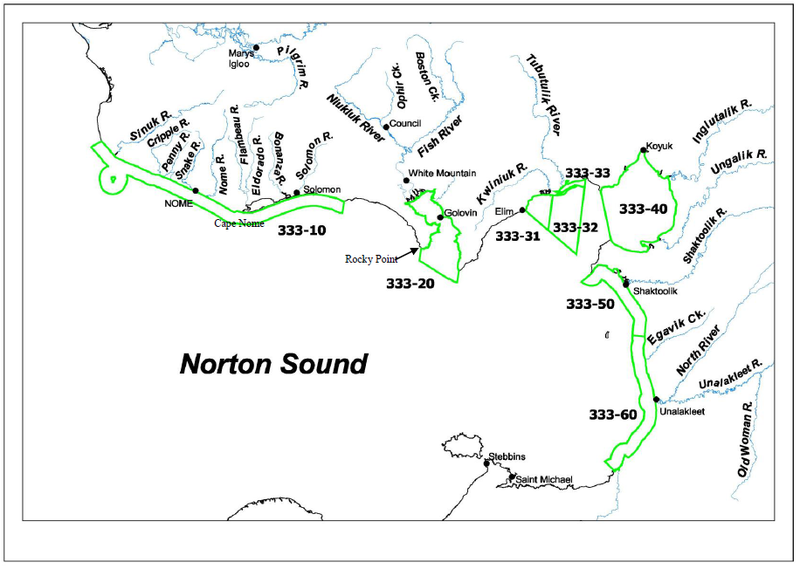
Figure 6: Rivers entering into the Norton Sound, which in turns opens into the Bering Sea. Source: http://www.adfg.alaska.gov/static/fishing/PDFs/commercial/nortonsound_salmon_statmap.pdf
On the Eldorado River, Chinook salmon counts have been monitored since 1995 from a counting tower (for more information on counting techniques, please go to http://www.adfg.alaska.gov/index.cfm?adfg=sonar.nonsonartools). The cumulative daily fish counts of Chinook salmon on the Eldorado River from 2005 to 2015 are shown in Figure 7. The cumulative daily fish counts of Chinook salmon on the Kwiniuk River from 2005 to 2015 are shown in Figure 8. The daily and cumulative counts are also available (http://www.adfg.alaska.gov/index.cfm?adfg=commercialbyareanortonsound.salmon_escapement).
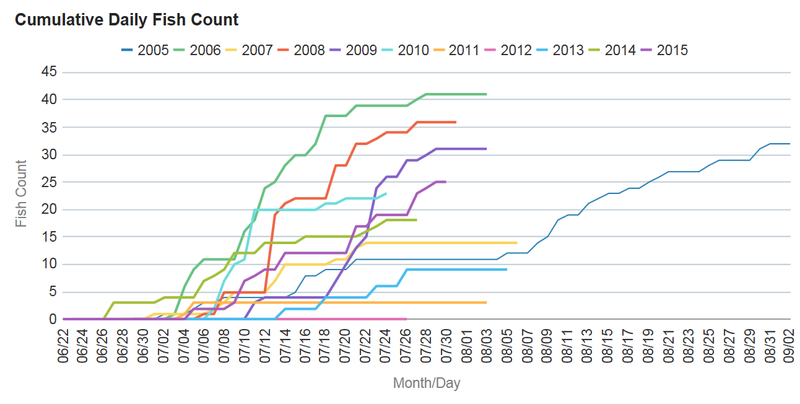
Figure 7: Cumulative daily fish count of Chinook salmon on the Eldorado River in Alaska, from 2005 to 2015. Source: Alaskan department of Fish and Game.
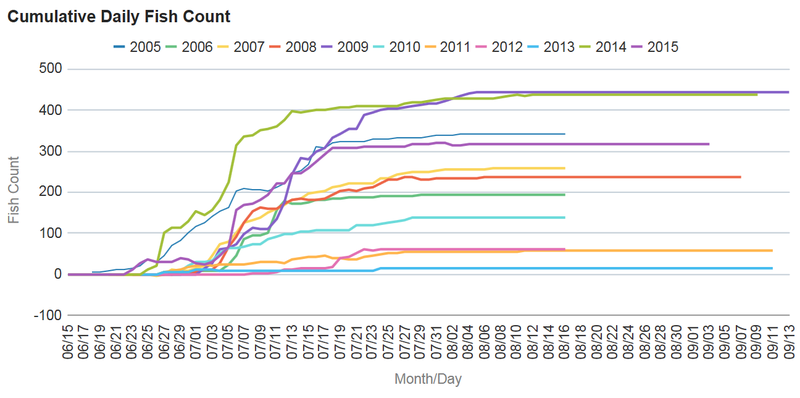
Figure 8: Cumulative daily fish count of Chinook salmon on the Kwiniuk River in Alaska, from 2005 to 2015. Source: Alaskan department of Fish and Game.
Further to the South is the Yukon River Delta, opening into the Bering Sea (Figure 9). In this area, Chinook salmon are more common as can be seen in the daily and cumulative counts (Figure 10). The daily counts are available as well (http://www.adfg.alaska.gov/index.cfm?adfg=commercialbyareayukon.salmon_escapement).
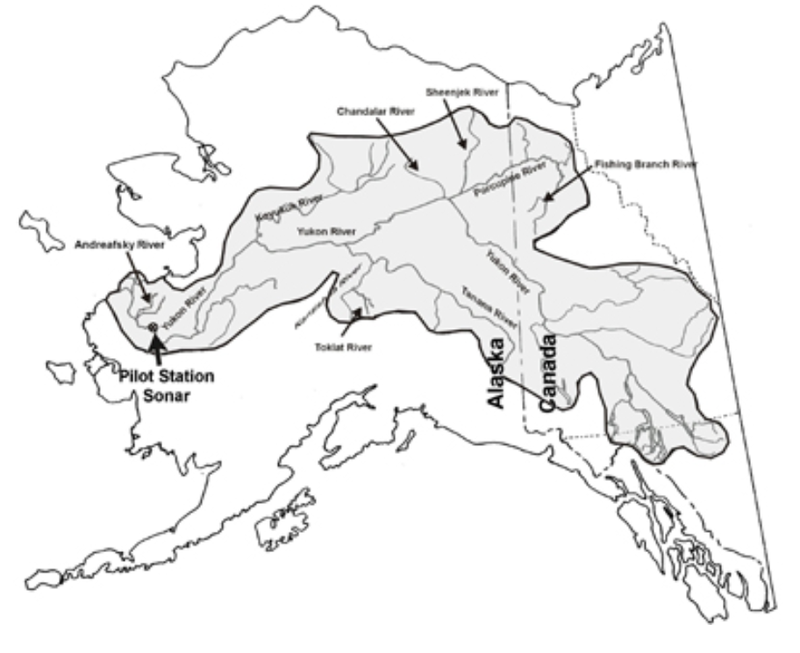
Figure 9: Location of Yukon River and the Pilot Station.
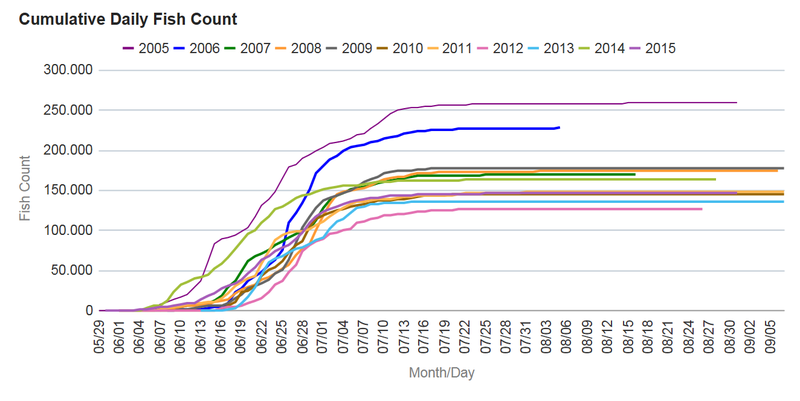
Figure 10: Cumulative daily fish count of Chinook salmon on the Yukon River in Alaska (Pilot Station, sonar monitoring), from 2005 to 2015. Source: Alaskan department of Fish and Game.
In the Northern Bering Sea the Yukon River Chinook salmon are the predominant stock group, as can be seen on Figure 11, from Murphy et al. (2009). Murphy et al. also describe this stock group reaching up North into the Chukchi Sea, especially during warmer winters with lesser amounts of sea-ice.
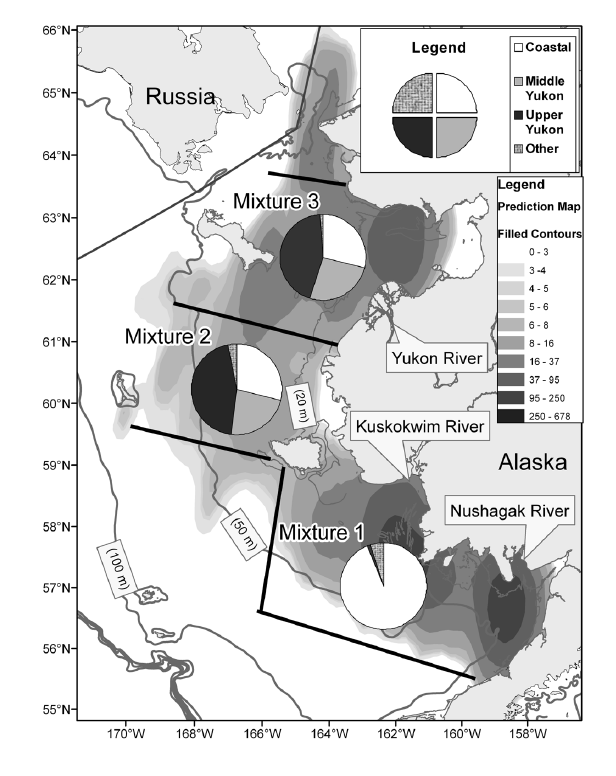
Figure 11: Genetic stock mixtures of juvenile Chinook salmon (Coastal Western Alaska, Middle Yukon, Upper Yukon, and ‘other’ stock groups) captured during U.S. BASIS surface trawl surveys on the eastern Bering Sea shelf (mid-August to early October), 2002–2006. Mixtures are overlaid on a map of juvenile Chinook salmon distribution and black bars identify the spatial extent of samples used for each mixture. Genetic mixtures are overlaid on the CPUE prediction surface from a Kriging spatial model. Contours are shaded at geometric intervals of the prediction surface. Source: Murphy et al. 2009.
In the “Yukon river salmon 2016 season summary and 2017 season outlook” (JTC, 2017) a figure is shown of the estimated amount of juvenile chinook salmon from the Yukon River (Figure 12), based on the stock-specific abundance estimates in the Northern Bering Sea. As the Chinook salmon spend three to four years in the ocean, predictions can be made to the returns after this period of time. With the known data and the estimated numbers, a recruitment curve can be drawn (Figure 13).
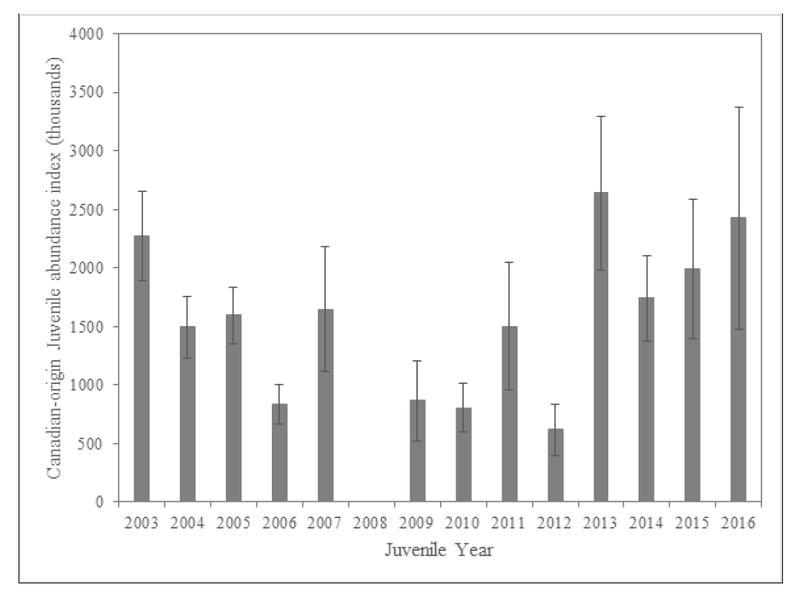
Figure 12: Juvenile abundance estimates of Canadian-origin Chinook salmon from the Yukon River based on pelagic trawl research surveys in the northern Bering Sea (2003–2016). Source: YRJTC 2016.
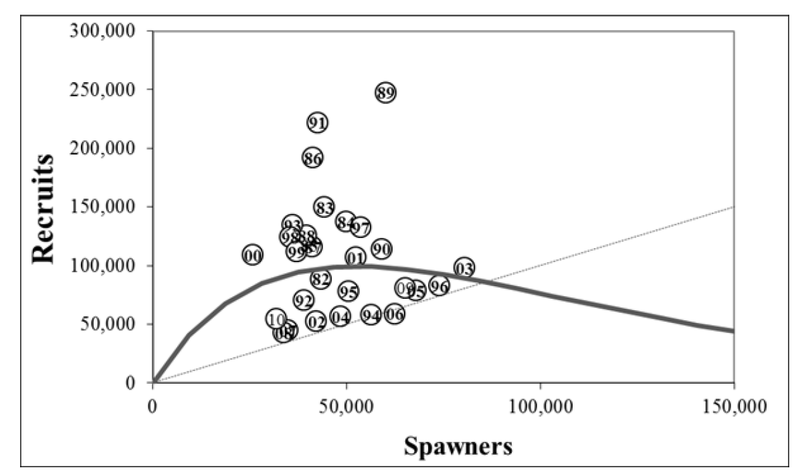
Figure 13: Yukon River Canadian-origin Chinook salmon recruits versus spawners, Ricker curve, and 1:1 replacement line. Brood years 1982-2010 are included. Source: YRJTC, 2016.
In Norway, Atlantic salmon is monitored yearly. Norway has approximately 400 watercourses in which Atlantic salmon is present, as indicated in Figure 14.
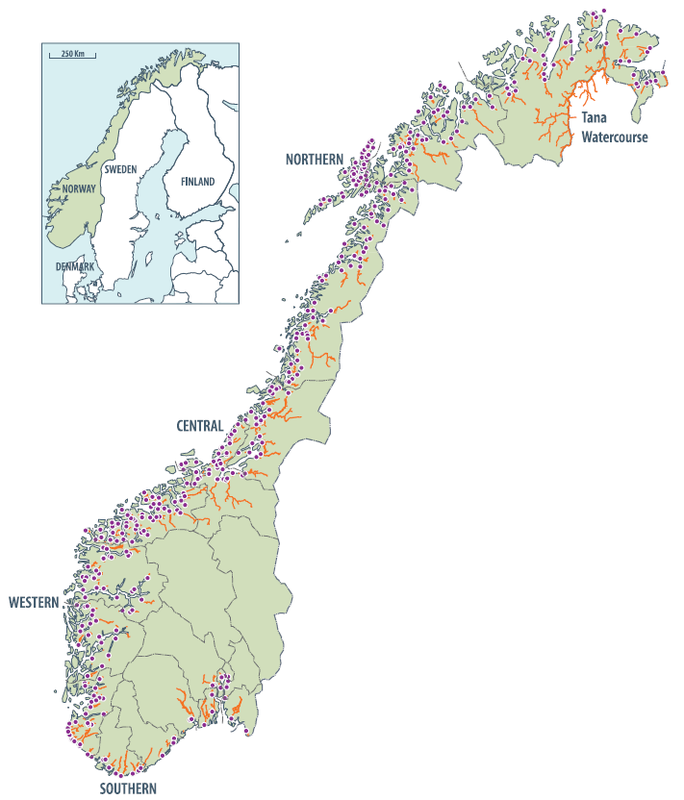
Figure 14: Norway with Atlantic salmon watercourses. The dots are the river outlets, the river areas avaulbe to salmon are the orange lines. In addition there are 31 other watercourses with Atlantic salmon, but the available nursery area in these are likely too small to support viable populations in isolation. The major regions of Norway and the large Tana watercourse are also indicated. Source: Forseth et al. 2017.
In recent years the numbers of Atlantic salmon returning to Norway has been relatively low, as can be seen in Figure 15. Because Atlantic salmon is an important commercial species in Norway, total abundance and river populations are carefully monitored. Exploitation is managed on both the total population as well as per river basin.
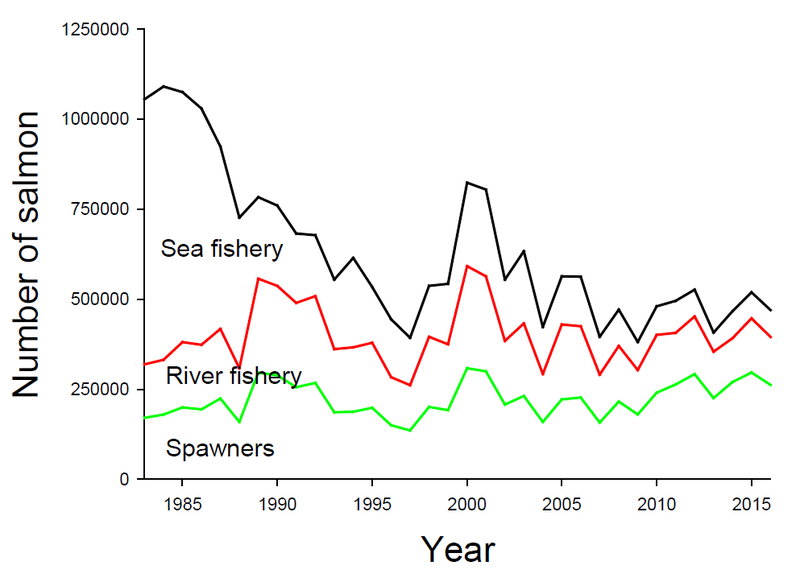
Figure 15: Estimated number of wild salmon returning from the ocean towards Norwegian rivers (pre-fishery abundance, black line), number of wild salmon entering the rivers (red line, i.e., the number left after catches in sea fisheries), and the number of wild salmon left for the spawning populations (green line, i.e., the number left after catches in sea and river fisheries) during the period 1983-2016. Source: Source: Vitenskapelig Råd for lakseforvaltning, 2017.
The Norwegian wild salmon population is threatened by several different factors, as summed up by the Vitenskapelig Råd for lakseforvaltning (2017):
- Escaped farmed salmon;
- Salmon lice;
- The introduced parasite Gyrodactylus salaris;
- Freshwater acidification;
- Infections related to fish farming;
- Hydropower regulation;
- Other habitat alterations.
The graph in Figure 16 shows these threats on a scale, indicating the severity of the effects. The background color gives an indication of the severity of the impacts, with dark as more severe (Vitenskapelig Råd for lakseforvaltning, 2017). To ensure a healthy salmon population the Norwegian government issued a quality norm which all salmon populations should attain sanctioned by the Nature Diversity Act.
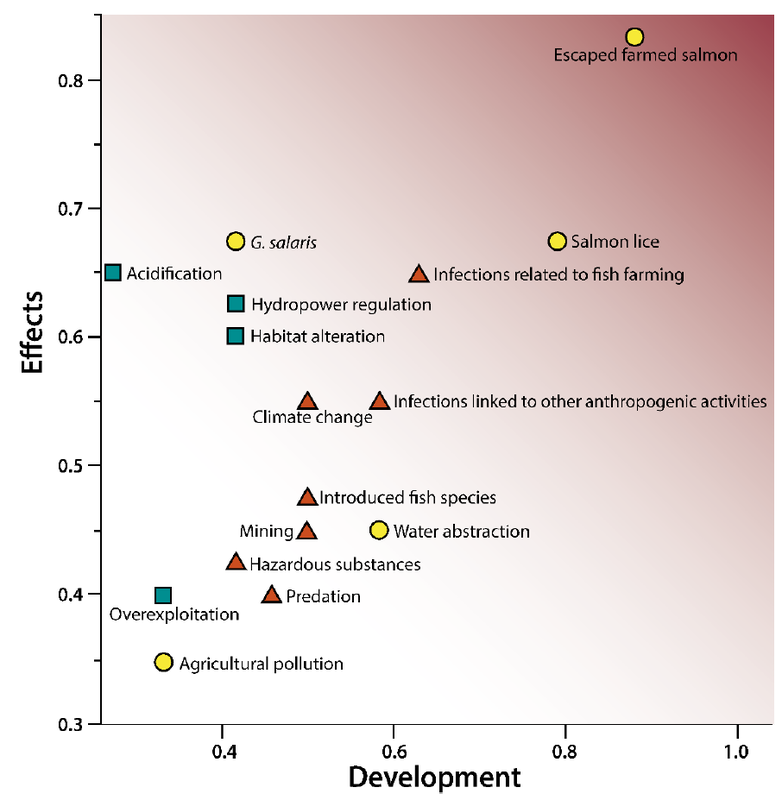
Figure 16: Threats to the wild Norwegian Atlantic salmon population. Green squares = Extensive knowledge and small uncertainty, yellow circles = moderate knowledge and moderate uncertainty, and red triangles = poor knowledge and high uncertainty. Source: Vitenskapelig Råd for lakseforvaltning, 2017.
Conclusion and recommendations
As an important commercial species in many countries, salmon stocks are usually quite well monitored. Depending on the catchment area, monitoring can be done on rivers or at sea. However, when looking from a river’s perspective, finding the data can be hard. Depending on the questions asked, data can either be readily available or very hard to come by.
We recommend focusing research on areas relevant for commercial salmon fisheries, creating an open database with stock information for the entire Arctic area or even global. The focus should not be on a single river or river basin, but instead on the species populations or stocks, looking at the entire geographical area the species uses.
References
- Forseth, T., Barlaup, B. T., Finstad, B., Fiske, P., Gjøsæter, H., Falkegård, M., ... & Vøllestad, L. A. (2017). The major threats to Atlantic salmon in Norway. ICES Journal of Marine Science, fsx020. https://academic.oup.com/icesjms/Arcticle/3061737
- Irvine, J.R., R.W. Macdonald, R.J. Brown, L. Godbout, J.D. Reist, and E.C. Carmack. 2009. Salmon in the Arctic and how they avoid lethal low temperatures. N. Pac. Anadr. Fish Comm. Bull. 5: 39–50. https://www.researchgate.net/profile/Jim_Reist/publication/224764437_Beyond_BASIS_Bering-Aleutian_Salmon_International_Surveys_-_salmon_in_the_Arctic/links/0c96053a247a3518ea000000/Beyond-BASIS-Bering-Aleutian-Salmon-International-Surveys-salmon-in-the-Arctic.pdf
- JTC (Joint Technical Committee of the Yukon River U.S./Canada Panel). 2017. Yukon River salmon 2016 season summary and 2017 season outlook. Alaska Department of Fish and Game, Division of Commercial Fisheries, Regional Information Report 3A17-01, Anchorage. http://www.adfg.alaska.gov/FedAidPDFs/RIR.3A.2017.01.pdf
- Lammers, R.B., J.W. Pundsack, and A.I. Shiklomanov, 2007. Variability in river temperature, discharge, and energy flux from the Russian pan-Arctic landmass, J. Geophys. Res. - Biogeosciences, 112, G04S59. http://onlinelibrary.wiley.com/doi/10.1029/2006JG000370/full
- Murphy, J. M., Templin, W. D., Farley, E. V. J., & Seeb, J. E. (2009). Stock-structured distribution of western Alaska and Yukon juvenile Chinook salmon (Oncorhynchus tshawytscha) from United States BASIS surveys, 2002–2007. North Pacific Anadromous Fish Commission Bulletin, 5, 51-59. https://pdfs.semanticscholar.org/4bb8/787c459fada985cba70b034edd202ed9023d.pdf
- Overeem, I., & Syvitski, J. P. M. (2008). Changing sediment supply in Arctic rivers. In Proceedings of a symposium held in Christchurch, New Zealand, December 2008, IAHS-AISH Publication. pp. 391–397. https://www.researchgate.net/profile/Irina_Overeem/publication/265794797_Changing_Sediment_Supply_in_Arctic_Rivers/links/541c1d900cf241a65a0bb42b.pdf
- Turowski, J. M., Rickenmann, D., & Dadson, S. J. (2010). The partitioning of the total sediment load of a river into suspended load and bedload: A review of empirical data. Sedimentology, 57(4), 1126–1146. https://www.researchgate.net/profile/Simon_Dadson2/publication/228779407_The_partitioning_of_the_total_sediment_load_of_a_river_into_suspended_load_and_bedload_A_review_of_empirical_data/links/0deec52839ef501718000000.pdf
- Verspoor, E., Stradmeyer, L., and Nielsen, J.L. (eds). 2007. The Atlantic Salmon: Genetics, Conservation and Management. Blackwell-Wiley, Oxford. 500 p.
- Vitenskapelig Råd for lakseforvaltning, 2017. Main findings of the 2017 annual report from the Norwegian Scientific Advisory Committee for Atlantic Salmon. http://vitenskapsradet.no/Portals/vitenskapsradet/Pdf/Status%20of%20wild%20Atlantic%20salmon%20in%20Norway%202017.pdf
Eel (inwards and outwards)
Read more
As no specifications have been made regarding the species of eel, it was decided to look at freshwater occurring true eels or eels of the Anguilla genus. Of the 16 Anguilla species, eleven are considered tropical and five are considered temperate (Arai, 2016). Of the five temperate species only two species reach the study area: European eel or Atlantic Eel (Anguilla anguilla) and American Eel (Anguilla rostrata) (Dekker, 2003; Solomon & Ahmed, 2016).
European eel or Atlantic Eel (Anguilla anguilla) has a complex life-cycle which included long-distance migration from fresh-water or coastal habitats to the spawning grounds in the Sargasso Sea but it does not have a major distribution in the Arctic Area (Figure 1, Fishbase and Wysujack et al. 2015).
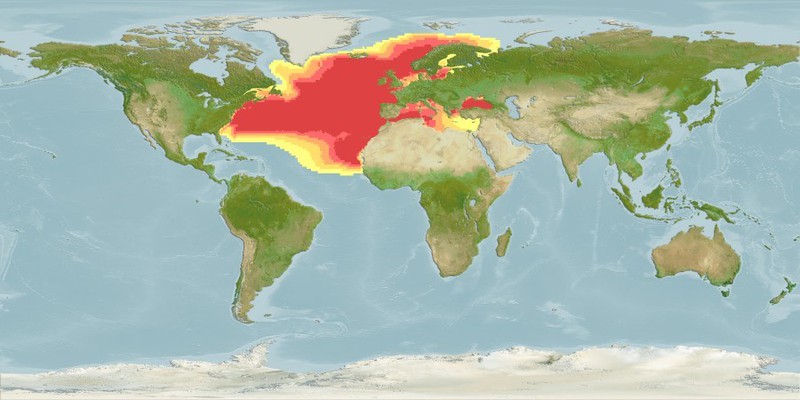
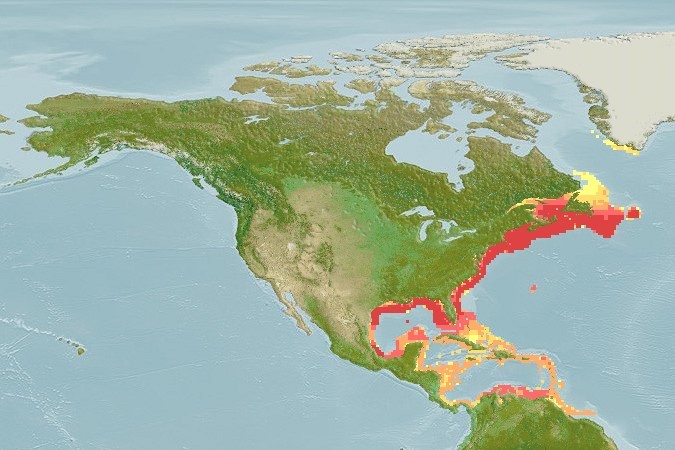
Figure 3: Native habitat of American Eel, source: Fishbase.org.
No other true eels live in the Arctic Area. However, a species which could be compared to both eel and salmon is the Arctic Lamprey (Lethenteron camtschaticum), an anadromous fish with an eel-like appearance. The distribution is almost circumpolar (ICES, 2016), as can be seen in the figure below (Figure 4). However, data on this species’ in- and outflow is scarce. In Alaska, the Arctic Lamprey is quite abundant, however no specific data on recruitment or migration is available (ADFG, Arctic Lamprey).
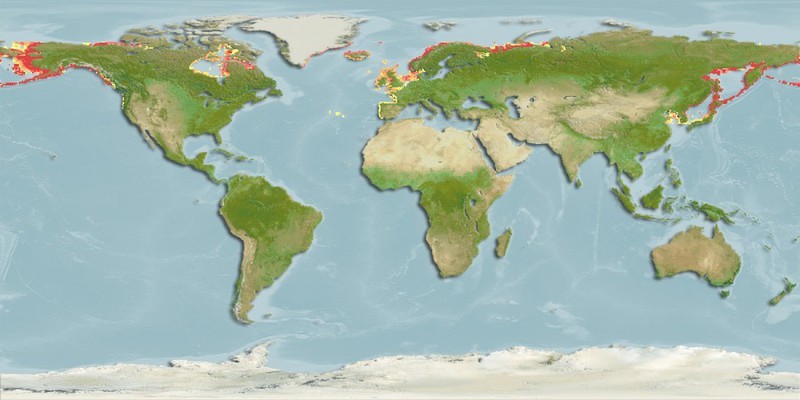
Figure 4: Native habitat of Arctic Lamprey, source: Fishbase.org.
Conclusions and recommendations:
There are no major eel populations in the Arctic area, but smaller stocks are present in the Northern territories. However, no data sources or data sets with eel abundances on the chosen Arctic rivers were found. Due to climate change the eel population might spread further into the Arctic area, where potential habitats are available. As eel is in many countries a commercial species, a better understanding of the distribution and populations of eel in the Arctic could prove useful. Monitoring of rivers can be quite time consuming and intensive, however, we would recommend using more automated methods than catch and release such as camera traps, laser counts and sound or echo location.
References:
- ADFG, Arctic Lamprey. https://www.adfg.alaska.gov/static/species/speciesinfo/_aknhp/Arctic_lamprey.pdf
- Arai, T. (Ed.). (2016). Biology and ecology of Anguillid eels. CRC Press.
- Boëtius, J. (1985). Greenland eels, Anguilla rostrata LeSueur. Dana, 4, 41-48. http://www.google.nl/url?sa=t&rct=j&q=&esrc=s&source=web&cd=1&cad=rja&uact=8&ved=0ahUKEwj2p7n3-bzTAhUKWhQKHdCoAPoQFgglMAA&url=http%3A%2F%2Fwww.aqua.dtu.dk%2F~%2Fmedia%2FInstitutter%2FAqua%2FPublikationer%2FDana%2Fdana_vol_4_pp_41_48.ashx%3Fla%3Dda&usg=AFQjCNEVkPvvpO9un_GVmVIGjN9m9u1osA&sig2=G734EOqB2-_nKIZ6JYEtTg
- Davidsen, J. G., Finstad, B., Økland, F., Thorstad, E. B., Mo, T. A., & Rikardsen, A. H. (2011). Early marine migration of European silver eel Anguilla anguilla in northern Norway. Journal of Fish Biology, 78(5), 1390-1404. https://munin.uit.no/bitstream/handle/10037/3641/Arcticle.pdf?sequence=1&isAllowed=y
- Dekker, W. (2003). On the distribution of the European eel (Anguilla anguilla) and its fisheries. Canadian Journal of Fisheries and Aquatic Sciences, 60(7), 787-799.
- Fishbase.org, Reviewed distribution maps for Anguilla anguilla (European eel), with modelled year 2100 native range map based on IPCC A2 emissions scenario. www.aquamaps.org, version of Aug. 2016. Web. Accessed 3 Apr. 2017. http://www.aquamaps.org/receive.php?type_of_map=regular#
- Karamushko, O. V. (2008). Species composition and structure of the ichthyofauna of the Barents Sea. Journal of Ichthyology, 48(4), 277-291. https://www.researchgate.net/profile/Oleg_Karamushko/publication/225561067_Species_composition_and_structure_of_the_ichthyofauna_of_the_Barents_Sea/links/574d401308ae82d2c6bc90f6.pdf
- Mecklenburg, C. W., Møller, P. R., & Steinke, D. (2011). Biodiversity of arctic marine fishes: taxonomy and zoogeography. Marine Biodiversity, 41(1), 109-140. https://www.researchgate.net/profile/Dirk_Steinke/publication/225083222_Biodiversity_of_Arctic_Marine_Fishes_Taxonomy_and_Zoogeography/links/0912f512b638467119000000.pdf
- Møller, P. R., Nielsen, J. G., Knudsen, S. W., Poulsen, J. Y., Sünksen, K., & Jørgensen, O. A. (2010). A checklist of the fish fauna of Greenland waters. Zootaxa, 2378, 1-84. https://www.researchgate.net/profile/Jan_Poulsen/publication/242602531_A_checklist_of_the_fish_fauna_of_Greenland_waters/links/00b7d526b9ffe93b6c000000.pdf
- Solomon, O. O., & Ahmed, O. O. European Eel: Ecology, Threats and Conservation Status. Journal of Schientific Research & Reports 10(7): 1-13. http://www.journalrepository.org/media/journals/JSRR_22/2016/May/Solomon1072016JSRR25850.pdf
- Wysujack, K., Westerberg, H., Aarestrup, K., Trautner, J., Kurwie, T., Nagel, F., & Hanel, R. (2015). The migration behaviour of European silver eels (Anguilla anguilla) released in open ocean conditions. Marine and Freshwater Research, 66(2), 145-157. https://www.researchgate.net/profile/Kim_Aarestrup/publication/271443167_The_migration_behaviour_of_European_silver_eels_Anguilla_anguilla_released_in_open_ocean_conditions/links/54cf85ee0cf298d65663ada0/The-migration-behaviour-of-European-silver-eels-Anguilla-anguilla-released-in-open-ocean-conditions.pdf
Data Availability
The data availability is very different for the requested parameters. Most data is available for the volume of water discharge. For some large Russian rivers time series are quite long, more than 70 years, up to more than 100 years. But many time series are relatively short, a few decades in many cases, and often incomplete. It is worrying that stations have been closed and data are delayed.
The data availability for the other parameters is much worse. Water quality monitoring is expensive, especially at remote sites. Therefore measurements are erratic, time series are short and measurement protocols differ between sites.
Bring and Destouni (2009) have also studied the status of the Arctic monitoring effort. They conclude that especially the water quality monitoring is fragmented and this restricts environmental modelers, policy makers and the public in their ability to integrate accessible data and accurately assess bio- geochemical changes in the Arctic environment. They note that the recent PARTNERS project (now continued as the Arctic-GRO) improved the situation, but large areas remain unmonitored. Bring and Destouni (2009) show that there is a significant difference between the characteristics of the monitored and unmonitored areas which limits the possibilities to generalize hydrological and hydrochemical impact assessments based on monitoring data. Even if the quality monitoring were at a level comparable to the quantity monitoring, the short time series still poses a significant problem.
An overview of available data sets can be found below.
Key data sets
In climate research the modelling the hydrological cycle is of key importance. In the hydrological cycle, the river discharge provides the major link between land and sea. The Arctic Ocean receives fresh water from several major rivers while the Arctic Ocean is relatively small and well confined by land masses. This makes it the Ocean with the largest fresh water influence. The urge to understand the role of the arctic in climate change has led to several initiatives that gather data on the hydrology of the arctic. These initiatives have compiled databases containing the water discharge and in some cases various other parameters for at least the six largest rivers: Ob’, Yenisey, Lena, Kolyma, Yukon and Mackenzie, but in some cases also many small streams. The databases that have been identified and used to compile time series are:
A notable data set that compiles information from the aforementioned databases is the ARDAT-database (Whitefield et al., 2015). In this database the monthly discharge and temperature cycle have been compiled and mapped to a 1/6° grid. This data set is particularly useful to drive environmental models like sea ice models and climatological models.
All these databases are freely accessible, in some cases registration is required.
Arctic-GRO
This project is an international effort to collect and analyse a time series of water samples from the six largest Arctic rivers using identical sampling and analysis protocols. This project focuses on gathering a complete data set on the discharge and constituent loads. The following data-sets have been gathered:
Arctic-GRO II constituent data (2012-2016): Ongoing; 28 campaigns carried out every other month on the six Great Arctic Rivers
Arctic-GRO I constituent data (2009-2011): Completed; 15 comprehensive campaigns with a focus on freshet, late summer, and under-ice periods; daily samples over the freshet
PARTNERS constituent data (2004-2007): Completed; 17 comprehensive campaigns
This is the only identified data source that provides data on all requested physical parameters for the major rivers (Water volume and temperature, Sediment, Total nitrogen and Phosphates)
ArcticRIMS
The ArcticRIMS project is a monitoring system for the hydrological cycle. Therefore its database contains data like precipitation, runoff, snow cover and air temperature. For this challenge only the discharge data are directly relevant and were considered. It appears that the ArcticRIMS discharge data is linked to the R-ArcticNET discharge data.
R-ArcticNET
The R-ArcticNET database contains the monthly averaged discharges of all large and most small arctic rivers. The database is hosted at the Water Systems Analysis Group of the University of New Hampshire. The most recent data in this database is from 2003. It is probably no longer maintained as the people who worked on this data set are now contributing to ArcticHYCOS, which contains a superset of the Arctic discharge data. Also the ART-Russia Temperature Data set is hosted here.
ArcticHYCOS
The Arctic-HYCOS project aims to improve the monitoring of freshwater fluxes and pollutants into the Arctic Ocean with the objective of improving climate predictions in the Northern Hemisphere and assessing the pollution of Arctic coastal areas and the open Arctic Ocean. Currently there is a database with monthly and daily discharge data for all large rivers and many small ones. Currently suitable monitoring stations are being identified to observe the total flow to the Arctic Ocean. There were ambitions to extend the database with additional parameters (temperature), but first observation methods need to be standardized (Looser BfG, pers. comm. 2016). This data set is hosted as a special subset of the global runoff database at the Global Runoff Data Centre at the Bundesanstalt fuer Gewaesserkunde (BfG) in Germany.
National agencies
All previously described data sets contain discharge data gathered by the national agencies: United States Geological Survey (USGS), Wateroffice Canada and the State Hydraulic Institute (SHI) of Russia. Therefore basically they contain the same data, albeit with potentially different post processing and data gaps. The USGS and Wateroffice Canada offer download websites where the data can be downloaded directly from the collecting agency. Apart from discharge also some suspended sediment concentration measurements were found.
References
- The Arctic Great Rivers Observatory (Arctic-GRO)
- ArcticRIMS
- R-ArcticNET
- ArcticHYCOS
- HYDAT – Wateroffice Canada
- NWIS United States Geological Survey
- Déry, Stephen & A. Stadnyk, Tricia & K. MacDonald, Matthew & Gauli-Sharma, Bunu. (2016). Recent trends and variability in river discharge across northern Canada. Hydrology and Earth System Sciences. 20. 4801-4818. Doi:10.5194/hess-20-4801-2016.
- Prinsenberg, S.J. 1986. Salinity and temperature distributions of Hudson Bay and James Bay. In: Canadian inland seas, I.P Martini, ed. Elsevier Publishers Ltd., Amsterdam.
- Whitefield, J., Winsor P., McClelland J., Menemenlis D., A new river discharge and river temperature climatology data set for the pan-Arctic region, Ocean Modelling, Volume 88, 2015, Pages 1-15, ISSN 1463-5003, http://dx.doi.org/10.1016/j.ocemod.2014.12.012.
- Zhang, X. He, J. Zhang, J. and Wu, P. (2013) Enhanced poleward moisture transport and amplified northern high-latitude wetting trend Nature Climate Change 3(1):47-51 January 2013 DOI: 10.1038/nclimate1631