User Guide
EMODnet Central Portal Query Tool
1. Input coordinates
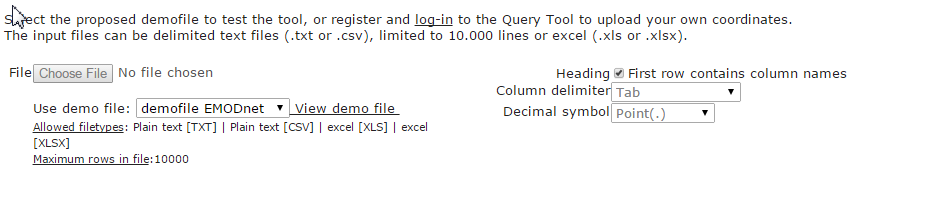
Start by uploading your coordinates. To upload you own coordinates, you are required to register to the Query Tool. The registration will only take one minute and allows you to keep your data private. In case you don't want to upload your own data, you can always use the demofile we provide without having to register.
The accepted file formats are text (.txt or .cvs) and excel (.xlx or .xlsx). Follow the column and decimal delimiters used in the demofile (tab and point, respectively) or match the delimiters of your file by choosing from the available options in the drop-down menus on the right.
2. Add data to your coordinates
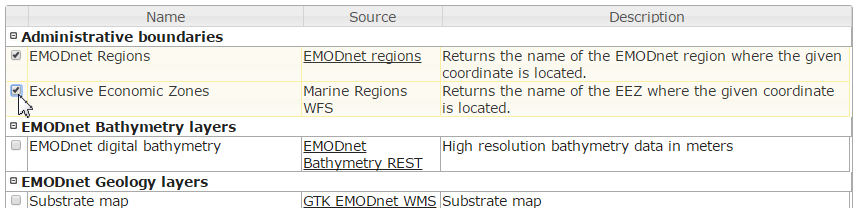
Once you've uploaded your coordinates file, you can start selecting what data you want to add to the coordinates. Click on the plus icon next to the name of each category to expand the selection. Choose from one to all services available.
Biology Services return taxon observations within either 1000m radius or 6minutes grid cell. We highly recommend that you choose only one of the two to keep the output file easy to read.
A full description and link to the service originator is given below in Web Services description. If you would like to use the Web Services yourself, these are available under "Source".
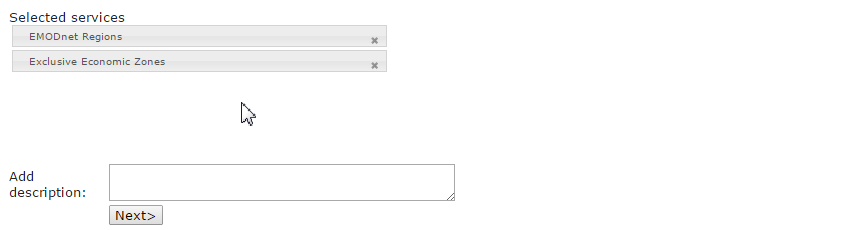
3. Selection overview
Review your selection, add a description to your query, and hit Next>
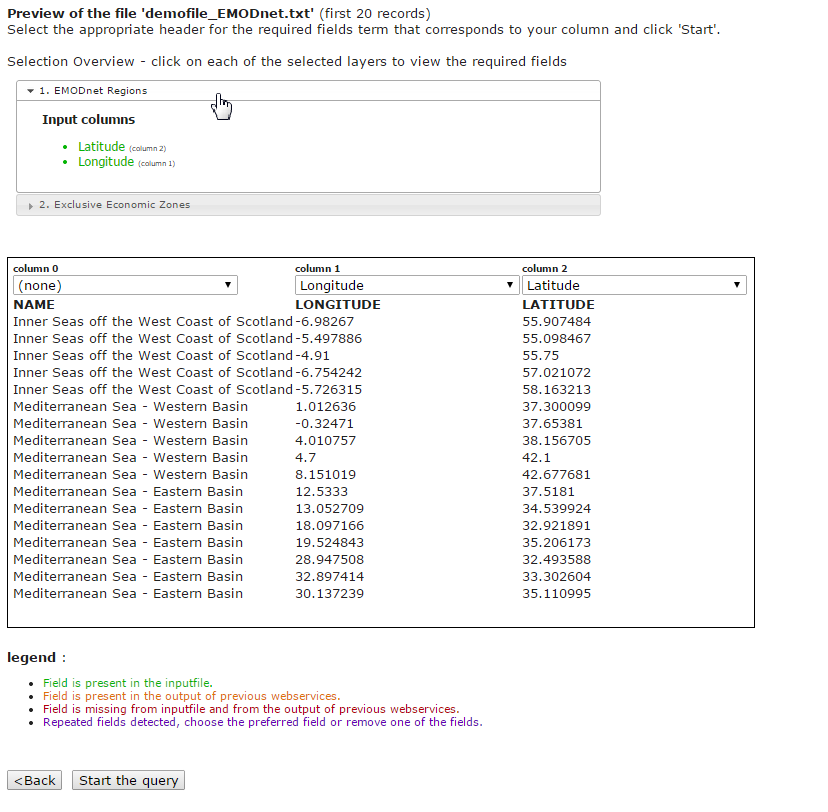
4. Check your coordinates
In the next page you can preview your coordinates and check the list of required fields per service. If your coordinates file is not properly formated you will be able to visualize it and hit <Back to fix it before running the query.
By clicking in the services listed under selection overview, you can view the required fields for that service. In case your input file has more columns than the required fileds (which are automatically recognised by the Query Tool) you can select the appropriate header from the drop-down menu in the preview box. In the example shown below, the list of coordinates also includes a column 0 with the header NAME. As indicated in the selection overview, this is not a required field for the query tool, so the query will run even if its left unmaned.
Hit Start the query!
After you start your query, a "job" is launched to retrieve the data you just order. You can choose to return to main page and start a new query or hit results for an overview of all the executed jobs.
5. Results
All jobs are stored in a table composed by the starting date of the query, the input file, the results report link to a summary page, the output file with the results, status of the order, and the comment field in which you identified your query in the first page.

Web Services Description
Administrative boundaries
EMODnet Marine Regions is a map of all European regional seas where EMODnet is present. This map will be replaced by the Marine Strategy Framework Directive regions as soon as it is released by the EU member-states.
Marineregions.org distributes the digital map of the World's EEZ based on the UNCLOS. In addition to the name of the EEZ where the coordinate is located, EEZ service will also return the name of the Sovereign State name and respective ISO code, Dependency, and MRGID (unique marineregions.org code). Visit marineregions.org for more information on the EEZ digital map.
EMODnet Bathymetry
A harmonised EMODnet Digital Terrain Model (DTM) is generated for European sea regions from selected bathymetric survey data sets and composite DTMs, while gaps with no data coverage are completed by integrating the GEBCO Digital Bathymetry. The present resolution of the EMODnet DTM is a gridsize of ¼ * ¼ arc minutes. At present the EMODnet Bathymetry portal provides DTM coverage for the following regions:
- The Atlantic Ocean (Channel, Celtic Seas, Western Approaches)
- The North Sea and Kattegat
- The Western and Central Mediterranean sea and Ionian Sea
- The Iberian Coast and the Bay of Biscay (Atlantic Ocean)
- The Adriatic Sea (Mediterranean)
- The Aegean - Levantine Sea (Mediterranean)
- Madeira and Azores (Macaronesia)
Bathymetry output is structured as follows:
- minimum water depth in meters to LAT (Lowest Astronomical Tide)
- maximum waterdepth in meters to LAT
- average waterdepth in meters to LAT
- number of values used for interpolation over the grid cell
- average waterdepth smoothed by means of a spline function in meters to LAT
- an indicator of the offsets between the average and smoothed waterdepth as a % of the waterdepth
EMODnet Geology
EMODnet Geology WMS consists of multiple layers of which the Central Portal has included 3 main layers: Seabed Substrate, Lithology, and Stratigraphy (1:250,000 scale). The output is given as follows:
Seabed Substrate: Seabed Substrate has one single value per coordinate point
BGR_EMODnet_Lithology_VALUE_LITH(1): Lithology may consist of one predominant value with a secondary value for the same coordinate point. In this cases the predominant value is listed under VALUE_LITH followed by the secondary lithology value under VALUE_LI_1
BGR_EMODnet_Stratigraphy_VALUE_AGE1: Stratigraphy may consist of one predominant value with a secondary value for the same coordinate point. In this cases the predominant value is listed under VALUE_AGE1 followed by the secondary stratigraphy value under VALUE_AGE2
EMODnet Seabed Habitats
EMODnet Seabed Habitats data services return 3 values per coordinate point:
Modelled Seabed Habitat , its Classification System, and the Region where the Habitat is located. The coverage of this layer extends to the Celtic Sea, the North Sea, the Baltic Sea, and the Western Mediterranean ( 1:500,000 scale).
The EMODnet Seabed Habitats will continue to gather habitats maps from all European Seas.
EMODnet Chemistry
EMODnet Chemistry web services are currently under development. Out of the WMS provided by EMODnet chemistry, this interface uses only the average concentration of PO43− in surface water of each regional sea and concatenates into one single output without temporal filter. As provided by the EMODnet Chemistry WMS, for the North Sea, English Channel, Kattegat, Skaggerak, Black Sea, and Sea of Azov, the results are integrated over seasonal averages. All the other seas are integrated over monthly averages. EMODnet Central portal will continue to improve the access to these services while EMODnet Chemistry is preparing a whole new set of data services.
EMODnet Biology
EMODnet Biology provides taxon observations around the given coordinate points. There are two ranges of search:
1. OBIS observations around a 1000m radius from the given coordinate. The output file is given as follows:
1000m_radius_taxonrank | : | Taxon rank (species, genus, family, etc.) |
1000m_radius_aphiaid | : | Unique identifier within the Aphia database (World Register of Marine Species) |
1000m_radius_scientifc_name | : | Name of taxon |
1000m_radius_num_observations | : | Number of observations records found in OBIS |
2. OBIS observations within the 6 minute grid cell (1 minute aprox. 1852 meters) where the given coordinate is located. The output file is given as follows:
latitude_obisobservations | : | Latitude of the centre of the grid cell where the coordinate is located |
longitude_obisobservations | : | Longitude of the centre of the grid cell where the coordinate is located |
obis_cscode | : | Numerical code of the grid cell where the coordinate is located |
6mgrid_scientific_name | : | Name of taxon |
6mgrid_aphiaid | : | Unique identifier within the Aphia database (World Register of Marine Species) |
6mgrid_taxonrank | : | Taxon rank (species, genus, family, etc.) |
6mgrid_num_observations | : | Number of observations records found in OBIS |
Please notice that EMODnet Biology values are given in columns.
EMODnet Physics
EMODnet Physics provides data services of mooring stations spread throughout European Seas. Unlike the services made available by the other Lots, Physics provides discrete data products. The services available on this Query Tool return values of a selected parameter measured by mooring stations within 10 000m radius of the given coordinate point. Currently, the Query Tool enables the access to 3 parameters: Sea Level, Temperature, and Salinity, the values are given as monthly averages for multiple years. The output file is structured as follows:
distance_to_station(km) | : | Distance between given coordinate and mooring station in km |
emodn_physics_PlatformID | : | ID of the mooring station |
emodn_physics_Year | : | Year of the measurement |
emodn_physics_Month | : | Month of the measurement |
emodn_physics_Parameter | : | Name of the parameter |
emodn_physics_Min | : | Minimum value of the month |
emodn_physics_Max | : | Maximum value of the month |
emodn_physics_AVG | : | Average value of the month |
emodn_physics_Depth | : | Depth of the measurement |
emodn_physics_QC | : | Quality Controled (1=yes ; 0=no) |
emodn_physics_ROOS | : | 2 character Country code |
emodn_physics_TotalRecordAVG | : | Number of records considered for the average |
emodn_physics_TotalRecord | : | Total number of records |
Please notice that EMODet Physics values are given in columns.