On 31 May, the meeting with the EMODnet Chemistry Board of Experts on the EU Marine Strategy Framework Directive (MSFD) took place online to showcase webODV: the online version of the Ocean Data View (ODV) software.
The meeting was chaired by Neil Holdsworth from ICES, who is responsible for uptake, outreach and interaction with key EMODnet Chemistry stakeholders to ensure the inclusion of Regional Sea Conventions and contribute to the implementation of EU legislation and wider open data initiatives. After introducing the outline of the meeting, Holdsworth handed over to Sebastian Mieruch and Reiner Schlitzer from the Alfred Wegener Institute (AWI), who gave an overview of the history of ODV and webODV, as well as information on its functions and latest enhancements.
ODV is an interactive data analysis and visualisation software developed by AWI since 1988 and continuously funded by the EU since 1995. It is appreciated by an ever-growing user community, as statistics show: 10,000 downloads of the latest version, 110,000 registered users, 250 visitors and 25 new users per day. It is also worth mentioning that the ODV data format has been adopted by SeaDataNet, EMODnet and the US SeaCube project. Images from ODV have been published in more than 1,400 scientific articles.
WebODV is the online version of ODV. Launched in 2016, webODV is an interactive and powerful tool accessible via the browser at https://webodv.awi.de and in a user-friendly virtual environment.
"The EMODnet Chemistry webODV Data Explorer and Extractor Tool is one of the webODV instances. This tool facilitates searching, subsetting and analysing datasets in various formats from the eutrophication and contaminant data collections that are regularly produced by EMODnet Chemistry."
Sebastian Mieruch, Alfred Wegener Institute, AWI
Mieruch gave an overview of the capabilities of ODV and webODV, highlighting their flexibility in handling different data types and the ability to create different visualisations such as time series, trajectories, scatter plots, maps and surface plots. Browsing through the pollutant data, he gave a live presentation of the data extraction service, which is built like a normal web application, with a three-step process to select the cruise domain and time, select variables and download.
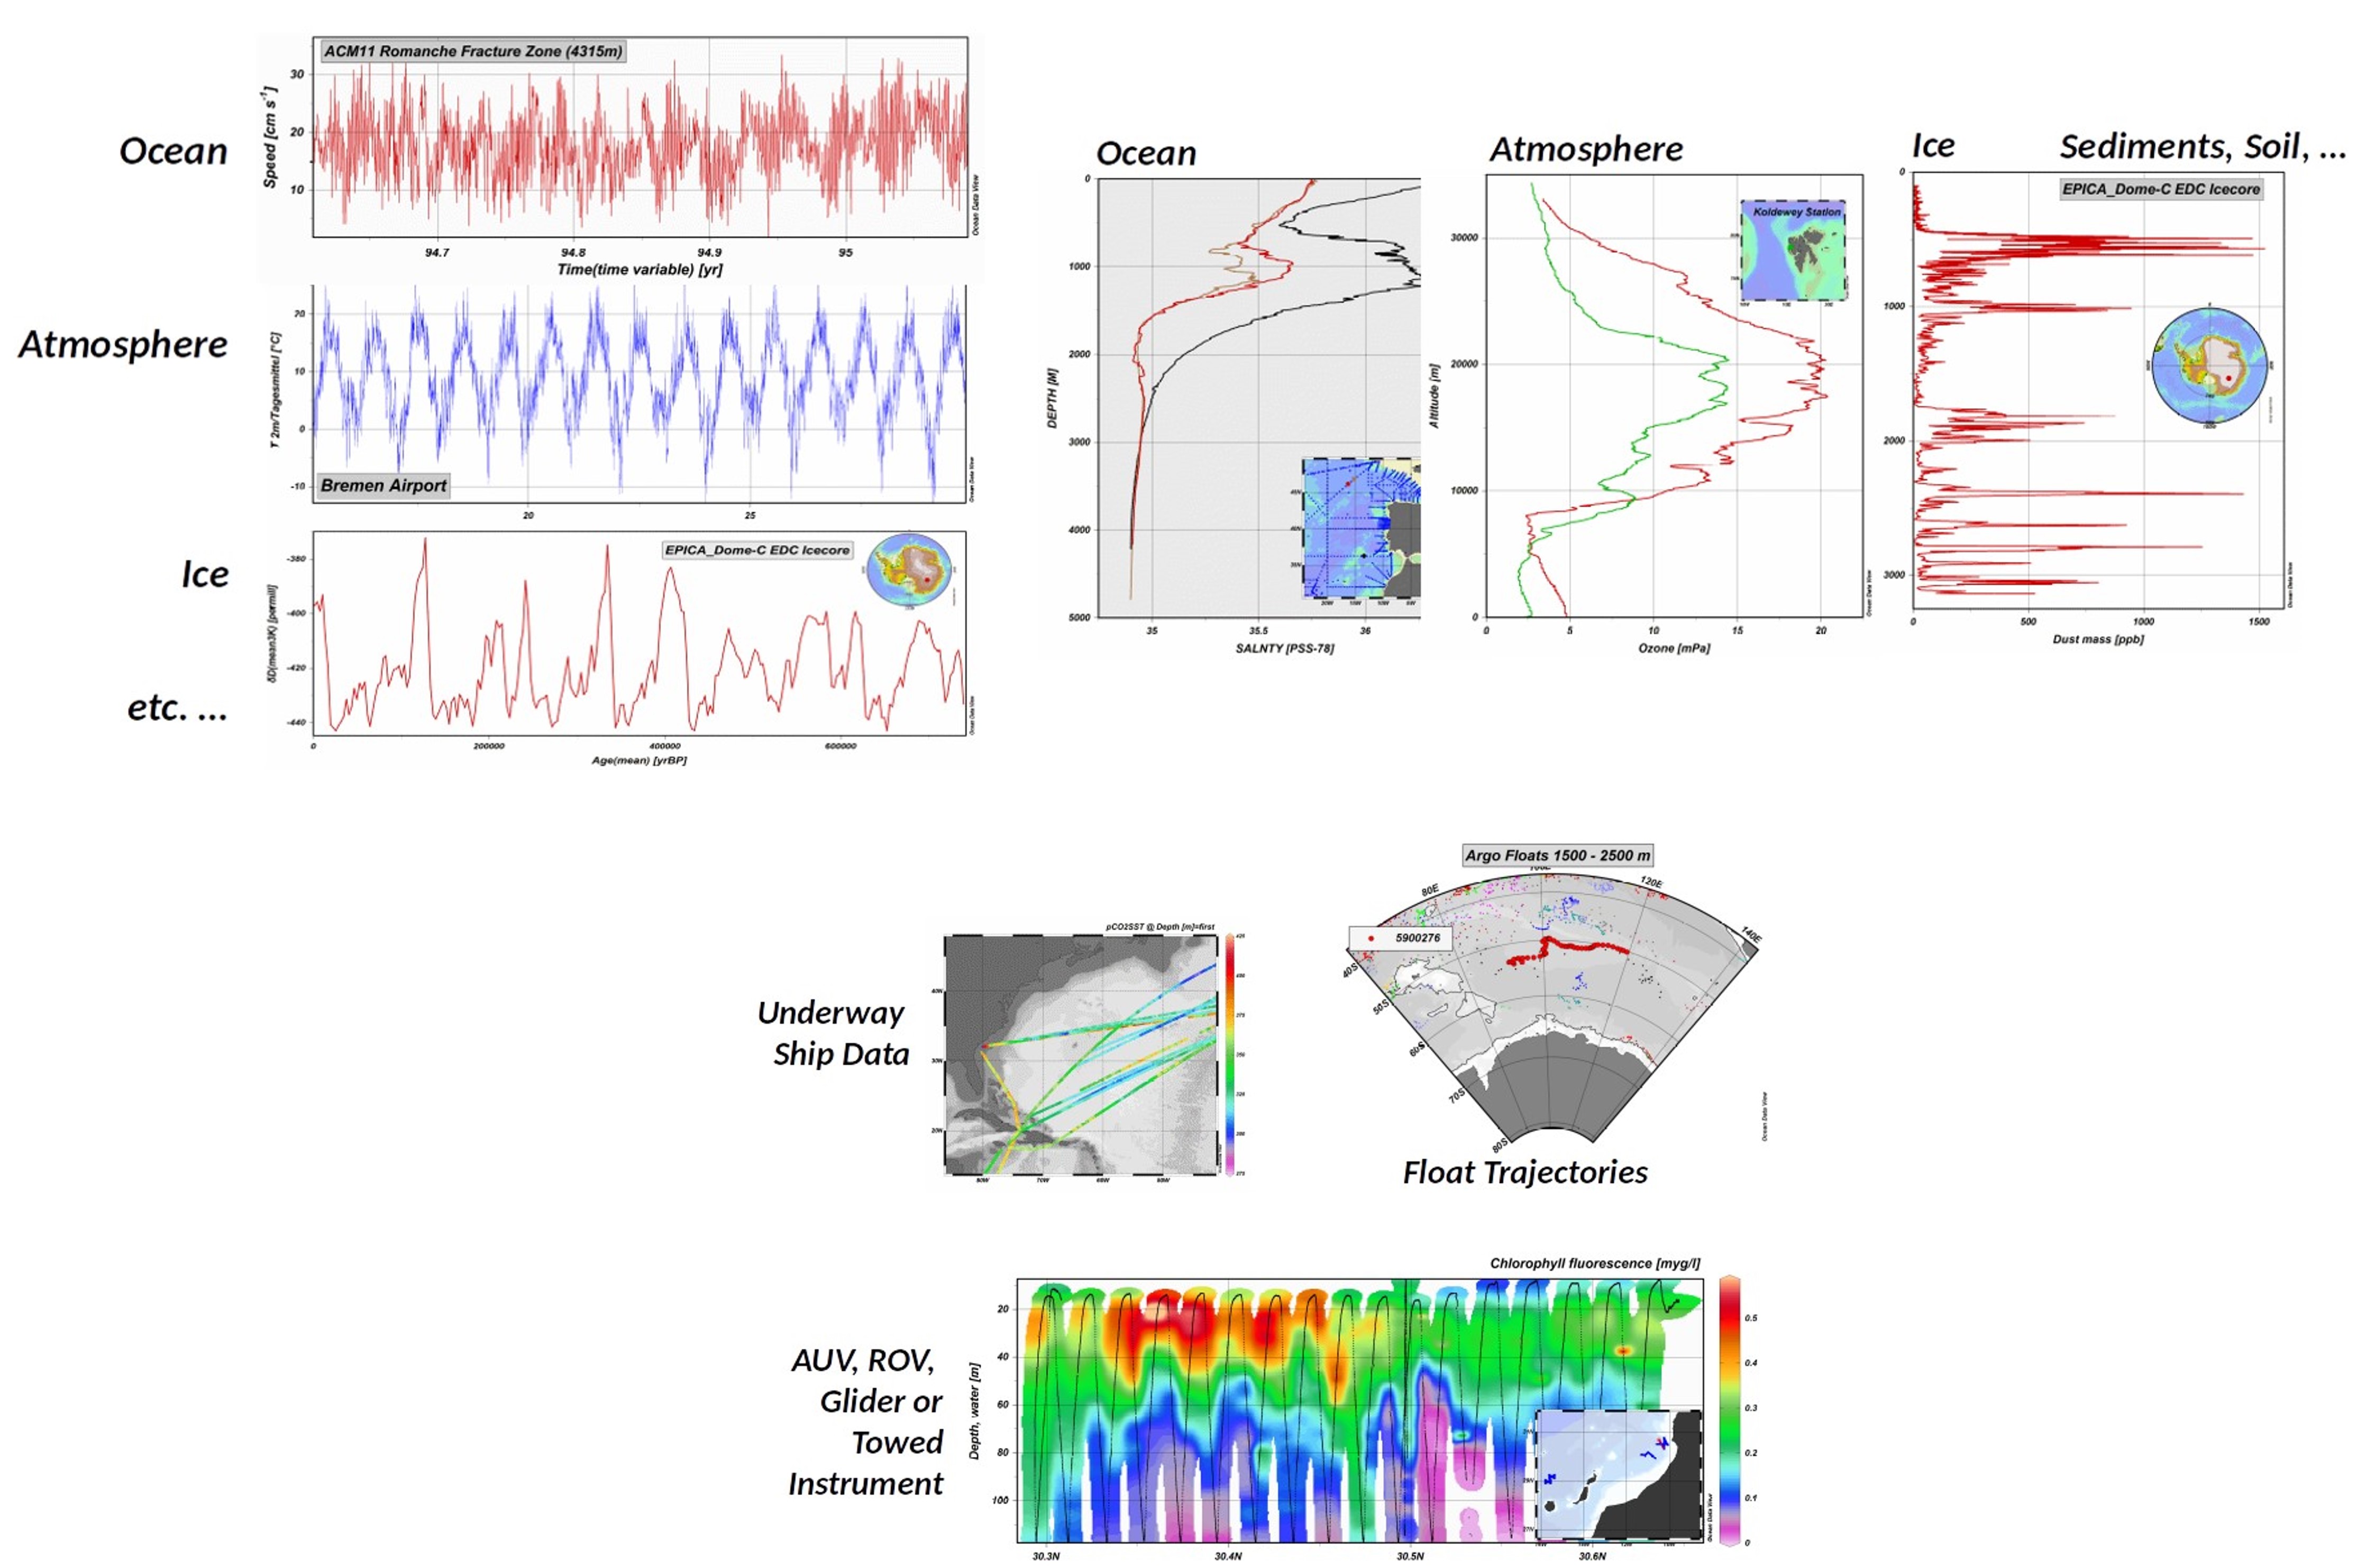
Some examples of the Timeseries (Top left), Profiles (Top right) and Trajectories (bottom centre) that users can create with ODV/webODV
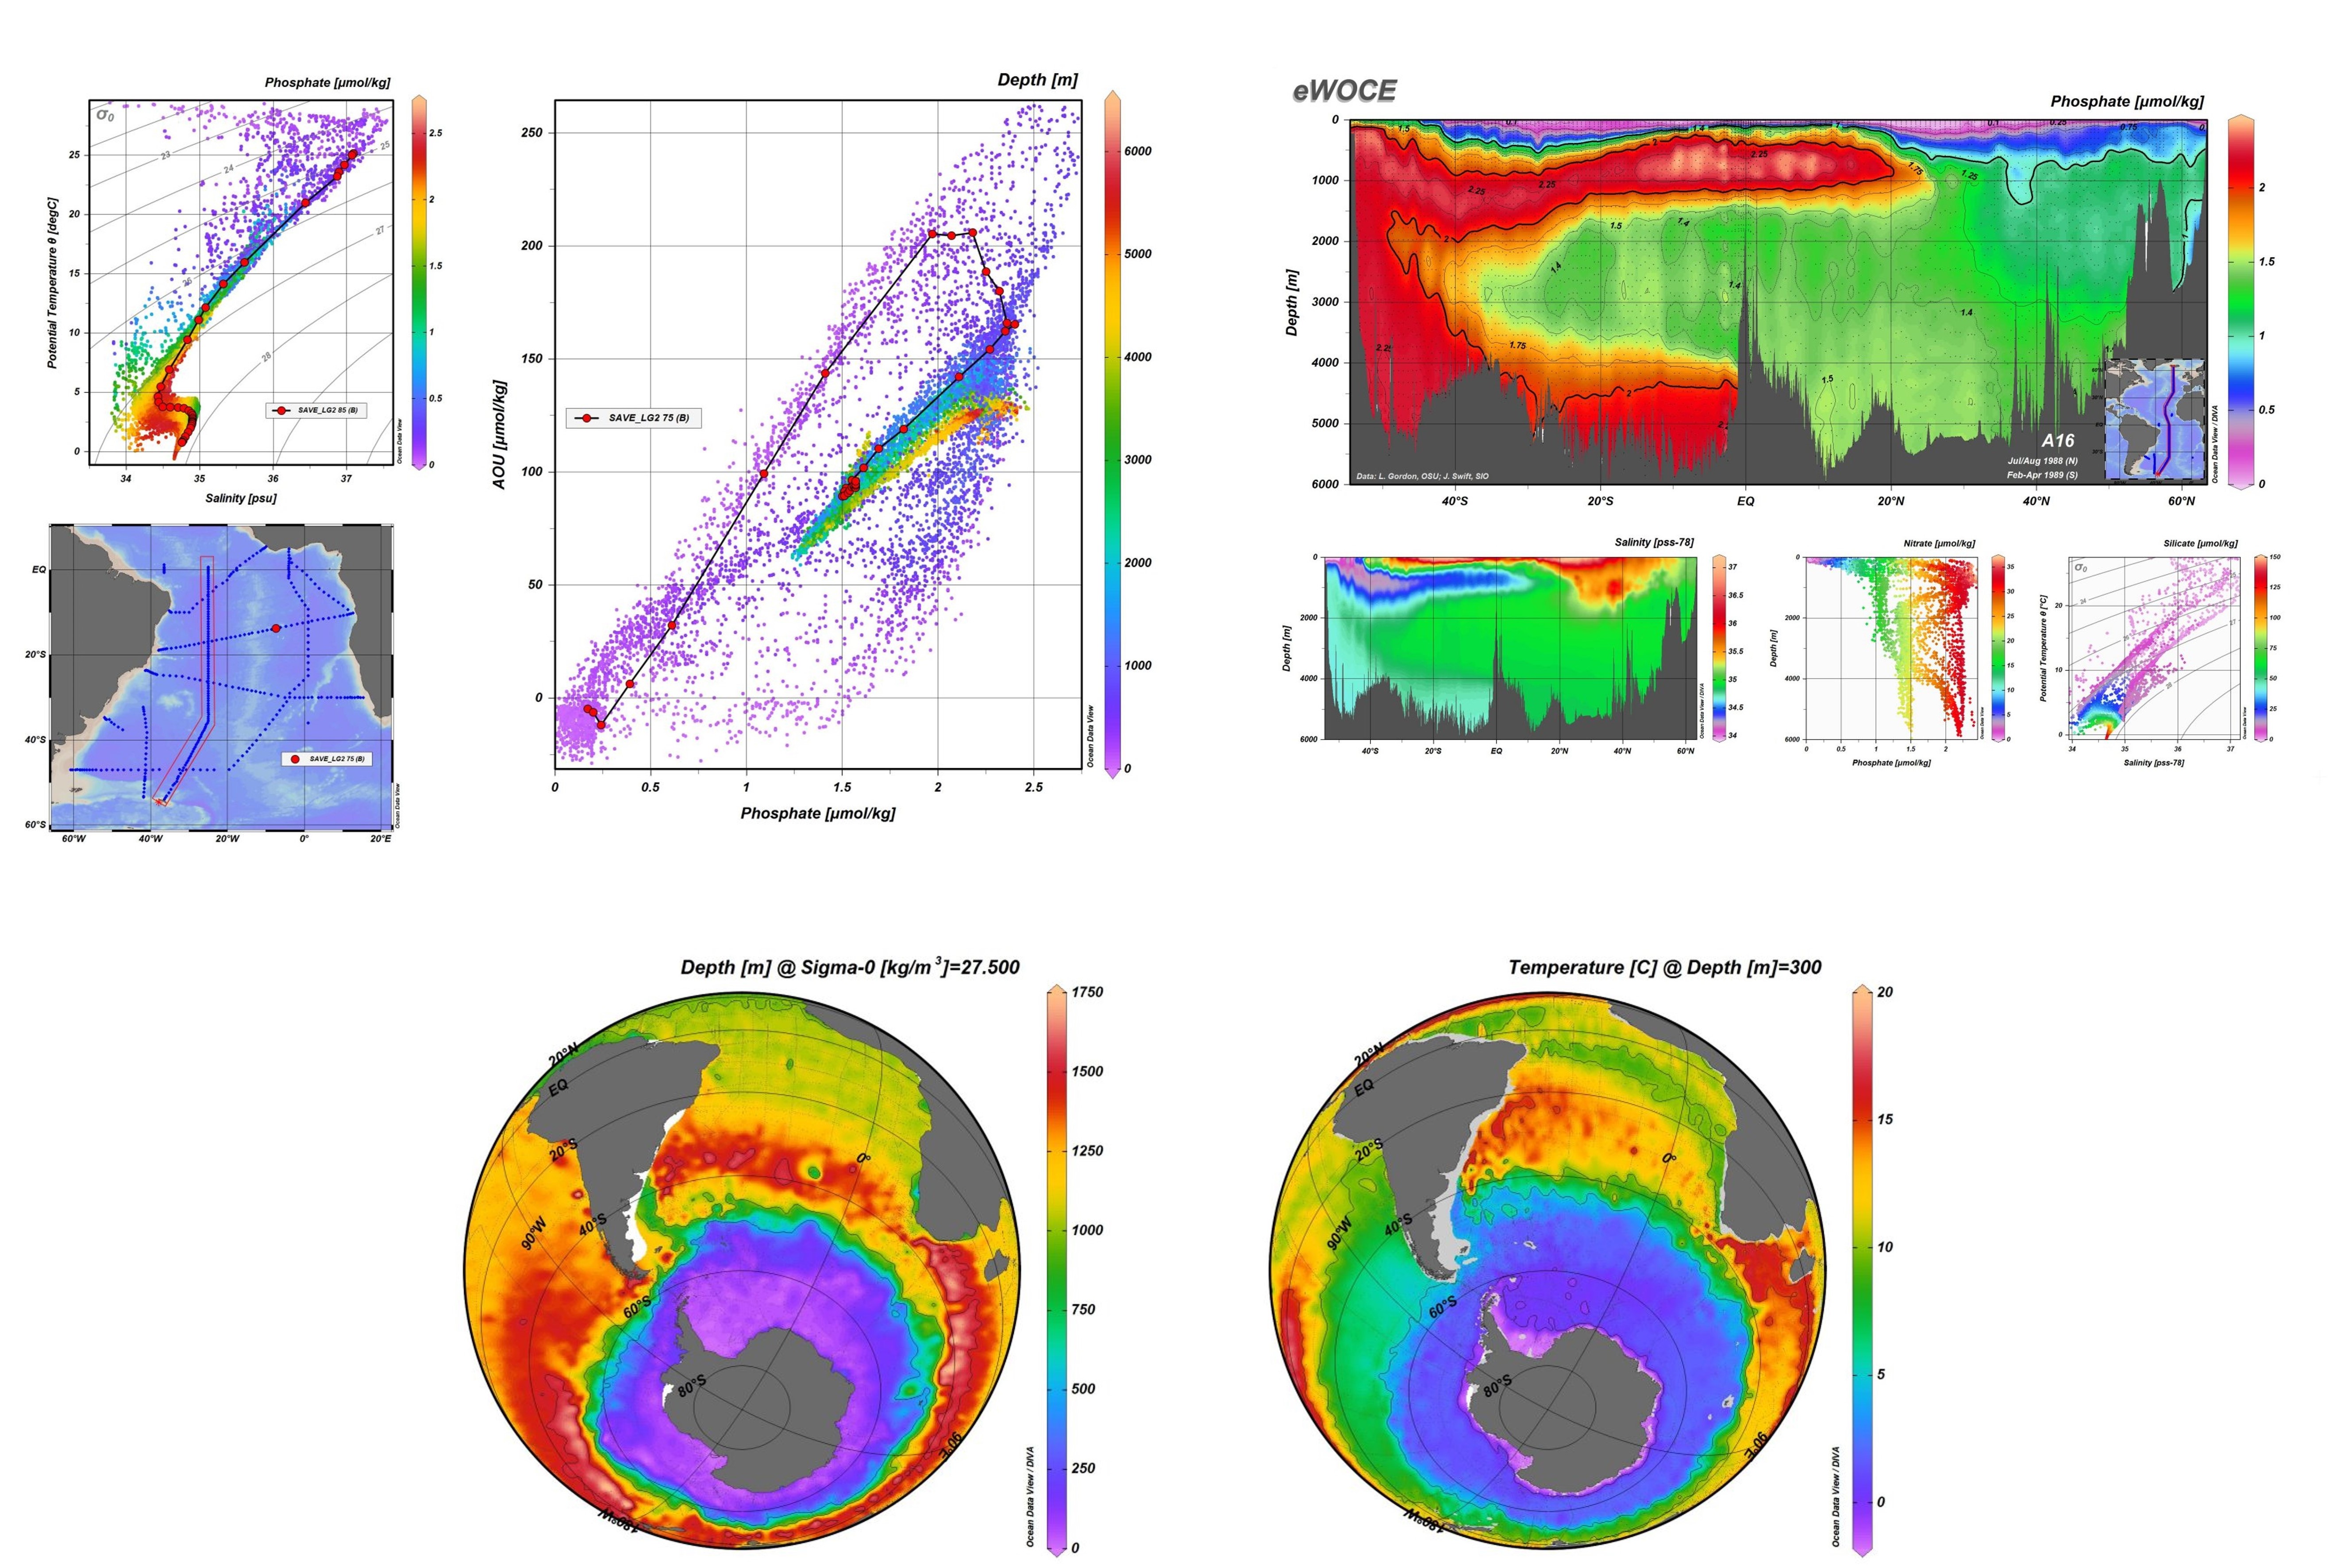
Different types of plots created with ODV/webODV. Top left: Scatter plots, Top right: Section plots, Bottom centre: Surface plots
Mieruch handed the stage to Schlitzer, who has been developing the ODV according to the needs of users for three decades. Schlitzer explained that the graphics and functionalities of webODV via the browser are the same as those of ODV stand-alone. He showed how the webODV Explorer interface allows users to easily dive into the 1.3 million stations and 23 parameters of eutrophication contained in the EMODnet Chemistry collections to explore, for example, oxygen data in the Adriatic Sea.
“Constructive feedback by users has been extremely useful for making ODV and webODV so successful. We thank users for their invaluable help in detecting bugs and for suggesting enhancements or new features altogether. For this reason, we warmly invite all participants of this meeting to join the ODV forum (https://odv.awi.de/nc/odv-forum/) to report bugs, comments or suggestions that could make the difference.”
Reiner Schlitzer, Alfred Wegener Institute, AWI
The meeting was attended by 20 participants, who actively took part in the discussion through frequent question and answer sessions and a live questionnaire.This revealed that 55% of participants were well aware of ODV/webODV, while the majority had only a superficial understanding of these services. Only 36% used them occasionally, but 27% of the participants stated that they were planning to use ODV in the near future. All participants agreed that the demo presented at the meeting gave them a good understanding of the great functionality and potential of these tools.
View the presentation and find more information on ODV and EMODnet Chemistry webODV Data Explorer and Extractor tool can be found at:
webodv-data-extractor-howto.pdf
Webodv-data-explorer-howto.pdf