 International and European commitments to reduce greenhouse gas emissions are driving significant changes in the energy generation mix to reduce reliance on fossil fuels. Offshore wind is seen as making an important contribution to greenhouse gas emission reduction targets and many European coastal states have developed ambitious programmes for the deployment of offshore wind farms. As with the development of any new major infrastructure, there are significant challenges in ensuring that developments are technically robust and economically viable but also environmentally sustainable. The development of new industries within the marine area also needs to respect and work with many existing activities, particularly shipping, fishing and tourism. The identification of areas that are potentially suitable for offshore wind farm development therefore presents many challenges.
The objective of the Wind Farm Siting Challenge was to:
- determine the suitability of sites for development of a wind farm. All aspects should be considered - wind strength, seafloor geology, environmental impact, distance from grid, shipping lanes - even if one of the factors makes this a no-go scenario;
- determine whether a floating or fixed wind farm would be more appropriate.
The sites to be analysed within this challenge were at the most appropriate points within the Arctic circle in the Norwegian Sea and the Barents Sea.
This challenge was conducted in the following steps:
Assessment 1: identifying locations with the best potential for developing offshore wind. Offshore Wind Development should be economically viable. For the Arctic Ocean Checkpoint project this means identifying the most appropriate areas to locate wind farms from an economic perspective.
Assessment 2: excluding areas too important for other stakeholders from the locations identified in the first assessment. Offshore Wind Development should have little impact on other uses – including the ecosystem of the proposed area.
This was followed by phase II in which the available data sets and the underlying shared questions are reviewed.
Main results
Results of assessment 1 and 2
Fixed wind turbines
Of the 13 blocks spread out along the Norwegian coast in a technical OWE assessment, none remained after taking other sea uses into account. Most were excluded due to their locations being in major shipping routes or marine protected areas.
Floating wind turbines
Of the 290 blocks in a technically suitable area, 124 blocks remain after taking other sea uses into account (table 1 and figure 1). Six of these blocks are in the Russian part of the Barents Sea (ICES area Ib), on the Murman Rise. The remaining blocks are in Norwegian waters (ICES area IIa2), mostly around the Lofoten and Tromsø. West of Trondheim the combination of other sea uses results in only a few remaining OWE blocks.
Table 1. Main characteristics of the remaining blocks with potential for developing (floating) offshore wind energy parks in the Norwegian Sea and Barents Sea, based on the first round of assessments within ‘SeaBasin Checkpoints – lot Arctic’.
| ICES area | No. OWE blocks | Mean distance to port (km) | Mean water depth (m) | Mean wind speed (m/s) | Area (km2) |
| Ib | 6 | 238 | 179 | 8.2 | 1553 |
| IIa2 | 118 | 203 | 272 | 8.4 | 29969 |
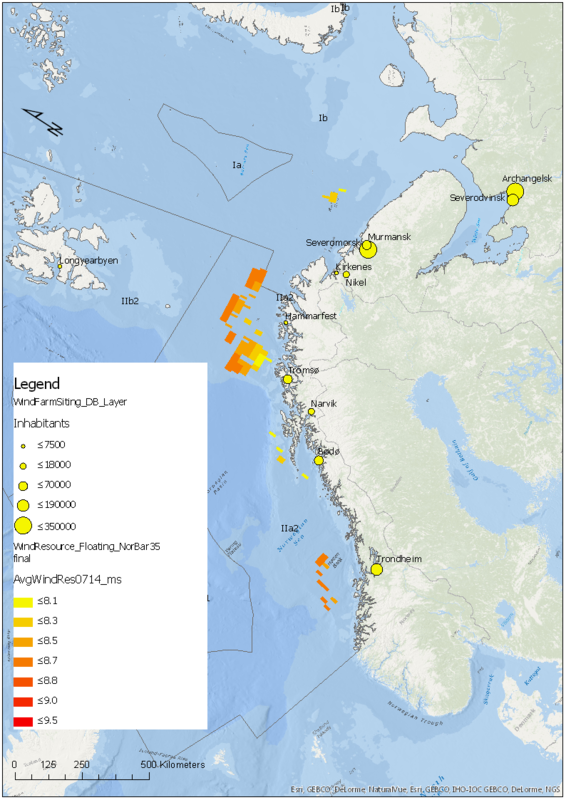
Figure 1: Map showing the area with potential for developing (floating) offshore wind energy parks in the Norwegian Sea and Barents Sea, based on the first round of assessments within ‘SeaBasin Checkpoints – lot Arctic’. Also shown are human settlements that may play a role in this development.
More details on the approach and detailed results can be found here:
1st Wind Farm Siting Challenge - Assessment part 1
To have determined the best technical and economic area several data sets were required to provide information about the options to develop offshore wind turbines. Data sets were searched to support the following objectives:
- An economical and viable development needs a market for the electricity it produces. This means the presence of cities, ports or large industrial sites. Alternatively, high voltage connection points can also be used to transport the electricity to a market. Currently existing connection points are often located near cities, ports, large industrial sites and power stations (conventional/nuclear/etc.);
- Developing offshore wind energy also requires facilities like ports, quays and cranes to support the activities of building, operating and maintaining the turbines and the supporting infrastructure of cables and transformer platforms. This also means the necessary on-shore availability of motorways, railways and airports, e.g. to allow specialized persons or replacement parts quick access to the area.
Locations that satisfy objectives 1 and 2 are presented in Table 1 and figure 1.
Table 1 Locations representing both the presence of a market and infrastructure available for offshore wind energy development (data from a.o. Wikipedia and other websites of municipalities and ports). Suitability or presence of infrastructure was indicated as followed: 0 absent/unsuitable; 1 present/suitable; 2 with limitations.
| Name | Inhabitants | Port Maint | Port Cons | Heavy Ind | Grid Connect | Railroad | Motorway | Airport | Country |
| Murmansk | 300000 | 1 | 1 | 1 | 1 | 1 | 1 | 1 | RU |
| Severomorsk | 50000 | 1 | 1 | 0 | 1 | 1 | 1 | 1 | RU |
| Tromsø | 70000 | 1 | 1 | 0 | 1 | 0 | 2 | 1 | NO |
| Bodø | 50000 | 1 | 0 | 0 | 2 | 1 | 2 | 1 | NO |
| Trondheim | 180000 | 1 | 1 | 0 | 1 | 1 | 1 | 1 | NO |
| Narvik | 18000 | 1 | 1 | 0 | 1 | 1 | 2 | 2 | NO |
| Hammarfest | 7500 | 1 | 0 | 0 | 1 | 0 | 2 | 2 | NO |
| Kirkenes | 3500 | 1 | 1 | 0 | 1 | 0 | 2 | 2 | NO |
| Longyearbyen | 2000 | 0 | 0 | 0 | 0 | 0 | 0 | 1 | NO |
| Nikel | 12500 | 0 | 0 | 1 | 1 | 0 | 2 | 0 | RU |
| Archangelsk | 350000 | 1 | 1 | 0 | 1 | 1 | 2 | 1 | RU |
| Severodvinsk | 190000 | 1 | 1 | 1 | 1 | 1 | 2 | 2 | RU |
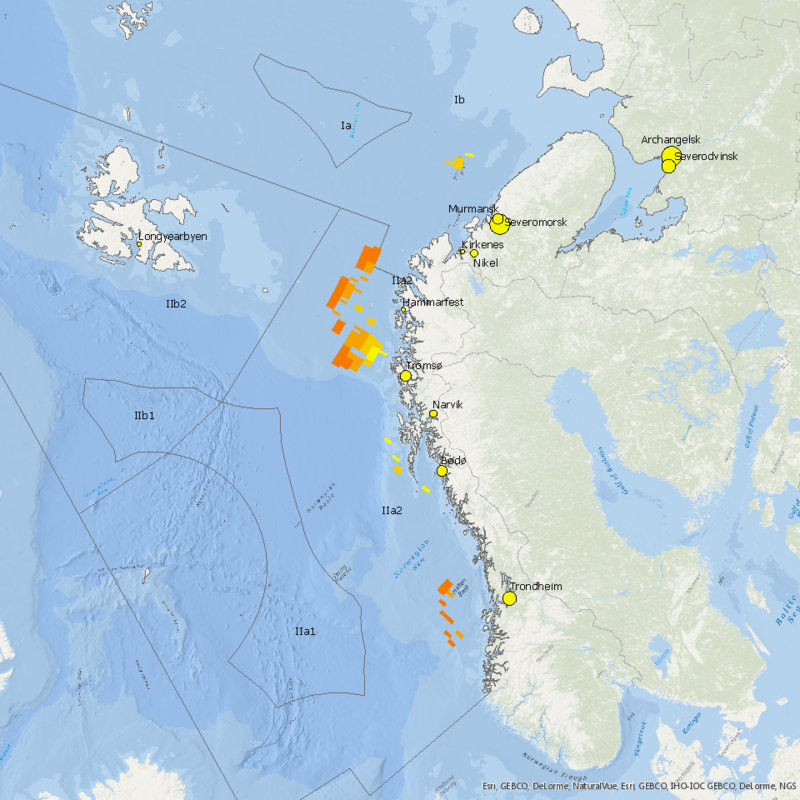
Figure 1: Map of the Norwegian Sea and Barents Sea showing the locations from the table above, based on assessment 1 and 2. Yellow-to-orange colours indicates the identified area was suitable for offshore wind farm development, darker colours signify higher mean wind strength.
Once the locations with suitable market and infrastructure were identified, two further data sets became important:
- Bathymetry (water depth, metres) (GEBCO 2014 gridded bathymetry 0.0083 degrees)
This indicates locations with suitable water depths that are compatible with either a fixed or a floating offshore wind turbine. - Wind strength (m/s) (Copernicus Marine Environmental Monitoring Services or CMEMS)
CMEMS had a set of satellite-derived data sets (with global coverage 0.25 degrees) available covering six recent years of monthly wind climatology. Data was available for a total of 59 of the 72 months of the six year period. To ease the analysis an average wind resource was calculated and applied.
The data collecting instrument on the satellite, a scatterometer, came with its own limitations. One of these was that a scatterometer cannot determine wind speeds over land or over an ice-covered sea. Thus the average wind resource dataset had no data where sea ice had prevented observations during the observation period. However this was not a severe problem given the current technology.
There was sufficient data available for the wind resource dataset. The available wind resource for the Norwegian Sea and, where data is available, the Barents Sea, was comparable and possibly somewhat larger than that for the North Sea. This dataset also provided the resolution used in the analysis. By combining the market and infrastructure data sets with coastline geography data sets (Arctic countries coastlines), a third important dataset was developed, Distance to port and market
This was useful to determine how far it was possible to develop an offshore wind farm. This distance was an important economical factor as it determines many costs, such as length of the HV-cables that brought the generated power to the market, and the travel time required when building, operating and maintaining the wind farm.
Assessment Part 1
To properly interpret the data sets outlined above it was necessary to make some realistic assumptions about offshore wind technology options: .
- How far from port and market it was economic to attempt to develop OWE.
The maximum distance within the North Sea, currently one of the best developed OWE areas, is a little over 200 km (close to the centre, on the Doggerbank). For the purpose of this study the upper limit was set at 250 km. - How water depth was likely to interact with offshore wind turbine technology.
- Fixed OWT can be built to water depths to about 50 m deep, with several construction options including monopoles, tripod, jacket and gravity-based (concrete) foundations structures. This choice more or less follows the current state of technology in the North Sea
- Floating turbines can be built in water depths starting from ca. 100 m. to ca. 500 m. deep. These numbers match with pilot installations and early wind farm developments for turbines such as the HyWind (SPAR-type) and WindFloat (floating jacket). This technology was still in its infancy and not many such turbines were in operation.
Data assembled by the EU-project ACCESS on a.o. SPAR-type platforms (D 4.21) shows that these are reasonable assumptions
Sea ice and offshore wind turbines
Offshore wind parks had not yet been built in (sub-)Arctic waters, where sea ice (or larger ice floes) can occur. Technically it was possible to build wind turbines strong enough to withstand the forces exerted by sea ice. It increased their cost for which the economics of offshore wind turbines do not allow. Icing of the turbines blades can form one more complication that requires both technical attention and increases costs of maintenance. The pragmatic choice made for this study to not suggest OWE development in ice covered waters due to the lack of satellite wind speed data over ice covered sea areas was therefore also justified by economics.
While technology options to construct ice-resisting OWT did exist (see reports of ACCESS), the increased costs made them not currently viable. This is an active field of research within wind turbine development.
1st Wind Farm Siting Challenge - Assessment part 2
The second step of the assessment is to exclude those areas where an impact on the ecosystem or other uses of the sea area can be expected from the technical and economic potential determined in the first step. For this study four marine uses have been considered:
- Fisheries, using a dataset generated for OSPAR by ICES Working Group on Spatial Fisheries Distributions (WGSFD). Data included information on the surface interaction of mobile bottom-touching fishing gears (Swept Area Ration or SAR). Fishing activities do not combine well with offshore wind turbines as the fishing gear may cause damage to electricity or mooring cables, and the presences of wind turbines may also pose a danger to the fishing vessel and its crew. However, other types of fishery can be performed within an OWF, e.g. angling and other passive gears.
- Shipping, using a dataset provided by Halpern et al. (2015). The dataset has global cover, is in high detail (ca. 1 x 1 km) and of a recent year (2013).
- Marine Protected Areas, to respect nature conservation areas the MPA-database that was assembled for the MPA Challenge was re-used. For the Wind Farm Siting it was augmented with a few Norwegian MPA that were not included in the original dataset (too far south), but were relevant at this point. The MPA-database relies heavily on the WDPA, but many other (national) sources were reviewed, leading to a few dozen additions across the whole Arctic.
The current assessment for potential OWE sites was based on known protected locations within our current vision because assessing every location in the wealth of detailed data available, especially for Norwegian waters, was beyond the scope of this project.
The MPA-dataset serves here as a proxy to ensure minimal impact on the ecosystem. - Oil and Gas infrastructure, including pipelines (Norwegian Petroleum Directorate or Oljedirektoratet). These were incorporated using the map services offered by the NPD to see the positions of oil and gas infrastructure (platforms and subsea installations) as well as pipelines.
When implementing each of the three above data sets, suitable cut-off values or choices were required. For the fourth dataset the mere presence of oil and gas infrastructure was seen as sufficient.
For fisheries, the effort within the technical OWE area was considered. Due to a lack of pattern, the final selection was made manually. OWE-blocks with several (five or more) and relatively intense recorded fisheries activities were excluded from the locations selected for potential OWE development. Access to fishing grounds that could become isolated within wind farm areas were also considered. Within the technical OWE area, 75% of the fishing effort was to be respected and this area was excluded from the potential OWE development sites.
For shipping, connectivity and access to ports is vital. Locations with 600 or more ‘vessel movements’ were considered too important for the shipping industry and were therefore excluded from potential OWE sites.
For Marine Protected Areas (nature conservation and general biodiversity considerations), the existing MPA-database was used in combination with a 5 km buffer distance outside. OWE development must therefore be located at least 5 km away from nature conservation areas, as a number of the MPA are also home to bird nesting colonies. Thus ensuring a free corridor in and out of MPAs, unobstructed by wind turbines for foraging and or migrating species.
For Oil and Gas infrastructure, the presence of any infrastructure has led to excluding the blocks from the technical OWE area. The selection had to be made manually as the software did not adequately detect overlap.
Very few OWE-blocks were excluded due to a single obstruction. In most cases shipping obstructions combined with either fishing grounds or areas in or near MPA.
Detailed maps of assessment 2
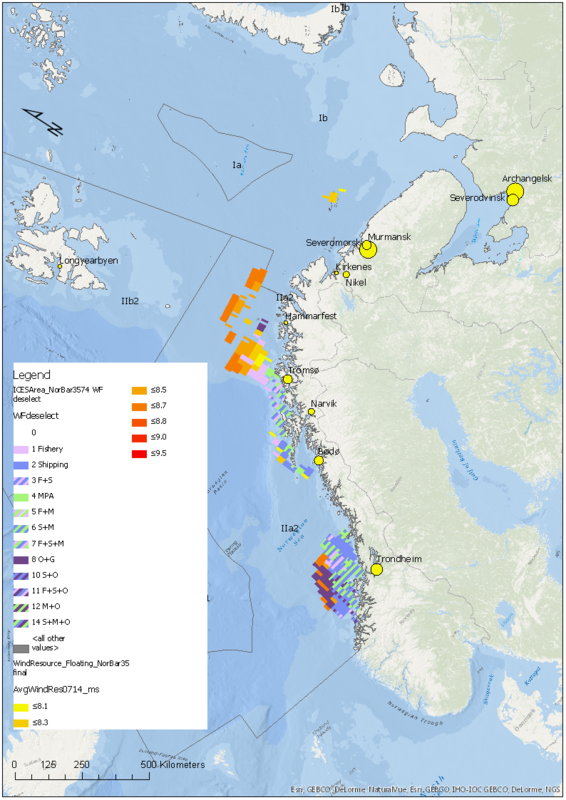
Figure 1: Combined map showing OWE development potential for (floating) offshore wind turbines in the Norwegian Sea and Barents Sea, as well as dropped area with an indication of the other sea users that were given precedence.
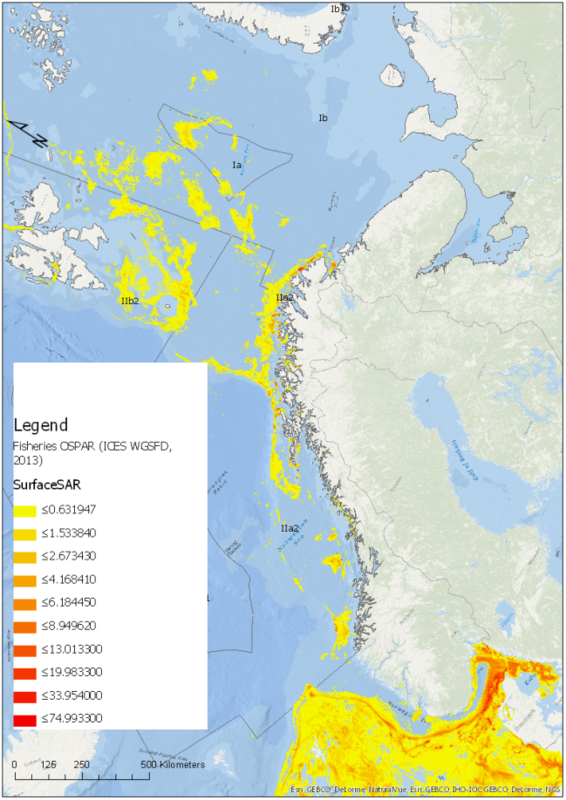
Figure 2: Map showing the available information on fishery effort in the Norwegian Sea and Barents Sea and surrounding areas.
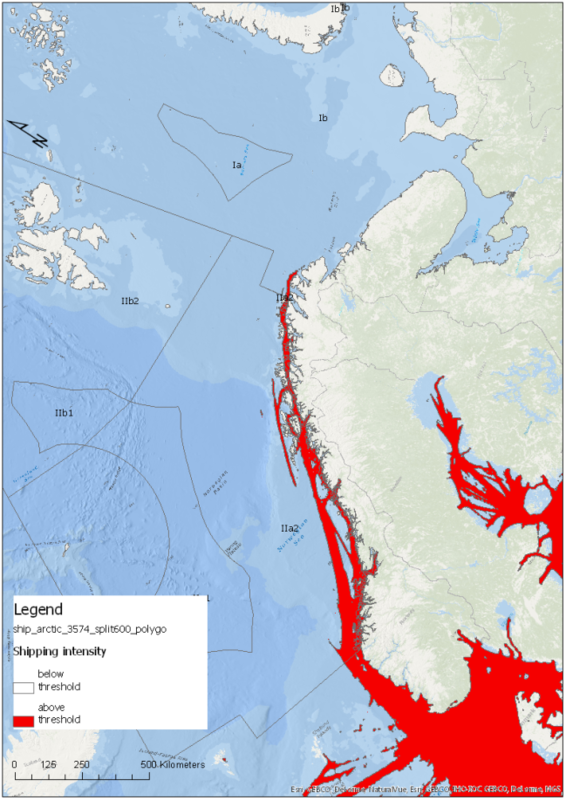
Figure 3: Map showing the available information on shipping in the Norwegian Sea and Barents Sea and surround areas.
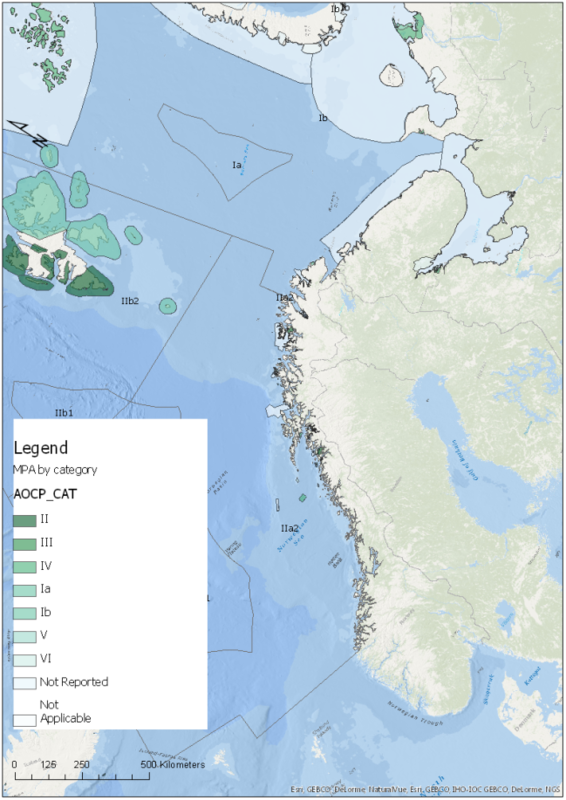
Figure 4: Map showing the available information on MPAs in the Norwegian Sea and Barents Sea and surround areas.
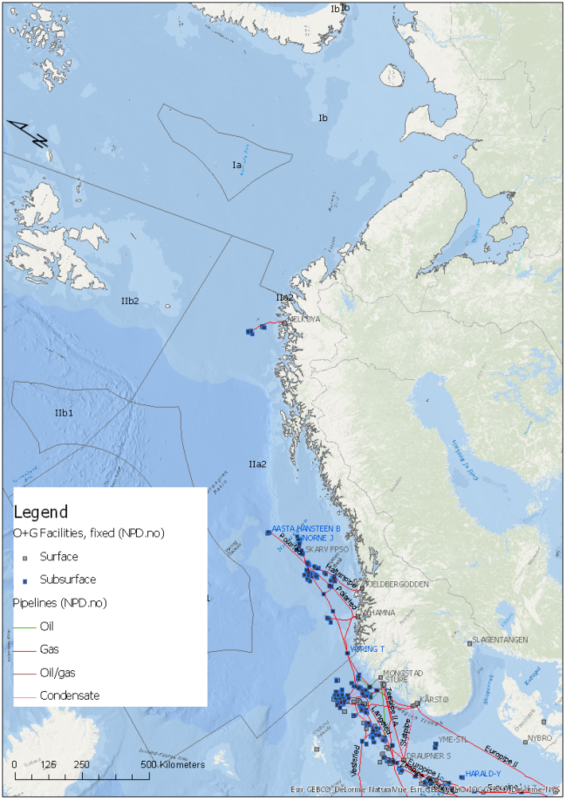
Figure 5: Map showing the available information on oil and gas facilities in the Norwegian Sea and Barents Sea and surround areas.
The Arctic Checkpoint – Wind Farm Siting project derived its data sets predominantly from sources outside EMODnet. This is mostly due to the fact that the study area is located outside the focal area of EMODnet, and is therefore not covered. This situation may change in the future as the Arctic has been recognised as an area where more attention from the European Union, and therefore also from EMODnet, is warranted. The main dataset for this challenge, the wind resource, was available from Copernicus and thus from an EU-related source.
Two ecosystem-related data layers that were included in the plans could not be included. No data sets were found that could be used as a reliable basis for 1) bird migration routes and 2) sea mammal migration routes. This should be labelled as an identified data gap. It is however not necessarily a data gap that is specific to the Arctic. Such maps/data sets are also not be available for e.g. the North Sea.
The data sets that were used are available on the internet, but these should be easier to find and more readily available. Discoverability is often low.
Lessons learned
The final results suggest that with the available data an adequate assessment can be made on the potential development of offshore wind parks in the Norwegian Sea and Barents Sea.
Offshore development of wind energy in this region will have to rely on floating turbine technology. This technology may need several more years to mature sufficiently before successful deployment in Arctic and sub-Arctic waters. For an in-depth assessment of the economics of an offshore wind farm, specific information will be needed regarding the technology used for determining moorings and assessing geophysical conditions on and in the seabed.
Recommendations
For the next round of assessments, a smaller and more detailed block size for the OWE-analysis could be used. This could result in less area being excluded due to other users and/or ecosystem concerns. The wind resource data, at a resolution of 0.25 degrees, was not detailed enough to more precisely define geographical boundaries for development. However as this resource is mostly changing gradually in a repeated assessment a smaller block size can be used.
Now that the three most promising areas are identified, the possibility exists that more suitable data sets can be found. Data sets that do not cover all of the original study areas, but do cover at least one or two areas can be used, although preferably all three areas would be included in one dataset.
References and Links:
- Access D4.21 Report on fixed as well as floating offshore structure concepts
- Benjamin Halpern, Melanie Frazier, John Potapenko, Kenneth Casey, Kellee Koenig, Catherine Longo, Julia Lowndes, Cotton Rockwood, Elizabeth Selig, Kimberly Selkoe, and Shaun Walbridge. 2015. Cumulative human impacts: raw stressor data (2008 and 2013). KNB Data Repository. doi:10.5063/F1S180FS.
- COPERNICUS MEMS – Global Ocean Wind Observations Climatology Reprocessed (monthly means) (2007-2012)
- GEBCO 2014 gridded bathymetry
- ICES WG on Spatial Fisheries Data