
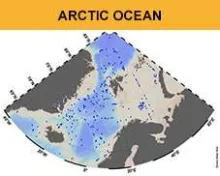
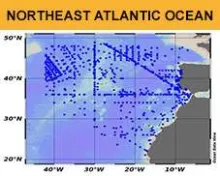
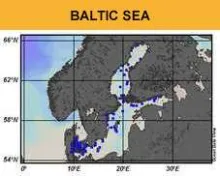
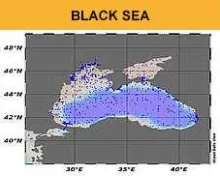
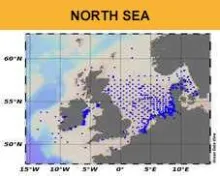
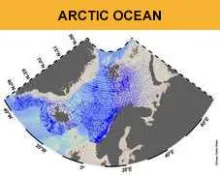
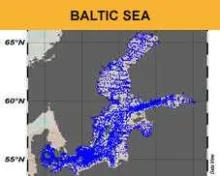
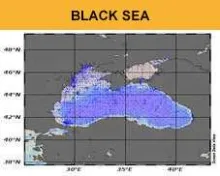
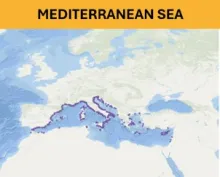
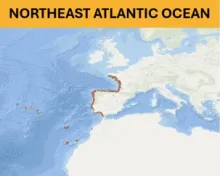
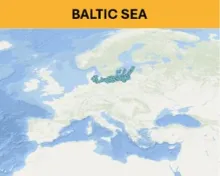
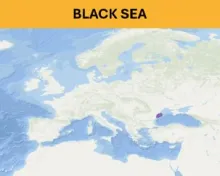
Hydrocarbons: Anthracene concentration (median values) in water, sediment and biota
EMODnet Chemistry provides easy access to marine chemical data, standardised, harmonised and validated data collections and data products for visualisation. These are relevant for the European marine environmental policies to assess the status and trends of ecosystems.
Numerous substances are considered, most of which are invisible to the naked eye and are monitored using specialised sensors or laboratory analyses. This evidence-based information supports action against environmental changes that pose a threat to marine ecosystems and human health.
Objectives
The first goal of EMODnet Chemistry is to collect and validate data on the state of the seas and oceans and make them freely available and interoperable. To this end, the partnership needs to manage the heterogeneity, complexity, quality and large volume of observational datasets on seawater quality, biota contamination, sediment quality and potential pollution.
Second, EMODnet Chemistry generates and publishes standardised, harmonised and quality-controlled data collections and reliable derived data products. These are all relevant for the implementation of European Union (EU) marine policies such as the Marine Strategy Framework Directive (MSFD), Water Framework Directive, and Maritime Spatial Planning Directive. Specifically, EMODnet Chemistry contributes to Descriptors 5 (eutrophication), 8 (chemical pollution), 9 (contaminants in seafood) and 10 (marine litter) of the MSFD, as testified by a number of Use Cases.
MSFD Directive
The MSFD was adopted by the EU in 2008. The objectives are to achieve Good Environmental Status (GES) of EU marine waters by 2020 and to protect the resource base on which marine-related economic and social activities depend.
The MSFD is a cyclical process including different phases, as follows:
- Initial assessment of the environmental status, impacts, and socioeconomic analysis of human activities;
- Determination of GES;
- Establishment of targets and associated criteria and indicators;
- Establishment of a monitoring programme;
- Development of a programme of measures to achieve or maintain GES.
The MSFD criteria and indicators are defined on the basis of 11 qualitative descriptors relating to: 1. biodiversity, 2. non-indigenous species, 3. commercially exploited fish and shellfish populations, 4. elements of the marine food web, 5. eutrophication, 6. seabed integrity, 7. alteration of hydrographic conditions, 8. contaminant concentrations, 9. contaminants in fish/seafood for human consumption, 10. marine litter, and 11. energy inputs including underwater noise.
The MSFD identifies different European marine regions and sub-regions according to their geographical and ecological characteristics to support the development of marine strategies, as shown in the figure below.
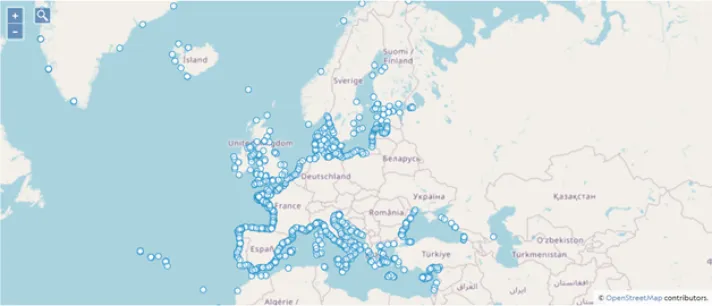
EMODnet Chemistry data harvesting covers an extensive geographical marine area, including all MSFD regions and subregions (see figure below).
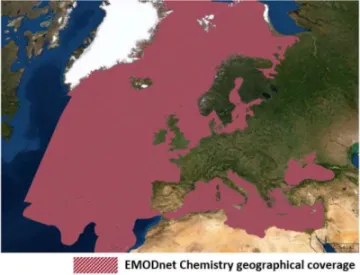
EMODnet Chemistry's geographical coverage

MSFD - European marine regions and sub-regions (Source : EEA - Delineation of the MSFD Article 4 marine regions and subregions ( Version of 16th May 2017 )
EMODnet Chemistry focuses on four main themes:
- Eutrophication;
- Ocean acidification;
- Contaminants;
- Marine litter.
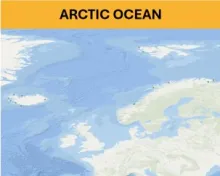
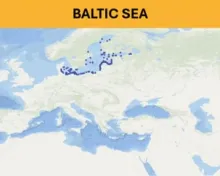
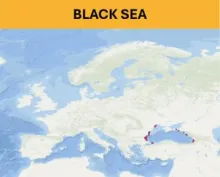
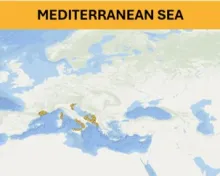
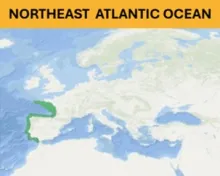
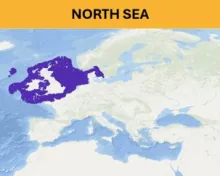
Currently, six major European sea regions are covered: the Arctic Ocean (Norwegian Sea including Barents Sea), Baltic Sea, Northeast Atlantic Ocean (Celtic Sea, Iberian coast and Bay of Biscay, and Macaronesia), North Sea, Black Sea, and Mediterranean Sea.
For more information, users can see the relevant Documentation, including:
- Guidelines that includes technical documents, such as specifications and user manuals, which explain in detail the EMODnet Chemistry activity;
- Reports to EU that includes all documents, describing the EMODnet Chemistry work, which are periodically delivered to the EMODnet Secretariat and DG MARE;
Information can also be found in News, Events and Communication material, including a Promotional Video.
Key services
A range of services and functionalities are provided to users for i) identifying and requesting access to the chemistry datasets that are gathered by EMODnet Chemistry, and ii) viewing, analysing, and downloading chemistry data products that are generated by EMODnet Chemistry:
- Data Discovery and Access Service is the interface of SeaDataNet to search for, narrow down queries, and download selections of measurement data.
Chemistry CDI Discovery and Access service
The Chemistry CDI Data Discovery and Access Service is managed by SeaDataNet and provides users with highly detailed insight into the availability and geographical distribution of chemistry in situ data (concerning eutrophication, contamination, marine pollution, and acidification), acquired and managed by a growing group of national data centres and data providers from research institutes, monitoring agencies, private companies and civil society. It also provides a unified user interface for requesting access and downloading individual datasets. The CDI metadata are in the public domain and freely browsable for all users. Most of these chemical observation datasets can also be downloaded freely; however, there are also datasets which are restricted and require obtaining permission from the owners. Anyway, requests for downloading are arranged through a shopping mechanism, which requires initial registration to the SeaDataNet Marine-ID service. For detailed information on how it works, see the user manual
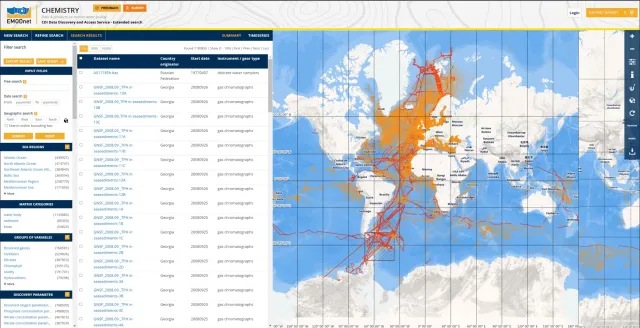
EMODnet Chemistry CDI Data and Discovery Access Service (SeaDataNet service)
- ERDDAP™allows users to download harmonised and validated datasets regarding EMODnet Chemistry thematic parameters: eutrophication, contaminants and marine litter.
ERDDAP Data Access Service
The Environmental Research Division Data Access Programme (ERDDAP™) was first developed and used by the National Oceanic and Atmospheric Administration (NOAA) for visualisation and data conversion tools that allow multiple data subsets from different sources to be merged into a single workspace. ERDDAP is widely used in the geoscience community, and from 2023 EMODnet thematic areas offer some ERDDAP services.The EMODnet Chemistry datasets on ERDDAP are from the data collections of aggregated, harmonised and validated datasets. These are regularly compiled based on unrestricted measurement data from hundreds of data originators.
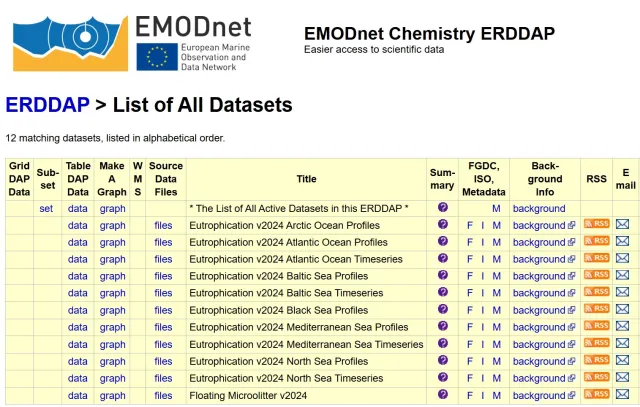
EMODnet Chemistry data collections at erddap.emodnet-chemistry.eu
- Products Catalogue service provides functionality to search and browse metadata of chemistry data products and includes links to viewing and download.
- webODV Data Explorer and Extractor allows users to create subsets, perform scientific analyses, generate various graphs, and download datasets in various formats from the validated aggregated data collections of EMODnet Chemistry.
webODV data explorer and extractor
The webODV data Explorer and Extractor tool is developed and managed by the Alfred Wegener Institute (Bremerhaven, Germany) for EMODnet Chemistry. This service is constantly being extended to facilitate the exploration, subsetting, visualisation and extraction of datasets in different formats from the EMODnet validated and aggregated Chemistry data collections for eutrophication and contaminants. These collections are generated by the Regional Coordinators of EMODnet Chemistry, by harmonisation, standardisation and quality control of selections of data sets as provided by multiple data centres and as retrieved from the CDI Data Discovery and Access Service. EMODnet Chemistry compiles and publishes such data products regularly for all European sea basins. In addition, the Consortium uses these high-quality data products to produce maps, while the webODV service allows users to perform in-depth scientific analyses, and to prepare extracts and all kinds of visualisations, which can be used for instance for scientific papers and analytical documents and presentations. For detailed information on how it works, see the user manual
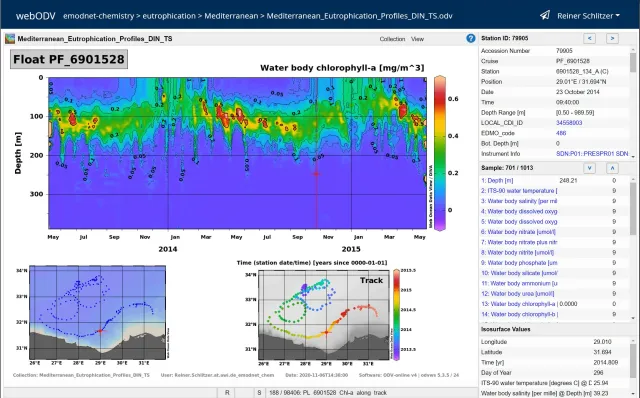
EMODnet Chemistry webODV data Explorer and Extractor tool: Float Chlorophyll plot.
- Marine litter tools are also available to view the distribution of beaches contained in the EMODnet Chemistry beach litter database, to generate EMODnet data formats for beach and seafloor litter, and to verify correctness.
- Map Viewer service allows users to view, browse, and interrogate EMODnet Chemistry data and data products.
Board of experts on the MSFD
EMODnet Chemistry has interacted with the stakeholders involved in the Regional Seas Conventions and the Marine Strategy Framework Directive (MSFD) since its launch in 2009. In 2017, EMODnet Chemistry formalised this outreach activity with the establishment of the Board of experts on the MSFD. The role of the panel is to advise the consortium on the scope and definition of products and services from the perspective of the MSFD. The Board comprises over 50 participants from around 28 international research institutions, non-governmental organisations and regional, national and European government agencies. The experts are usually involved in three online meetings totalling 4.5 hours during the two-year life cycle of each project phase. Check the upcoming meetings.
Have a say by joining the Board of experts! To do so, please send an email with the subject “Chemistry MSFD Board of experts” to info@emodnet-chemistry.eu and include your name, affiliation, email address and areas of thematic and geographic interest.
Board of Experts on MSFD
Decisions, such as the choice of parameters, spatial and temporal resolution of the data products, take the feedback of this panel into account. Consultation with the experts enables the partnership to harmonise and refine any new development with the requirements of the MSFD for descriptors D5 (eutrophication), D8 (contaminants) and D10 (marine litter).
The International Council for the Exploration of the Sea (ICES) is the EMODnet Chemistry partner maintaining the regular exchange and dialogue with the board. This activity is part of ICES' commitment to reach and interact with EMODnet Chemistry's key stakeholders to ensure the inclusion of Regional Seas Conventions and to contribute to the implementation of EU legislation and wider open data initiatives.
Remote workshops focus on different thematics, i.e. eutrophication, ocean acidification, contaminants and marine litter. During these meetings EMODnet Chemistry informs the board of new developments and receives critical input to improve products for the MSFD and regional seas use cases targeted by the experts. Over the years, these meetings have contributed significantly to better mutual understanding and constructive cooperation.
Reports summarising the online workshops are regularly produced and published on the EMODnet Portal. These meetings and the accompanying documentation are the project deliverables related to the Uptake, Outreach and Interaction work package. These reports are used as input for the EMODnet Chemistry steering meeting to discuss necessary adjustments with other work package leaders.
For further information, please send an email with the subject “Chemistry MSFD Board of experts” to info@emodnet-chemistry.eu.
Data & Products
EMODnet Chemistry draws on the extensive experience of a well-developed and ever-increasing network of 66 data centres in 32 countries, which collect and manage marine chemical data according to the FAIR principles (i.e. Findability, Accessibility, Interoperability and Reusability).
In the fifteen years, the Partnership has gathered over 1 million measurement data from more than 500 different data originators, mainly monitoring authorities and research institutes but also NGOs and enterprises.
The measurement data, as delivered by the originators, cover 13 groups of chemical variables within all European sea regions as shown in the matrix of Chemical per region.
Visit the matrix of all Chemicals per region
In addition, EMODnet Chemistry regularly releases aggregated, standardised, and validated data, which are made available as data collections on eutrophication, ocean acidification and contaminants including marine litter, via the Product Catalogue Service and ERDDAP data access service
EMODnet Chemistry's data collections of eutrophication, ocean acidification, contaminants and marine litter


Lastly, data collections are input to generate further data products.
Users are requested to acknowledge EMODnet and its data providers when using data or products based on its services.
Eutrophication
For Eutrophication, gridded climatologies are generated from the validated data collections. These products are spatially interpolated maps that display the depth variability of five parameters over time:
- Dissolved inorganic nitrogen (DIN) concentration;
- Phosphate concentration;
- Silicate concentration;
- Chlorophyll-a concentration;
- Dissolved oxygen concentration.
Three main types of climatologies with different spatio-temporal resolutions can be downloaded:
- All European seas;
- By sea region;
- Coastal areas.
In addition some examples of visualisations that users can create through the webODV Explorer and Extractor tool from the EMODnet Chemistry data collections on eutrophication are available on the Map Viewer.
Eutrophication maps
All European seas maps are monthly climatologies built by combining available data for all EU marine basins. All maps can be customised selecting both depth and time ranges. An animation of the temporal evolution of the parameters is also available. Their main features are listed below:
- Temporal coverage: 1960–2020;
- Temporal resolution: monthly;
- Spatial resolution: 0.25 degree;
- Depth coverage: 0–5500 m;
- Depth levels: 102;
- Tool: DIVAnd;
- Unit: mg/m3 or umol/l.
Maps by sea region are seasonal climatologies built by combining data per sea region as 6-year running averages.
For the Arctic Ocean, Baltic Sea, Black Sea, and North Sea, the seasons are:
- Winter: Dec–Feb
- Spring: Mar–May
- Summer: Jun–Aug
- Autumn: Sep–Nov
For the Mediterranean Sea and NE Atlantic Ocean, the seasons are:
- Winter: Jan–Mar
- Spring: Apr–Jun
- Summer: Jul–Sep
- Autumn: Oct–Dec
Their main features are listed below:
- Temporal coverage: From 1960’/90’ (depending on the parameter and region) to 2021;
- Temporal resolution: seasonal;
- Spatial resolution: 0.1 degrees (varies slightly among regions);
- Depth coverage: Varies widely among regions (minimum 0–200 m in the Black Sea; maximum 0–3000 m in the NE Atlantic);
- Vertical resolution: finer near the surface;
- Tool: DIVAnd;
- Unit: mg/m3 or umol/l.
Maps for coastal areas are seasonal climatologies and are built by combining data of specific coastal areas: the Gulf of Riga (Baltic Sea), Danube Delta (Black Sea), Loire River (NE Atlantic Ocean), and Po River (Mediterranean Sea). The seasons are the same as those for the maps by sea region. Their main features are listed below:
- Temporal coverage: dependent on data availability and varies with region and between parameters;
- Temporal resolution: seasonal;
- Spatial resolution: 0.01 degrees;
- Depth coverage: dependent on data availability and varies with regions and parameters;
- Tool: DIVAnd;
- Unit: mg/m3 or umol/l.
The eutrophication maps (depth and density layers) are examples of visualisations that users can create with webODV Explorer and Extractor tool from the EMODnet Chemistry data collections on eutrophication and contaminants.
The titles of the maps are:
• Depth [m] of the sigma-0=27.75 isopycnal
• Oxygen [umol/l] at Depth 20 m
• Oxygen [umol/l] on the sigma-0=27.75 isopycnal
• Phosphate [umol/l] at Depth 20 m
• Phosphate [umol/l] on the sigma-0=27.75 isopycnal
Contaminants
For Contaminants, twenty-five new maps on pollutants are generated from the validated data collections. The maps were produced for the following 12 pollutants in seawater, sediment, and biota:
- Antifoulants - Tributyltin, Triphenyltin;
- Heavy metals - Cadmium, Lead, Mercury, Nickel;
- Hydrocarbons - Anthracene, Benzo(A)Pyrene, Fluoranthene, Naphthalene;
- Pesticides and biocides - DDT-DDE-DDD, and Hexachlorobenzene.
The products are divided into 3 categories that provide information on the distribution of sampling stations and concentration levels in space and time in all European seas and beyond for the parameters prioritised in the Marine Strategy Framework Directive.
The categories are:
- Concentration values;
- Measurements counts;
- Monitored matrices.
Contaminants maps
The category “Concentration values” contains the maps that show for each parameter the concentration of the pollutant that has been measured per matrix. The concentration is expressed as median value of the last 6 available years. The medium values are calculated using data included in EMODnet validated datasets and quality flagged as "good data". For water, surface values are used (0-15 m), for sediment and biota data at all depths are used. For all parameters the units are: ug/l for water, and ug/kg for biota, and sediment.
The category “Measurements counts” contains the maps that show the number of available measurements per parameter and per matrix in the different stations for all available years and per year.
The category “Monitored matrices” shows symbolised positions for each matrix for all available pollutant measurements in the validated EMODnet datasets.
Marine Litter
EMODnet Chemistry developed and manages the first pan-European Marine Litter Database (MLDB) on the advice of the MSFD Technical Group on Marine Litter and in close cooperation with relevant stakeholders in the EU, such as the European Commission’s Joint Research Centre, the Regional Sea Conventions and the International Council for the Exploration of the Sea. The EMODnet Chemistry Marine Litter Database is a major milestone in the harmonisation of available information at the European level, supporting the establishment of European baselines and threshold values for the MSFD.
How to submit data
Please check out the Marine litter data-flow (see the collapsible boxes below): a step-by-step scheme on how to share marine litter data using fit-for-purpose guidelines, tools, and software.
Beach Litter Data-Flow
- Format Data
- Use the guidelines and forms for gathering marine litter data;
- Use Marine Litter Manager tool to format beach litter data;
- See Beach litter vocabularies and SeaDataNet Common vocabularies terms to describe beach litter data;
- Visualize the Beaches map to check where the beaches included in the EMODnet database are located;
- Download some Example files
- Validate Data
Use the EMODnet Beach Litter Format Validator to validate data. - Send Data
Send the data to info@emodnet-chemistry.eu
Sea Floor Litter Data-Flow
- Format Data
- Use the guidelines and forms for gathering marine litter data;
- Use Marine Litter Manager tool to format data;
- See ICES vocabularies and to describes Sea Floor litter data;
- Download some Example files
- Validate Data
Use EMODnet SeaFloor Format Validator to validate data. - Send Data
Send the data to info@emodnet-chemistry.eu
Floating and Sediment Micro-litter Data
- Format Data
- Use the Proposal for gathering and managing data sets on marine micro-litter ;
- Use to format data (ODV micro-litter format);
- Use to generate metadata file (CDI);
- Download some example files (floating and sediment).
- Validate Data
Use OCTOPUS software to validate data. - Submit metadata
Populate your CDI metadata and Micro Litter data sets into the SeaDataNet CDI Data Discovery and Access service.
Tools & Vocabularies
To facilitate the submission of marine litter data in a standardised way, EMODnet Chemistry has developed specific tools to format, and validate marine litter data.
Tools & Vocabularies
Marine Litter Manager
The Marine Litter Manager generates EMODnet beach and seafloor data formats. The software is downloadable on GitHub, where the user manual and dedicated videotutorials are also available.
Marine Litter Manager - GitHub Code (GitHub - CC0-1.0 License)-
EMODnet Beach Litter Format Validator
Once the beach litter data are formatted according to the official specifications , data providers can use the Beach Litter Format Validator to verify the correctness and approve EMODnet beach litter files. The tool has been successfully tested with Chrome, Firefox and Edge web browsers.
Seafloor Litter Format Validator
Once the seafloor litter data are formatted according to the official specifications , data providers can use the Seafloor Litter Format Validator to verify the correctness and approve EMODnet seafloor litter files. The tool has been successfully tested with Chrome, Firefox and Edge web browsers.
Beach litter vocabularies
The Beach litter vocabularies list all terms used to describe beach litter data in EMODnet format. This online service allows the user to have an up-to-date database of beach litter vocabularies, which is essential for the interoperability of the data.
Beaches map
Beaches map is a dynamic visualisation of the distribution of beaches (and their codes) contained in the EMODnet Chemistry beach litter database. These beaches have been surveyed either for litter monitoring, cleaning or research. This tool helps to avoid duplicates when recording beach litter data.
Marine Litter: beaches locations
ICES vocabularies
ICES vocabularies include all the terms used to describe seafloor litter data in the EMODnet format.
NEMO & MIKADO
NEMO and MIKADO tools enable data centres to format data and metadata files, respectively.
SeaDataNet vocabularies
SeaDataNet Common vocabularies terms include all the terms used to describe microlitter data in the EMODnet format.
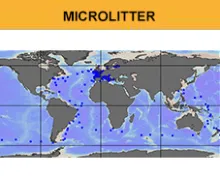
For marine litter, the maps show the spatial distribution and abundance of marine litter items of different sizes.
Three macro-categories of maps are produced:
● Beach litter;
● Microlitter;
● Seafloor.
The products for beach and micro litter are divided into two sub-categories depending on the origin of the data. In particular, the maps in the ‘official monitoring’ category are based on data considered for official assessment and analysis in relation to the MSFD, while the maps in the ‘other sources’ category are based on data from monitoring, cleaning and research activities.
Marine litter maps
Regarding beach litter, the different data products provide information on
- Beach locations and reference list used;
- Number of surveys and temporal coverage per beach;
- Composition of litter per beach per year;
- Abundance of litter over a given period per beach;
- Abundance of key categorised items per 100m per survey.
Regarding microlitter, the different data products provide information on
- Net location and mesh size used;
- Microlitter density per net;
- Size, and type of litter per net;
- Spatial distribution of litter density.
Regarding seafloor litter, the different data products provide information on
- Composition of litter according to material categories in percent per trawl;
- Density per trawl;
- Fishing related items density;
- Plastic bags density;
- Spatial distribution of fishing related items density;
- Spatial distribution of litter density;
- Spatial distribution of plastic bags density;
- Trawls locations.
Background
EMODnet Chemistry is managed by a Consortium: a network of marine research and monitoring institutes, oceanographic data management experts as well as the International Council for the Exploration of the Sea (ICES). The Consortium is also supported by the expertise of the Regional Sea Conventions: OSPAR, HELCOM, BSC, and UNEP/MAP.
EMODnet Chemistry is largely based upon the SeaDataNet network of 110 National Oceanographic Data Centres: an operationally robust pan-European infrastructure for ocean and marine data management. Moreover, EMODnet Chemistry relies on and has adapted the following consolidated SeaDataNet services and standards.
SeaDataNet services and standards
- Metadata Catalogues, provided through different services that give overviews of marine research in Europe; among them, projects, organisations, cruise summary reports, and data.
- Data Access, provided through the Common Data Index (CDI) service, is the reference interface for requesting and downloading datasets.
- Common Vocabulariesused in all metadatabases and data formats.
- Data Formats uused for delivering datasets.
- Data quality control by using common protocols and flag scales.
- Softwareto provide common tools for analysing and presenting data and data products.
Two different approaches are used to manage different types of data. Microlitter data as well as data on eutrophication, ocean acidification and pollutants are managed via the SeaDataNet (SDN) distributed data flow. SDN standards are adopted and adapted for this purpose.
Beach and seafloor litter data are stored in a single database via a centralised workflow managed by OGS in Italy (EMODnet Chemistry coordinator). This is the first and only marine litter database at European level, which supports the establishment of European baselines and threshold values for the MSFD. Specific standards consolidated at European level are used for these data.
Data gathering is conducted in direct communication with the data originators to ensure the best sets of measurement data and related metadata, and to prevent duplicates. Data originators are responsible for performing the first data quality control step and flagging with data quality information.
Furthermore, to collect and make accessible detailed information on sampling, analytical and QA/QC procedures, EMODnet Chemistry developed a standard template, based on practices already adopted by European and global frameworks, including the EEA, ICES, HELCOM, OSPAR, UNEP–MAP and NORMAN network. We also make available the guidelines for compiling the template/questionnaire ; as well as detailed information collected from data providers which is also accessible in the metadata.
As a further step, a Quality Control (QC) loop is implemented to harmonise, standardise, and validate data and metadata at the European scale for marine litter data and at the regional scale for eutrophication, ocean acidification, and contaminant data.
Data validation and integration
Data quality
The network of data centres engaged in EMODnet Chemistry gathers marine chemistry datasets, both from marine environmental monitoring and scientific research. The data gathering is done in direct communication with data originators to ensure the best sets of measurement data and related metadata, and to prevent duplicates. Data originators are responsible for the first quality control of data and flagging with quality information.
As further step, a Quality Control (QC) loop is implemented to harmonize, standardize and validate data and metadata at European scale for marine litter and at regional scale for eutrophication, ocean acidification and contaminants. Data are extracted from the network of data centers into global data collections. The QC loop implies multiple validation steps as shown below:
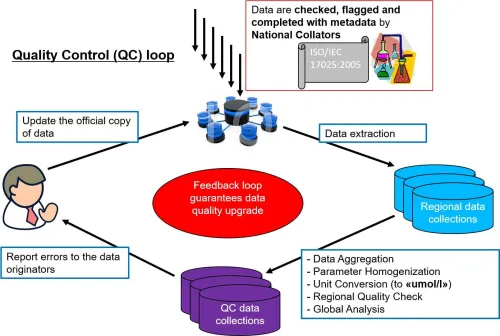
EMODnet Chemistry - Quality Control Loop
Data are aggregated by grouping different analytic terms used by data originators into a unique agreed term with a unique measurement unit (e.g. ml/l for oxygen, umol/l for nitrate), and further quality controls are performed at regional level following a common approach.
A set of quality controls (QC) are applied and the results are communicated to the data providers to correct errors or anomalies in the original data. This feedback loop guarantees consistency among comprehensive databases, which include data from different sources, periods and geographic areas.
For eutrophication, ocean acidification and contaminants, the original measurement datasets are automatically harvested in six different European regions: Arctic Ocean, Baltic Sea, North Sea, Northeast Atlantic Ocean, Black Sea, and Mediterranean Sea. Resulting collections are aggregated and quality controlled by using ODV Software and the methodology illustrated above.
Each regional data collection is accessible through a digital object identifier (DOI) and is described in the Catalogue service where users can also browse, search and download the related data products.
The National Institute for Ocean Science (IFREMER) is leader of the marine litter data collections, supported by the National Institute of Oceanography and Applied Geophysics (OGS).
The guidelines provide details of the up-to-date methods and technologies that are used to generate the data products for eutrophication, ocean acidification, contaminants and marine litter.
This approach is regularly tuned in collaboration with experts on implementation of the MSFD, including the Regional Sea Conventions (RSCs), European Environment Agency (EEA), European Commission's Directorate General for the Environment (DG ENV), and European Commission's Joint Research Centre (EC JRC).
History
EMODnet Chemistry was launched in 2009 and is based on a step-by-step approach. In 2021, participants signed up to the fifth phase, which runs until 2025.
The illustration below shows the duration and gives a short description of the 5 phases.
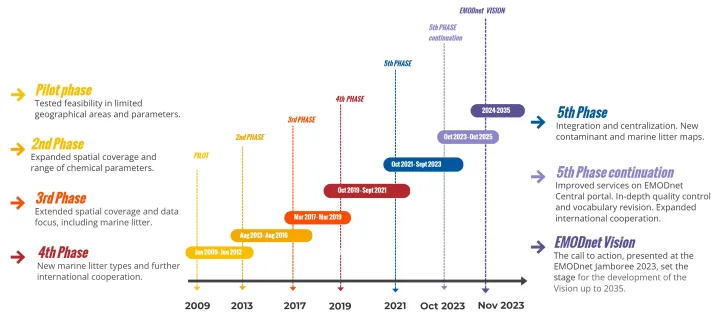
EMODnet Chemistry - Phases
- The pilot phase, from June 2009 to June 2012, was aimed at testing the project feasibility in limited geographical areas on a restricted number of parameters.
- The second phase, from August 2013 to August 2016, was aimed at expanding spatial coverage and range of chemical parameters.
- The third phase, from March 2017 to March 2019, was aimed at extending the data focus, including Marine Litter data and data products, and the spatial coverage.
- The fourth phase, from October 2019 to October 2021, was aimed at gathering and managing new marine litter types and increasing engagements and cooperations.
- The fifth phase, from October 2021 to October 2023, and its continuation from 3 October 2023 to 2 October 2025, is being led by the same core group of the Consortium steering the initiative since the beginning.
Detailed technical information on the various phases can be consulted from this document.
Communication
In this section you will find thematic-specific communication material, and a direct link to the video gallery.