In addition to the 25 maps published in 2023, new and updated maps for contaminants in water, biota and sediment have recently been made available in the EMODnet Map Viewer.
The maps were created for the following 12 contaminants in seawater, sediment, and biota: Tributyltin, Triphenyltin, Cadmium, Lead, Mercury, Nickel, Anthracene, Benzo(A)Pyrene, Fluoranthene, Naphthalene, DDT-DDE-DDD, and Hexachlorobenzene. All maps are produced by using the data included in the 2024 release of the aggregated, harmonised and validated data collections, which EMODnet Chemistry regularly produces for different groups of contaminants: heavy metals, pesticides and biocides, hydrocarbons, polychlorinated biphenyls, radionuclides and antifoulants. The data collections are available for each European sea basin and at pan-European level.
To better understand how you can get the most out of these products, let’s take a tour of the Map viewer!
In the Catalogue tab, select EMODnet Chemistry and Contaminants categories. You will find 4 map types.
The first is called “Concentration values” and contains the maps that show for each parameter the concentration of the contaminant that has been measured per matrix. The concentration is expressed as median values since 2012 and are calculated only using data included in EMODnet validated datasets and quality flagged as "good data". For water, only surface values are used (0-15 m), for sediment and biota data at all depths are used. In the Map Viewer the colour of the station indicates the percentile range in which the median value falls, as described in the legend in the menu on the left. For all parameters the units are: ug/l for water, and ug/kgr for biota, and sediment.
The second type of map is called “Contaminants in marine organisms”. The layers show - for each contaminant and for all available years - positions with percentages of all available data values per animal group (Figure 1).
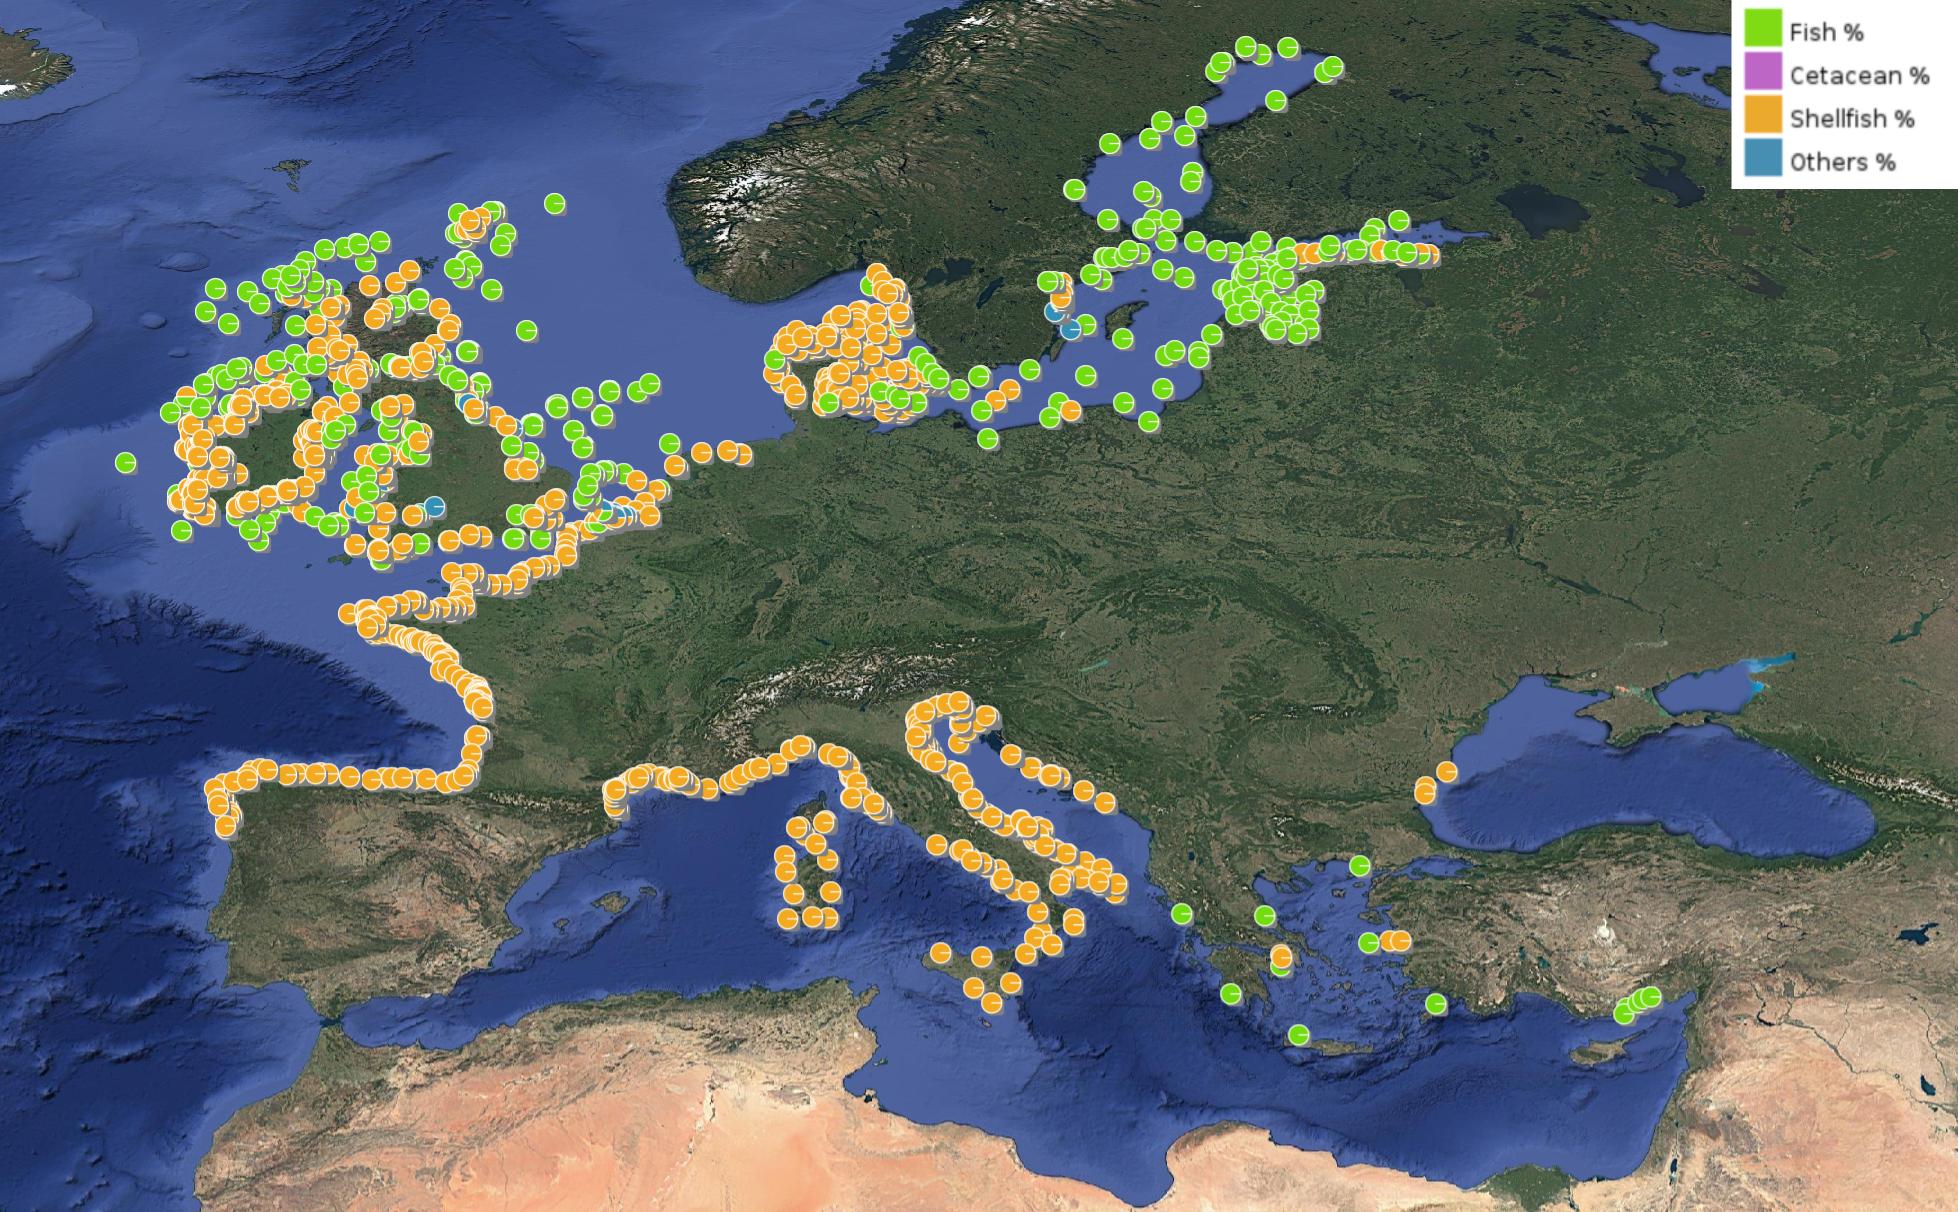
Figure 1. Map type “Contaminants in marine organisms” for cadmium included in the variable group “Heavy metals". ©EMODnet Chemistry
The third map type is called “Measurements counts” and contains the maps that show the number of available measurements per parameter and per matrix in the different stations for all available years and per year.
The fourth map type is called “Monitored matrices” and shows symbolised positions for each matrix for all available contaminant measurements in the validated EMODnet dataset.
If you click on the information button (“i”) next to each layer, you can access the metadata and download both the shape files and the European contaminants aggregated dataset (Figure 2). As shown in figure 3, metadata and data collections are also available via the EMODnet products Catalogue.
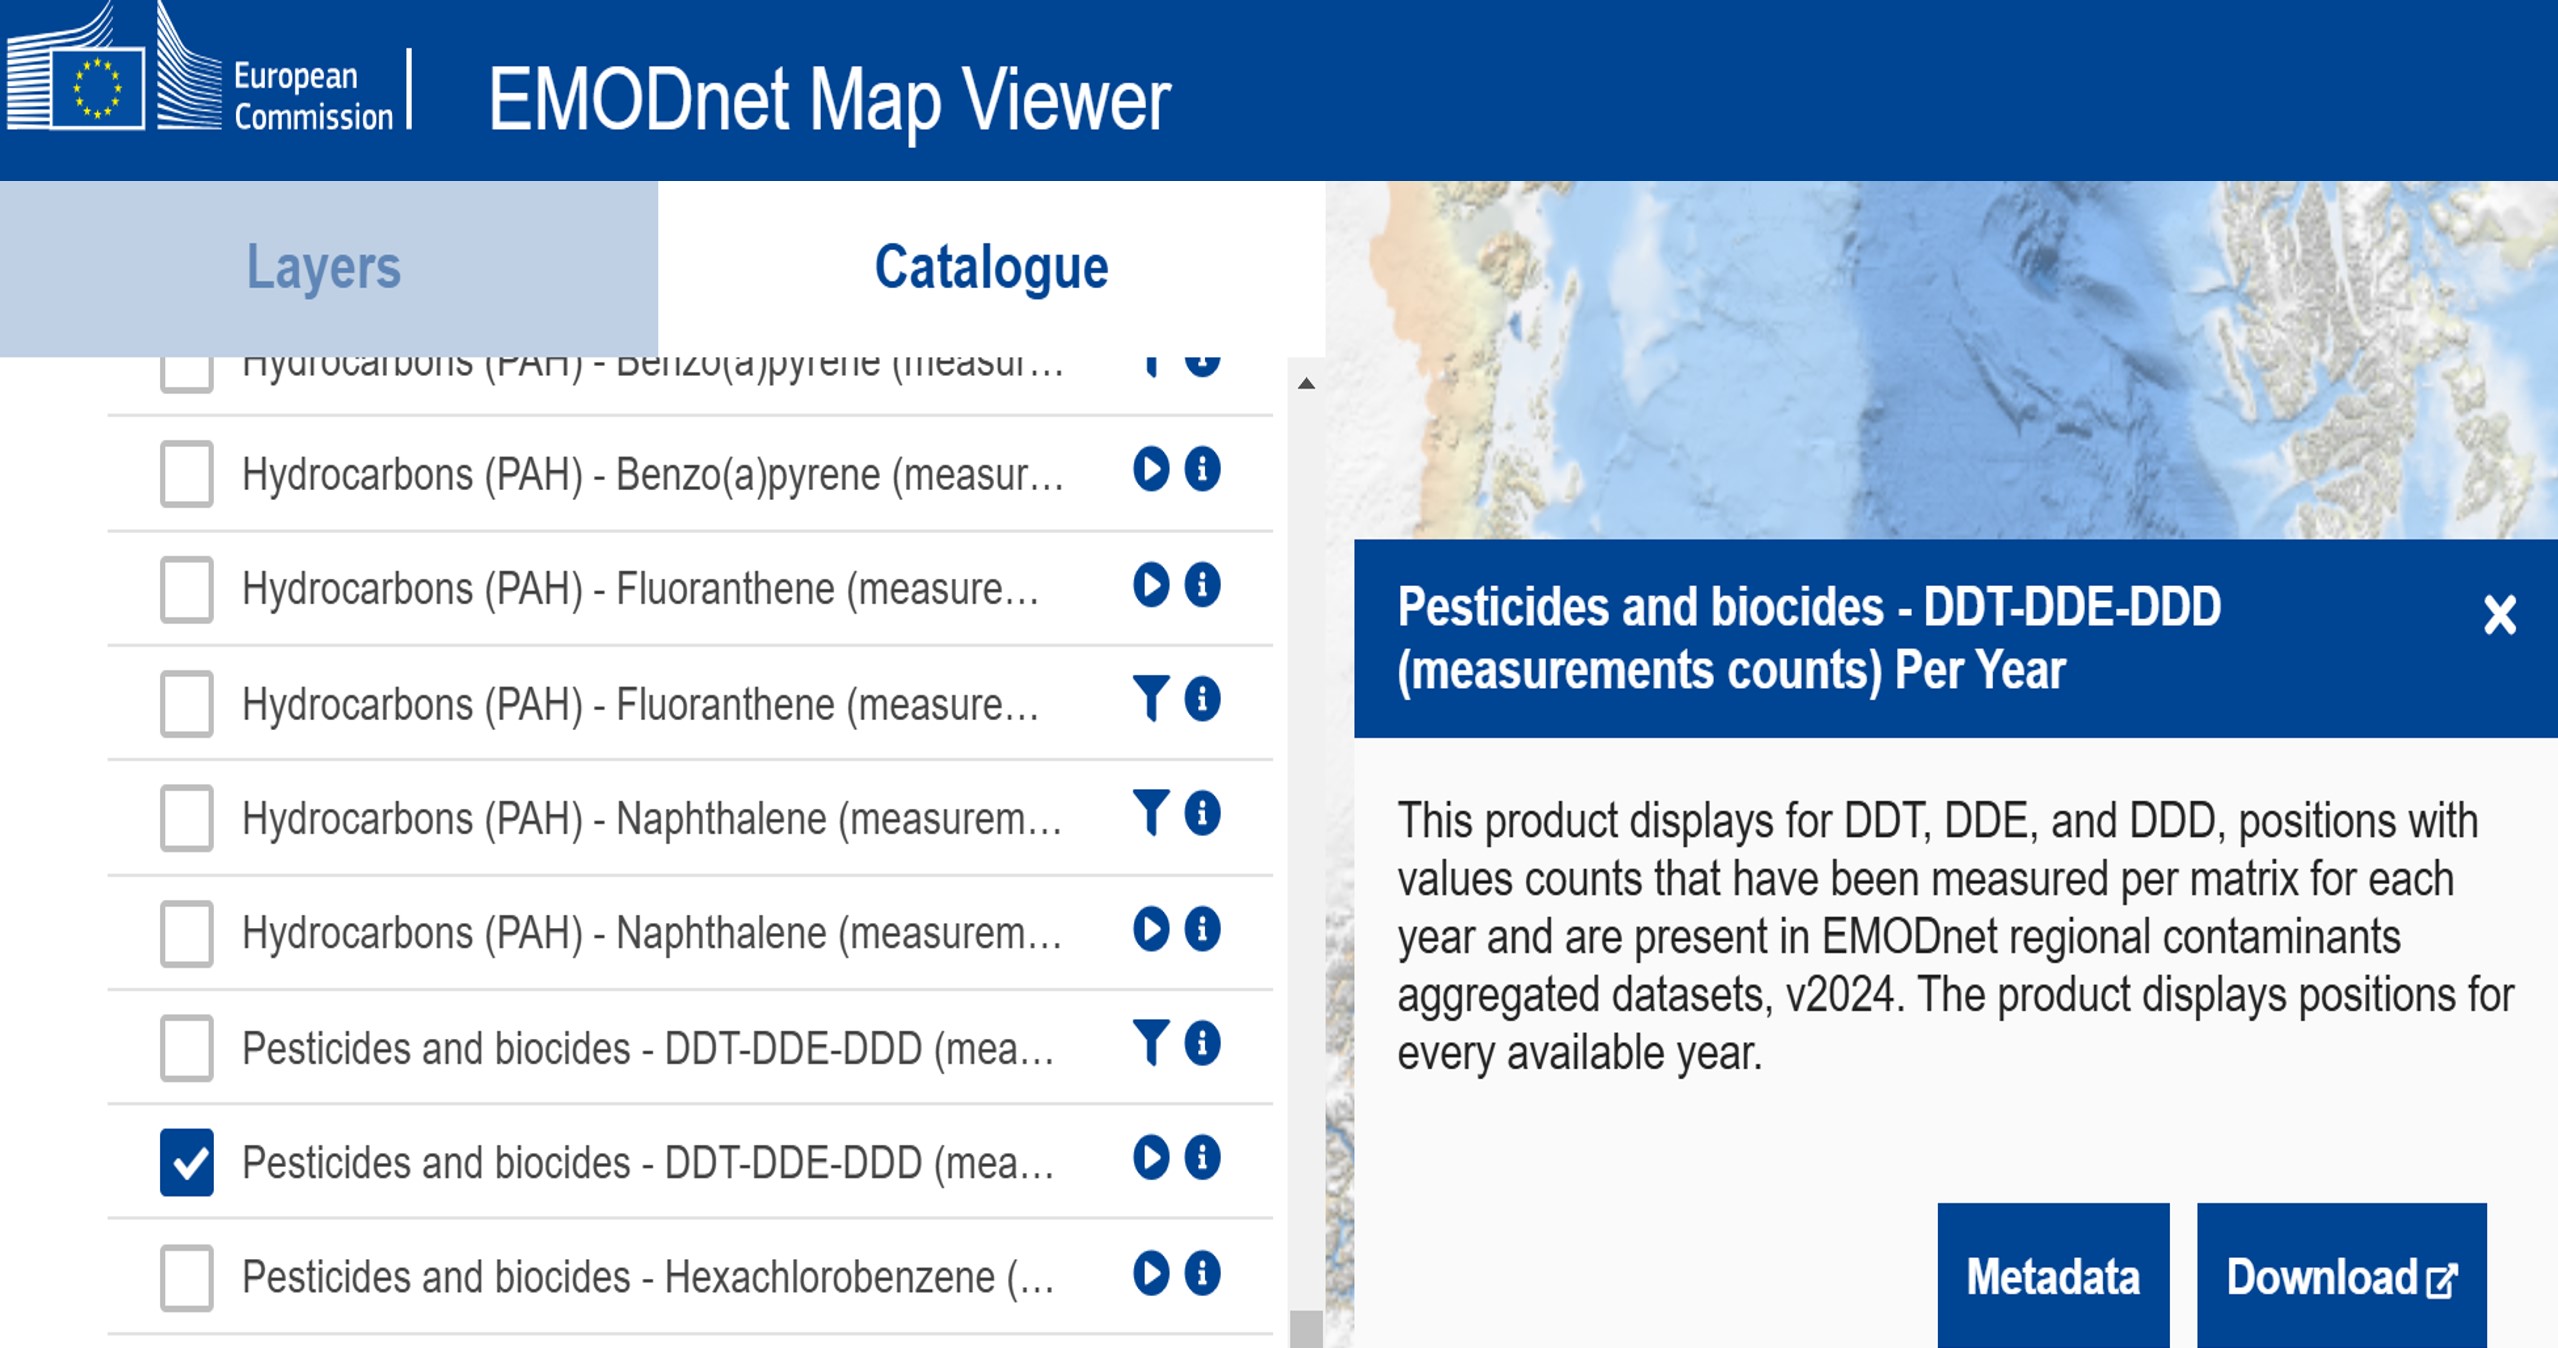
Figure 2. In the Map viewer, you can access the metadata via the information button (“i”), next to each layer, and download both the shape files and the European contaminants aggregated dataset. ©EMODnet Chemistry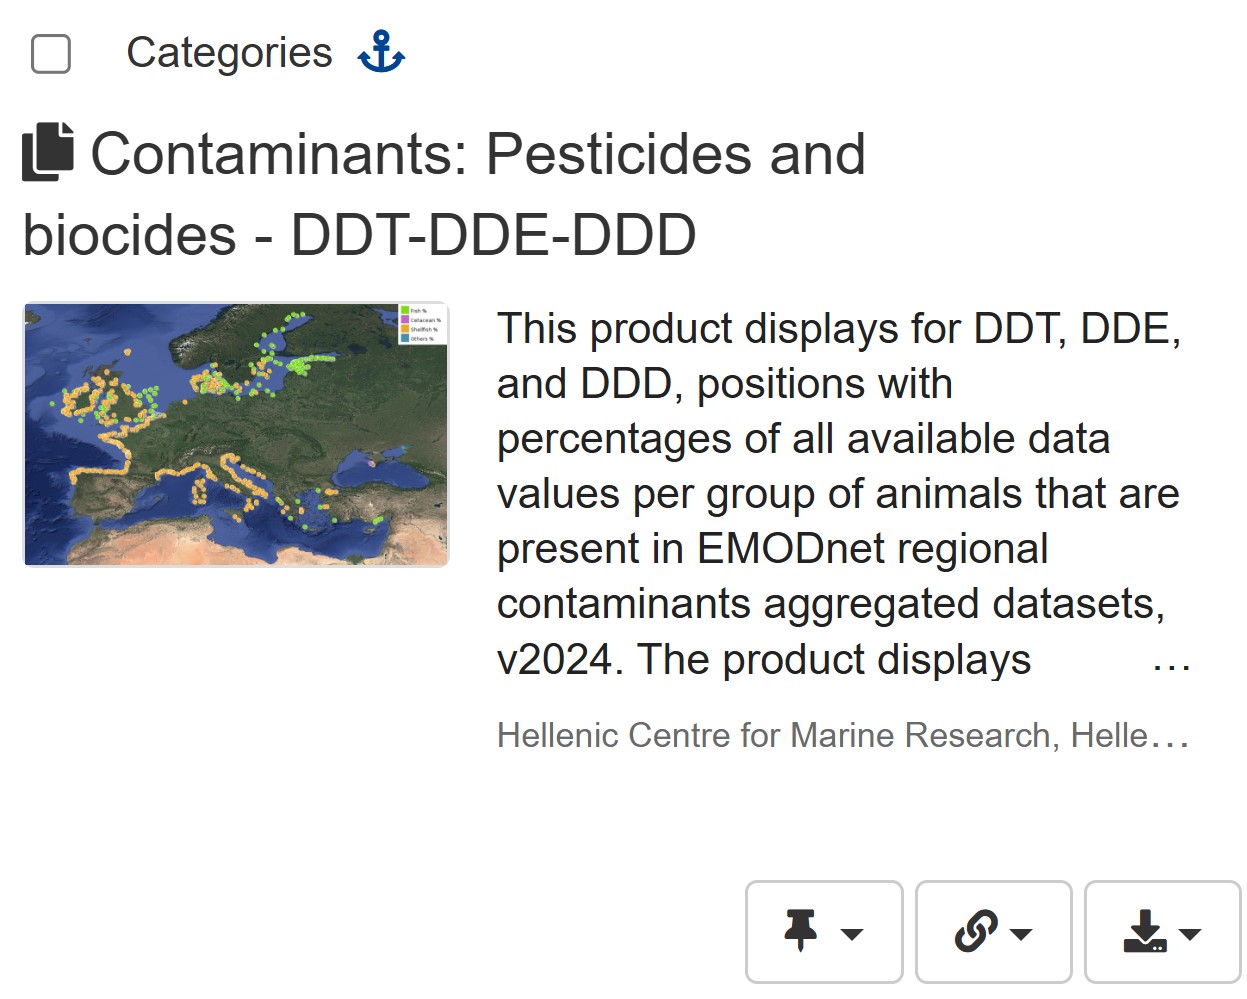
Figure 3. Users can access metadata and data collections at regional and European level via the EMODnet products Catalogue. ©EMODnet Chemistry
At this point, switch from the Catalogue to the Layers tab to view, filter, animate, enlarge and delete the layers using the specific buttons.
For map types 1, 3 and 4, you can filter the matrix you are interested in and retrieve the median concentration value for each position by clicking on it. For types 3 and 4, you can use the "Layer animation" function, symbolised by the arrow, to follow the development over the years.
Finally, if you want to explore the EMODnet Chemistry data collections in detail, extract data subsets and create your own maps and graphics, we recommend the EMODnet Chemistry webODV Explorer and Extractor Service, which is operated by the EMODnet Chemistry Consortium, in particular the Alfred Wegener Institute. To get more information on this service, read the EMODnet news at these links:
The first European validated data collection on eutrophication and acidity is online
Webinar showcasing EMODnet’s Chemistry offer for data exploration and extraction