
The aim of this challenge is to determine the likely trajectory of the slick resulting from a (simulated) leak at an oil platform and the likelihood that sensitive coastal habitats, species or tourist beaches are affected. Specifically it provides a preliminary assessment of the likely impact of the oil within 24 and 72 hours of the start of the challenge.
The challenge serves as a case study for the availability of data, the required response time for a preliminary (within 24 hrs) and a refined impact assessment (within 72 hours) and to aid in identifying possible data gaps. The European Commission ensures the participation of the European Maritime Safety Agency for this simulation.
The Challenge
On Tuesday, May 10, 2016 at 11:24 AM, an email was received from DG MARE: “At 8:15 CET this morning (10/05/2016), an accident took place during an inspection of the re-activated Brent Delta Platform in preparation of final decommissioning and dismantling. About 5000m3 of crude oil per day leaks from the platform at a depth of 70m in the water column. It is anticipated that the leak will be sealed after 48 hours with the notification that about 5000m3 of oil per day leaked from the Brent Delta Platform with an expected duration of 48 hours.”
Method and assumptions
The GNOME (General NOAA Operational Modelling Environment) model, developed by the Emergency Response Division of NOAA's Office of Response and Restoration, was used to predict the possible route, or trajectory, a pollutant might follow in or on a body of water, such as in an oil spill.
The following assumptions were required:
- The GNOME model can only model spills at the sea surface. The oil spilled is relatively light and will reach the surface rapidly.
- Brent Crude is a major trading classification of sweet light crude oil that serves as a major benchmark price for purchases of oil worldwide. This grade is described as light because of its relatively low density, and sweet because of its low sulphur content (circa 0.37%). GNOME can only simulate a few oil types. The “medium crude” oil as specified in the GNOME model was used in the challenge as this is the closest match to Brent Crude.
- In the model scenario it was assumed that the oil was released:
- at the sea surface instantaneously;
- at the start of the spill and;
- at the location of the platform.
Results on 11/05/2016 (after 24 hours)
The 24h report showed that at the end of the simulation (90 hours after the spill) 36% had evaporated and dispersed, and 64% was floating.
Based on this first preliminary assessment it is likely that:
- There was a threat to coastal habitat/species, according to the worst case scenario;
- There was no information available on tourist beaches, therefore it was unknown if there was a threat to tourist beaches;
- The following locations were threatened (indicated by the black crosses in the figure below):
- Platforms surrounding the spill site
- The Shetland Islands
- Norway, south of Bergen
- The Natura 2000 areas: Pobie Bank Reef; Hermanesss, Saxa vord and Valla Field; Keen of Hamar; Fetlar, North Fetlar; Yell Sound Coast; Noss; Mousa; Sumburgh Head.
- Potentially the nationally designated area Jærstrendene
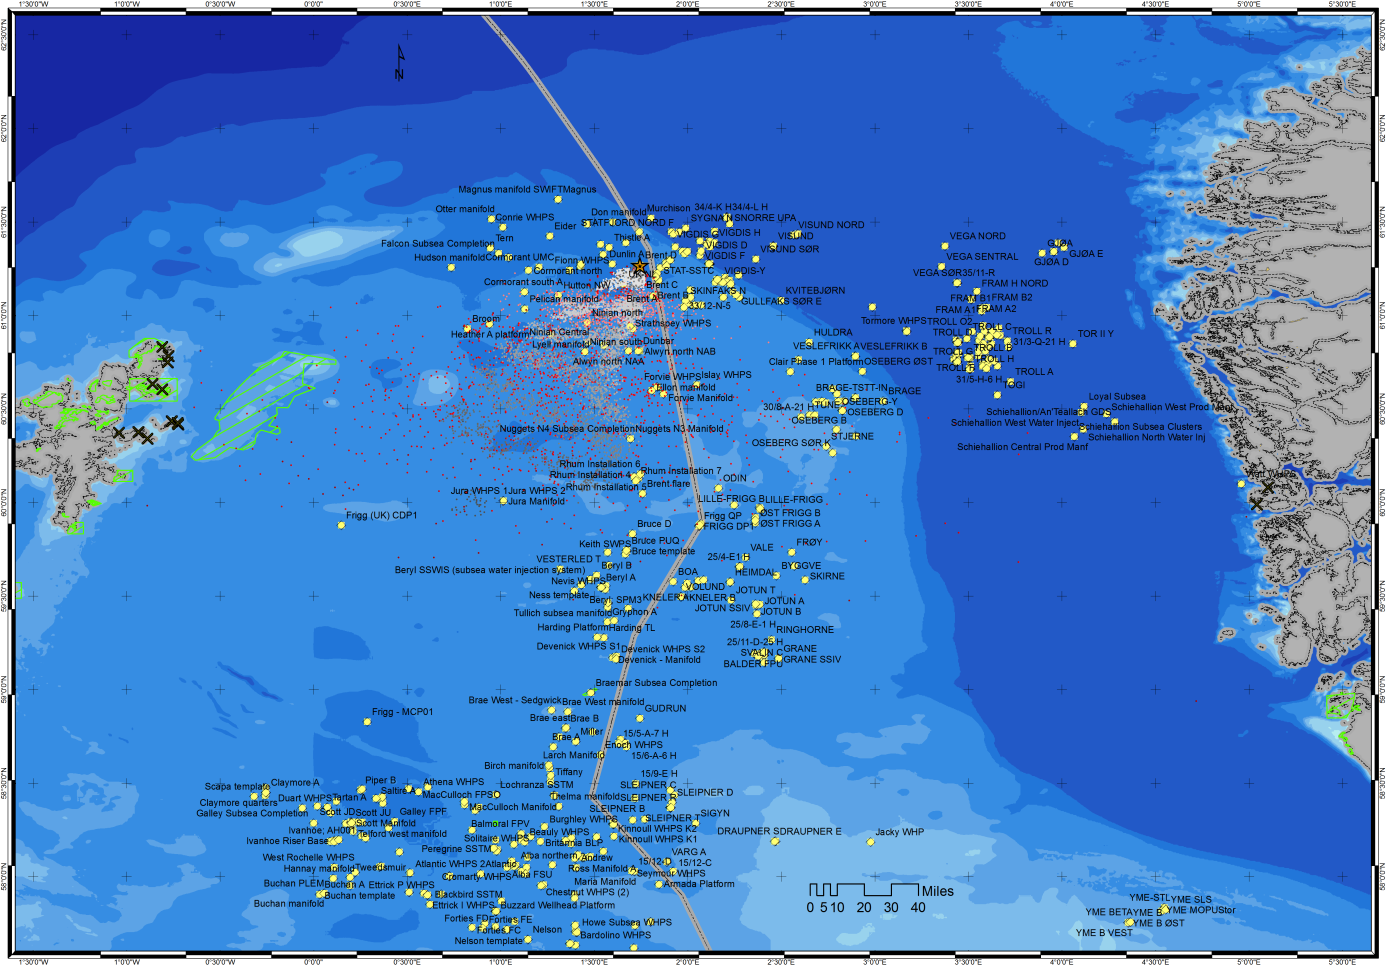
Figure 1 Overview of the impacted location after the Brent Delta spill according to the best guess, no regret simulation.
The following has been identified as a first/ indication of data gaps limiting the preliminary assessment:
- Tourist beaches
- Shipping lanes
These issues were addressed within the complete impact assessment and/or the main report.
Results on 13/05/2016 (after 72 hours)
Based on oil spill simulation modelling it is predicted that, 132 hours after the spill, 42% had evaporated and dispersed, and 58% remained floating on the sea. As a worst case, 4% (400 m3) of the total amount of spilled oil could beach, posing a threat to coastal habitat/species in the UK and Norway, as indicated by the black crosses on the coast lines (beached oil) in the figure below.
The main identified gaps, in the available data, limiting this refined assessment were:
- Tourist beaches (especially the locations of tourist beaches at the Shetlands);
- Shipping lanes;
- Fisheries activity on a time scale shorter than a whole year;
- Distribution data of birds and sea mammals, and possibly other biological distribution data.
These issues are addressed within the main data adequacy report.
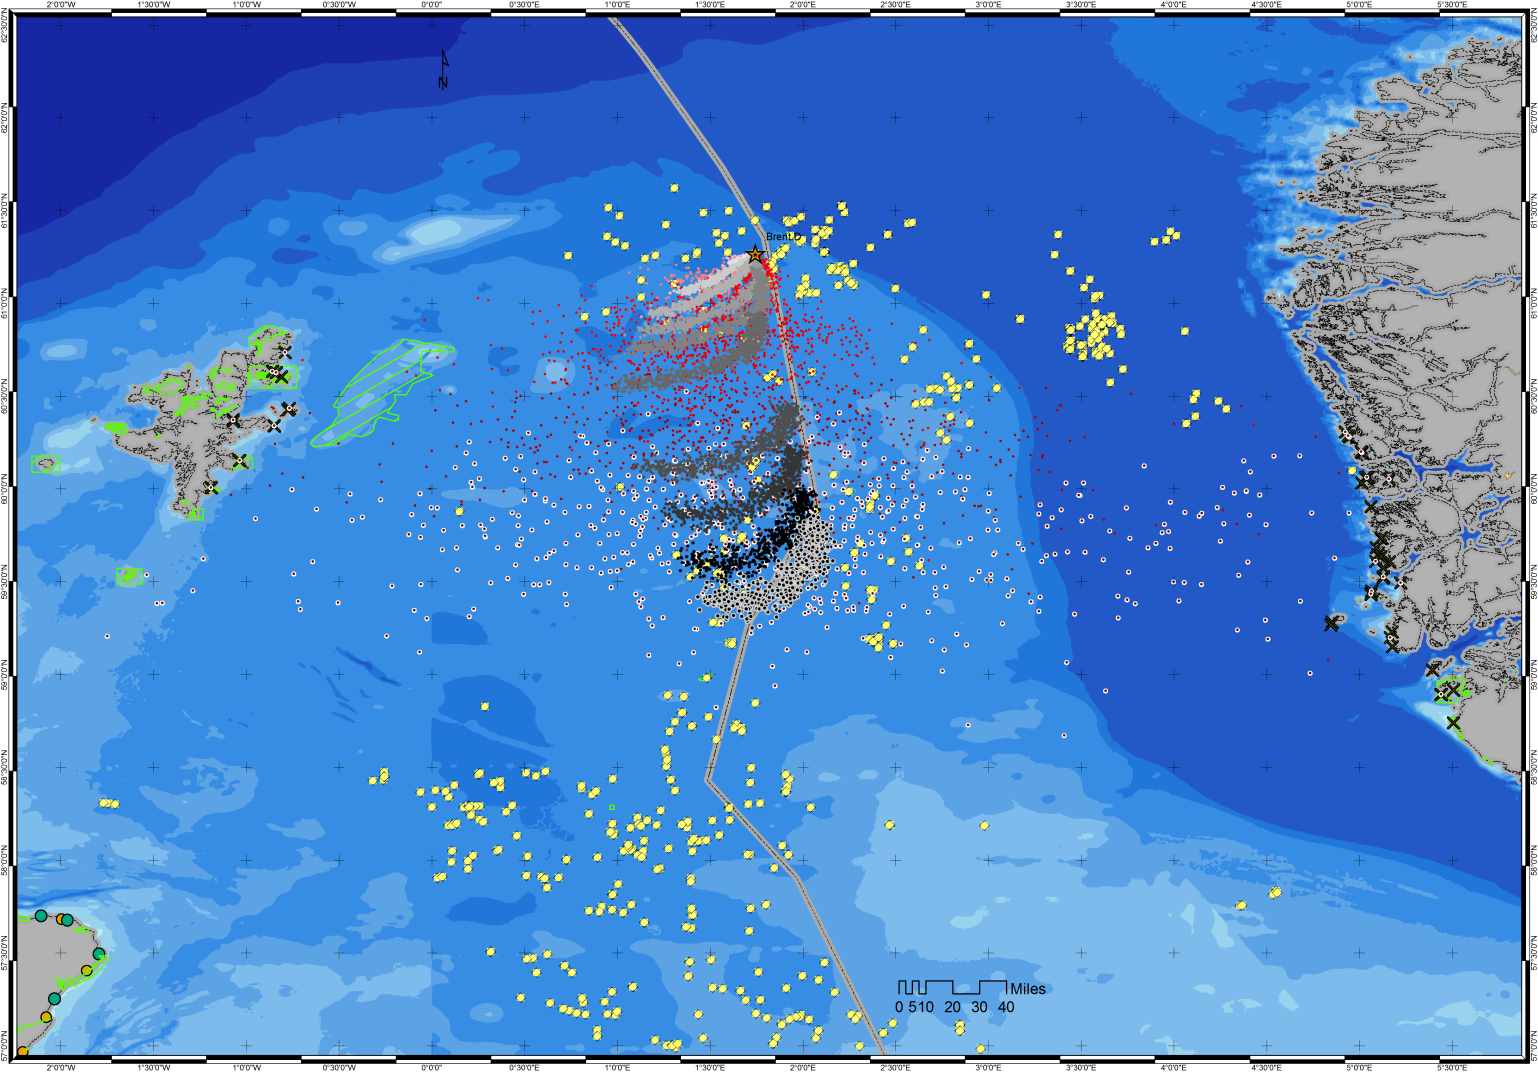
Figure 2 Overview of the impacted location after the Brent Delta spill according to the best guess, no regret simulation.
Oil Spill Challenge Rehearsal
The challenge rehearsal was performed in the Summer of 2014, and after incorporating feedback from project partners and DG-MARE, IMARES were ready and prepared for the real challenge. You can view the results of the challenge rehearsal, based on webpages originally prepared by DG-Mare.
Oil Spill Rehearsal
The Challenge
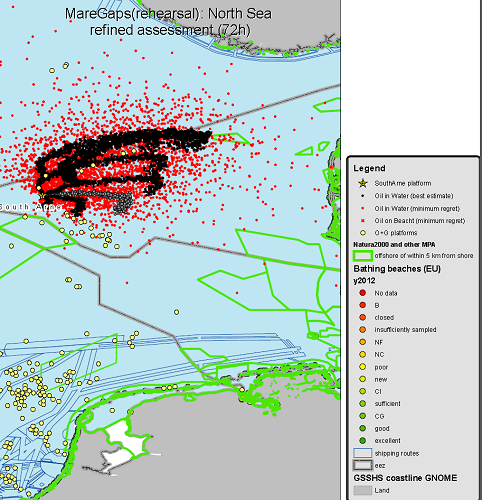
The South Arne platform in Danish waters has had a major disaster (simulation!). Ecoterrorists have taken control of the rig and are diverting the production into the sea. Can you find out where the oil goes and what impact it has on human activity and the ecosystem?
The Method
The response team used the EU's Copernicus marine service forecasting system for current forecasts, the satellite communication company GlobalMarineNet for wind forecasts and NOAA's GNOME system for tracking the spill. The direction and magnitude of currents and winds were available at six hour intervals for a five day period. GNOME interpolates with a time step of 15 minutes. GNOME calculates a 'best estimate' where the oil spill is likely to end up and a 'minimum regret' using conservative assumptions that cause it to spread over a much wider area. It includes output as a movie and this was used to visualise the results (black dots in the movie represent the 'best estimate' oil spill trajectory, red dots represent the 'minimum regret', the purple arrows show both wind strength and direction).
The positions of the slick were output every six hours to a geographical information system (ESRI ArcMap), which was used to ascertain whether the trajectory of the spill came near features such as shipping routes, other oil and gas infrastructure, bathing beaches and marine protected areas. This analysis was ready half an hour after completion of the trajectory model.
The impact data
A digital geographical database of the location and nature of bathing beaches and Natura 2000 nature protection sites was obtained from the European Environment Agency Information on the location of oil platforms and shipping lanes was obtained from a previous project (WindSpeed). This is a collated dataset covering the Central and Southern North Sea (Belgium, Denmark, Germany, Netherlands, Norway, United Kingdom).
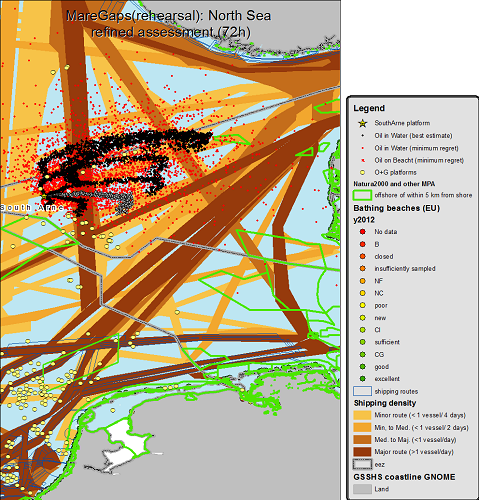
The images below show the situation after 72 hours, showing position with respect to bathing beaches, NATURA sites and oil platforms (left) and bathing beaches, NATURA sites and shipping density (right).
The assumptions
A recent report on Oil and Gas Production in Denmark (2013), gave a total production volume of 700.000 m3 per year for the South Arne location. This report as well as the Subsea IQ website indicated that the geological strata (Danian and Maastrichtian) were similar to the Ekofisk and Tor fields in Norway. Other websites pointed to similar API gravity and sulphur content so the released oil was considered to be light crude similar to the Ekofisk blend. It was therefore assumed that one day's production, 1918 m3, was being lost into the sea at a constant rate. Light crude was not one of the options offered by the models, so the medium-crude option was chosen.
Results after 24 hours
The calculation could continue for only five days because forecasts of wind and waves were not available beyond then. At this time 55% of the oil would still be floating over an area of 260km2 and the rest evaporated or dispersed. The spill would not have reached land and no Nature 2000 sites or tourist sites were threatened. Whilst it would cover some fishing areas, it would not affect major fishing grounds. However, it would affect a region with heavy ship traffic particularly routes between Denmark and Norway and between Germany and Norway. Assuming that the spill continued beyond one day would have resulted in a larger area coverage.
Results after 72 hours
More detailed analysis in the next 72 hours showed that:
- the slick would almost certainly affect other oil platforms - Cecile, Nini and Nini E and possibly also Valdemar and Tyra fields;
- the spawning of major commercial fish stocks will not be affected because cod and plaice spawn earlier (December-February) and herring later (August-December);
- the Danish Natura 2000 area Jyske Reve/Lillefiserbanker which aims to protect seabed reefs and harbour porpoises could be affected; and
- some tiny amounts could reach the coast of Jutland: north of Thyborøn and near Klitmøller and the the island of Bressay in the Shetlands tourist beaches are unlikely to be affected.
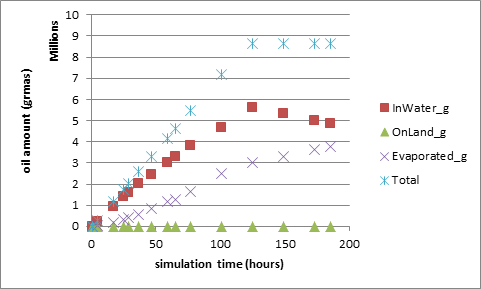
The following graph shows the fate over time of the spilled oil, with an increased total oil amount during the simulated duration of 120 hours (five days). During that time the amount of oil in/on the water increases, as the spill stops, the process of evaporation continues and as a result the amount of oil remaining in/on the water begins to decrease. There is no (appreciable amount of) oil in the simulation that reaches land. The unit of the Y-axis is based on grams of oil as the oil spill trajectory modelling software (GNOME) calculates with that unit. A Million grammes equals a (metric) tonne or 1000 kg.
Accessing the reports on the simulated oil spill
Download the 24h initial assessment report here
Download the 72h refined assessment report here